

- SAP Community
- Products and Technology
- Technology
- Technology Blogs by SAP
- AI-driven Public Urban Transport Optimization: imp...
Technology Blogs by SAP
Learn how to extend and personalize SAP applications. Follow the SAP technology blog for insights into SAP BTP, ABAP, SAP Analytics Cloud, SAP HANA, and more.
Turn on suggestions
Auto-suggest helps you quickly narrow down your search results by suggesting possible matches as you type.
Showing results for
Product and Topic Expert
Options
- Subscribe to RSS Feed
- Mark as New
- Mark as Read
- Bookmark
- Subscribe
- Printer Friendly Page
- Report Inappropriate Content
07-19-2023
4:04 PM
This blog post is part of a series of technical enablement sessions on SAP BTP for Industries. Check the full calendar here to watch the recordings of past sessions and register for the upcoming ones! The replay of the session related to this blog post and all the other sessions are available here.
Authors: kristian.papai, cesare.calabria
In the previous blog post written by my colleague kristian.papai, we introduced the use case of the urban public transport optimization. Let's briefly recap what it is, the solution that we propose in SAP BTP and the components of the solution that we have prototyped and that we will cover in this blog post.
In our use case we are imaging to play the role of a SAP partner who is engaged by a public transport operator in the city of London who need to build an AI-driven solution on top of SAP BTP to optimize the bus service he operates.
The scenario of the public transport is usually very complicated and it can be described only by acquiring different types of data from many data sources, endogenous or exogenous to the enterprise. So, here data is the foundation and for this reason we have conceived the architecture depicted in Figure 1 where we have designed a performant data orchestration with SAP Data Intelligence and we have foreseen a suitable data persistency layer based on SAP Datasphere (which relies on SAP HANA Cloud DB and HANA Data Lake) that will feed the AI algorithms for the timetable optimization in SAP AI Core. The consumption of data and insights from AI is performed in SAP Analytics Cloud.
Below you can find the list of technical topics related to the proposed solution that we will cover in this blog post:
Data ingestion and orchestration for the London bus service
Harmonization and modeling of the London bus service data
Implementing AI for the London bus service
Visualizing insights from data and AI for the London bus service
Let's start our deep dive into the prototype implementation.
Data is the foundation for any analytics solution and the urban public transport is no exception, so let's see what are the main data sources we considered in our prototype and how we can ingest data from them.
As we have learnt from the previous blog post, the public transport industry can produce many data and it can be accurately described only considering several data sources, the endogenous but also exogenous ones.
In our use case we focus on a small but essential subset of data types in the context of the urban public transport: the timetables, the real-time vehicle position, the road disruptions, and the social media. Let’s analyse them one by one and let’s see why they are important in our scenario and where and how they can be acquired.
In our use we focus on the bus service in the city of London. In general, the service timetables are distributed by the agencies, and they are made available publicly for developers and analysts very often through API’s. This is the case of the United Kingdom where the Government provides open data about the bus service in England (Bus Open Data Service).
The timetables are distributed in the General Transit Feed Specification (GTFS) format launched by Google in 2004. Since its release, the GTFS has revolutionized the way to work with public transit data. It defines a common format for public transportation schedules and associated geographic information. A GTFS feed is composed of a series of text files collected in a ZIP file. Each file models a particular aspect of transit information: stops, routes, trips, and other schedule data (see Figure 1).
So, we are basically talking of structured data that together with the entity relationships determine the service timetables and the configuration and performance of the service. For example, let’s consider the bus line 155 in the city of London and let’s imagine we execute the call to the specific API exposed by the UK Government. Once the data are acquired and the relationships are established one can build the following timetable:
Just to give an idea of the data volume, the timetables for the UK bus service are updated 2 times per day and for the city of London the biggest entity (i.e., stop times entity) contains ~1M records.
The real time vehicle location recorded with Automatic Vehicle Location (AVL) systems often based on GPS technology allows agencies to remotely track the location of their vehicle fleet.
Actually, leveraging data from an AVL system can improve transit on-time performance, for example identifying bus stops that do not meet performance standards for on-time performance and factors that cause under-performance.
Usually, this information is also made available openly by agencies through API in the GTFS format. Again, the UK Government exposes a specific API to get the real-time bus location in England. The information is delivered every 10 seconds in the form of structured data. Below (Figure 3) you can see an example of the table you can get from the API for the bus line 155 in London.
Considering that ~8000 buses are operated by different agencies in the city of London, the number of records per day to ingest can be up to ~70M.
Having detailed information about the status of the streets in a city is crucial for planning a public transport service. This information is also made available through an API by the Transport for London.
The mentioned API delivers every 5 minutes the update list of road disruptions in London, below you can see an example table built with the response that one can get from the API: the structure data provides information about the streets impacted, the type of disruptions, the geo coordinates of the disruptions and the start and end dates.
We all know that individuals release information on social media alongside with their location, through global positioning system (GPS) coordinates. The nature of information is mainly unstructured (text, images, videos, etc.), with a lot of noise that needs to be removed, and dynamic.
Social media characteristics, such as the continuous flow of information, user-generated content, and the combination of temporal, spatial, and textual information, have created a current research focus on the exploitation of information that can be extracted from social media platforms in many industries, include the public transport sector.
Some social media sites such as Facebook and Twitter provide application programming interfaces (APIs) that allow crawler applications to directly interface with the data sources.
Such networks are therefore an important potential tool for the public transport sector because the amount of data generated in that context gives the possibility to analyse and investigate with greater precision critical issues of urban mobility.
Social media data can provide useful information for the urban public transportation such as:
From recent studies it turned out that Twitter is probably the most suitable social media network for the public transport since it is able to provide information on almost all the relevant topics (see figure below). This is the reason why we considered specifically Twitter in our solution.
In general, there are different modes to access to the social network data: one can access on time-based mode or setting up a stream, for example filtering the posts by looking for specific hashtags, keyword or by setting rules (for instance, let's think about the filtered stream in Twitter).
Another possibility is the event-based access: imagine, for example, that you can get and event from another system and that this event triggers the search for posts base on certain hashtags or keywords. This is an effective way to proceed if you are able to capture anomalies on your network, but you don’t know exactly the reason behind them. The explanation can come from a search on Twitter.
Another important information that can come from a social network is the number of posts on a certain topic and the number of likes acquired by a post on a certain topic. This information can be strictly related to the interest of people in certain events happening (or that will happen) in the city and certain areas of the city.
We have seen the data sources we need to consider in our use case, now we need a tool that allows to ingest, transform, and orchestrate data in real-time from those data sources. Actually we have such a tool in SAP BTP and it is SAP Data Intelligence (DI) Cloud.
Data Intelligence Cloud is designed to provide data integration, data quality, and data governance capabilities. It provides a unified platform for managing and orchestrating data pipelines, enabling integration of diverse data sources and systems, exactly what is needed in the urban public transport scenario.
DI provides an intuitive interface and drag-and-drop functionality, so that users can easily design and deploy data pipelines, perform data transformations and enrichments, and gain insights through advanced analytics and machine learning. The extensibility of data pipelines is supported by a vast library of over 250 pre-defined operators. These operators cover a wide range of functionalities, including data integration, connectivity, processing, data quality, and machine learning. Moreover, custom operators can be created, allowing for tailored solutions to specific business needs. As you will see, this is what we will do in our prototype.
The execution of operators is containerized by using Docker, this ensures their execution in isolated and consistent environments, contributing to scalability. Horizontal scaling is also possible, facilitating the processing of large volumes of data.
Reusability is another crucial aspect of data pipelines developed in DI. Users can create complex and multistep pipelines, which can be easily modularized and reused in other pipelines. This promotes efficiency and saves time by eliminating the need to recreate similar workflows.
Let’s see how we used DI to build all the pipelines needed to handle the urban public transport scenario.
Let’s start from the most important pipeline, the one used to get data about the bus location in the city of London. As I anticipated, we will create our own custom operator in Python to perform this operation. In Fig. 6 you can see our pipeline workflow, where we are making use of one custom python operator, and we are using as storage element the HANA Cloud DB behind SAP Datasphere. Let’s have a closer look at it.
The pipeline starts retrieving the previous locations of all the buses from a technical table in the underlying HANA DB in Datasphere, this will be needed later for the average speed calculation. After that, we execute a new call to the API exposed by the UK Government to get the current bus locations. In the third step we transform and prepare the acquired data, and finally we proceed with the average bus speed calculation, and we save all the enriched data into a specific table created in the underlying HANA DB in Datasphere.
Let’s explore how this data pipeline can be developed and deployed in SAP DI by watching the following video.
The custom Python operator we have created is highly reusable and adaptable to perform any other API integration, it is enough to create another instance and modify the script it wraps. This is what we did for example to ingest data about the road disruptions in the city of London, another crucial information for planning a public transport service. First, let’s have a look at the workflow below (Fig. 7). This time the operator executes only three steps: in the first one it executes an API call to the API exposed by Transport for London, after that it prepare the data and in the last step it saves the data into a specific HANA DB table in Datasphere.
We can have a look at how the Python script changed in this case, and you can notice is much simpler: it makes use of a standard Python package (Requests) to execute the API call, then Pandas dataframe is used to manipulate the data and a HANA ML module (dataframe) is used to save the response into a table in the HANA DB.
The data about the London road disruptions are used to build a specific analytic model in Datasphere, as it will be shown later in this blog post, and that analytic model will be used to populate a geo map in SAC like the one shown in the introductory demo (see screenshot below in Fig. 9).
Now, let’s see how we can further modify the pipeline and the python operator in order to get data from a social network like Twitter. Let’s refer to the new workflow in Fig. 10. This time the workflow starts with the authentication to the Twitter service and then, once the access mode is decided, the Python operator executes a call to the exposed API. At this point there are two possible options: the first one is to get the unstructured data and save it as HANA Data Lake files for later processing, the other one is to consume on the fly a ML algorithm deployed in SAP AI Core or made available online by third parties. The ML algorithm role would be to interpret the unstructured data (text, images, videos) acquired by Twitter (by means of NLP or computer vision techniques). For example, we can imagine having deployed a computer vision advanced algorithm to classify what is represented in the images. In this case, we can save only the output of the inference step into a dedicated table in the underlying HANA DB. This is probably the most frequent procedure in data science.
At this point, how would we use these insights from ML? They can be used to build an interactive dashboard that can provide a comprehensive view of the criticalities and events that are happening or about to happen in the city. Fig. 11 shows how such a dashboard could look like. It can play a crucial role in supporting decision making allowing prompt reaction in the context of urban mobility.
It is clear now that the public transport generates many data, and it requires just as much data from other exogenous sources. The data are collected and harmonized in unified views leading to a centralized repository of digitally stored business information (data warehouse), we will see later how. So, you can understand this huge amount of data cannot be kept all in the hot storage of the solution. Let’s think about the bus real-time locations. We can expect to load up to 70 M records per day only in the city of London. The need to move part of this data into a cheaper cold storage comes naturally.
SAP HANA Cloud provides a large scale queryable data lake that can be used to store large amount of (cold) data. SAP HANA Cloud Data Lake can be enabled as an integrated solution in Datasphere or it can be provisioned as a stand-alone product. In our use case solution, we integrate also HANA Cloud Data Lake Relation Engine in order to save the historical data about the bus locations. But how can we move all those data? Actually, DI can help on this point, in fact it can be used to create a pipeline to orchestrate the data tiering process between HANA Cloud DB and the HANA Cloud Data Lake.
Fig. 13 shows an example of how this pipeline could look like. We have several steps: in the first step we load the data we want to move from the HANA DB table. Then we write the data into a table with the same structure into the Data Lake. We take note of the timestamp of the data we have already moved into a HANA DB technical table and finally we make use of that timetable to delete the moved records in the HANA DB table.
Let’s see in the following video recording how such a pipeline can be built in SAP Digital Intelligence.
Let’s now focus on the role of SAP Digital Vehicle Hub (DVH) that you have seen in the solution architecture.
The Digital Vehicle Hub represents the digital twin for any ground transportation object, which integrates and interacts seamlessly along the automotive and mobility value chain in the cloud. It serves as a central repository to manage all types of vehicle related master, transactional and usage data. The information is built and shared between internal and external business partners to enable and handle collaborative business models and processes along the automotive and mobility value chain.
It is very probable that you can find this SAP core component in the landscape of a customer in the transport sector. For our purposes SAP DVH plays the role of an additional source of data. In particular, we are interested in the master data about the fleet and the planned maintenance of the vehicles, essential information in case we want to enhance the service or react promptly to critical issues.
The next video recording will help us to understand how to integrate this component directly to SAP Datasphere.
Previously we have used the SAP Data Intelligence, where the data ingestion and orchestration had been performed. Now we are moving to the next stage where we would use the SAP Datasphere, which is a comprehensive data service built on the SAP Business Technology Platform (SAP BTP) and it represents the foundation for a business data fabric. SAP Datasphere is responsible for Data Warehousing in BTP and the foundation for the data warehousing is the underlying SAP HANA Cloud.
Let's have a look at the most relevant capabilities of SAP Datasphere, for example the integration of data sources. Integration in Datasphere can happen in several ways: virtual access to remote table (remote table federation), remote table replication (single or multiple entities), batch loads (data flows). Datasphere allows also external data movement tools (SAP and non-SAP). For example, we have used SAP Data Intelligence to bring data into the system in real-time, this feature is currently not available yet in SAP Datasphere.
Datasphere offers the possibility to transform and model the data in several ways, such as transformation directly during batch loads with data flows or through graphical and SQL views. Graphical and SQL views alongside with analytic model provide the tools for covering any need concerning data modelling.
Now let's see how we can use these capabilities for harmonizing and modeling the data of the London bus service.
Figure 16 describes in detail what we have at this point and what we would like to achieve with Datasphere.
In the lowest layers, we have several tables: remote tables we access as federated data (from HANA Data Lake and DVH), and other local tables we populated with Data Intelligence. All the data contained in these tables will be further transformed, harmonized by means of the forementioned Graphical and SQL Views in the central layer.
All this work is preparatory for last step in the upper layer, where we prepare the unified views that will be used for specific analytical purposes in our use case.
These unified views are based on the entity relationships defined on the target tables of the Graphical Views and are built with the help of this new analytic model in Datasphere.
Let’s see a demo where we demonstrate how to build in SAP Datasphere the most important Graphical View for this use case, that is the "vehicle activity view" containing the real-time information about the London buses.
Now, assuming we have built all the other Graphical Views in a similar way, we can see in the next demo how all these views contribute to the creation of the final models for the urban public transport use case. In particular, we will focus on the most important analytic model, the one that will combine in a single view the real-time positions of the buses and the service timetables that we named "urban public transport model".
As seen in the previous blog post, AI is essential to achieve an efficient public transport service. All we have described so far (data ingestion, orchestration, and preparation) is the foundation for many possible applications, but in our use case the data are meant to be used specifically for feeding AI algorithms.
In SAP, we can think of using SAP AI Core for such use cases. We did not cover this aspect in our prototype, but we would like to spend a few words to discuss how you can integrate AI in the architecture. Let’s focus in particular on the timetable optimization problem.
Let’s try to understand first what optimization is. A simple example of optimization is the travelling salesman problem: the salesman has to visit different customers. What’s the order that allows him to visit everyone in the shortest time? There are multiple possible combinations, but the challenge is to find the one that optimise a certain quantity (distance, time, etc).
To solve this kind of problems, one has to proceed iteratively by comparing all the possible solutions unless the optimal one is found. In other words, one has to execute an optimization algorithm. An optimization algorithm is a search method, where a procedure is executed iteratively by comparing various solutions till an optimum or a satisfactory solution is found, such that a given quantity (called objective function) is optimized.
For the public transport, the problem is much more complicated than the travelling salesman problem, because there are multiple variables to optimise at the same time (multi-objective optimization problem). For example, we can name a few possible objectives:
In general, optimization in the context of public transportation is an extremely difficult task even for small transit network because of the large number of variables and constraints and the discrete nature of variables and non-linearity of the objective function.
To solve the optimization problems, many heuristic algorithms are very popular in the public transport sector. We can mention the evolutionary algorithm, for example:
ACO, BCO, PCO are part of the so-called swarm intelligence systems. The intelligent computational analytics of these system are able to represent uncertainty, imprecision and vague concepts, hence these techniques are used for route optimization problems in the transport sector.
Once the objectives of the optimization problem are determined and the algorithm is chosen, one needs an environment where to execute the algorithm. Let’s see how SAP AI Core can accomplish this task.
First of all, let’s introduce this new service provided by SAP: AI Core is a runtime designed to develop and deploy custom and advanced AI solutions in the cloud using open-source frameworks. To this end, it integrates with the most popular tools for developing cloud native AI solutions, like GitHub, Docker and the hyperscaler object stores. Recently we as BTP Solution Architects have delivered a nice openSAP course on this topic that you can refer to in case you are interested in understanding the capabilities and possible usages of AI Core.
Usually, an AI model needs a training phase and a deployment phase, something AI Core is designed for. Anyway, AI Core is also suitable for running batch executions, what we need for a complex algorithm like the ones mentioned above for the public transport sector. Let’s see how to do it with the help of Fig. 18.
Everything starts with the code that includes the chosen algorithm. AI Core is agnostic from the point of view of the programming language because any code is run in the form of Docker containers. So once you have prepared your code you need to dockerize it and load the Docker image into a Docker repository so that it is available for consumption in the cloud.
Then you need to prepare your input dataset and load it in a cloud storage element. When working with AI Core there is the possibility to read data from any hyperscaler object store or from the HANA Data Lake. Recently SAP added the possibility to use data lake files, and indeed this is what we are considering in our solution.
In our use case we acquired data from a number of sources. Probably this data is not enough to optimize all the quantities we mentioned in the previous section, but they are already enough to perform for example an optimization of some lines of the London bus service in terms of total travel time. So let’s imagine our input dataset is made of the current timetable of line 155 (representing the current configuration of the line), the current road disruptions and the current bus total travel time and bus average speeds that quantify the current performance of the line.
At this point a so-called workflow template is needed. It is a YAML declarative configuration file (based on the Argo Workflow Engine prescriptions) that is used to instruct AI Core about the containers to run and how, about the datasets to use and where to save the output of the execution, about the computing resources to allocate for the execution. The file is hosted by GitHub and AI Core reads time by time the content of this files and aligns its configuration.
Once all these ingredients are ready, AI Core is ready as well to start the execution of the algorithm and, if some metrics have been defined in the code, then one can also follow the execution in SAP AI Launchpad that plays the role of graphical client for AI Core. At the end of the execution, AI Core writes the output into the chosen storage element. In our case it would be the HANA Data Lake, and the output would be the optimized timetable for line 155.
In every end-to-end solution visualization is crucial to consume data, get insights and support decision making. In our use case the data we acquired and we prepared can be used already to build several types of dashboards targeting different personas as we have seen in the solution description. In particular a monitoring dashboard for the bus service in the city of London and a simple anomaly detection tool can be immediately developed on top of this data. The front-end part of the solution could be also designed in order to properly consume the outcomes of the AI algorithms (let's think about Twitter).
There are many possibilities for developing the front-end of a solution like the one we propose, anyway we are considering as first option SAP Analytics Cloud, the most user-friendly one that allows already to create appealing and interactive dashboards without requiring extensive technical expertise.
SAP Analytics Cloud (SAC) is a Software as a Service Cloud solution and it covers three types of analytics area: Business Intelligence, Augmented Analytics and Enterprise Planning in a single solution.
SAC offers a user-friendly interface that also allows users to easily create, customize, and interact with enterprise reports. It allows to create highly interactive dashboards with Linked Analysis, Ranking and Sorting, Filtering and Drill Functionality.
It provides extensive visualization library, geo maps powered by ESRI and custom R visualizations. Moreover, it allows also to define custom calculations, calculated dimensions, and aggregations.
Since for this use case we are not prototyping the AI part, we will see in the following short video how to use SAC to develop the forementioned monitoring dashboards for the London bus service by consuming the analytics models we have prepared in Datasphere.
In this journey we had the chance to understand the complexity and importance of the urban public transport for our cities, society, and environment. Moreover, we understood how big data and AI can be used to improve the planning, designing and operations of a public transport network.
In this scenario we have learnt how SAP BTP can be used to build an end-to-end solution powered by AI to solve the key problems of the public transport industry and achieve a high-performance service.
As mentioned in the introduction to this series of sessions about real-life use cases, our goal was to provide some content that could inspire you. In fact, what is presented and prototyped (which will also be provided in the form of a GitHub repository) is meant to be reusable, not only in the public transport industry, but in all those complex scenarios that can only be managed by combining data and AI into a synergistic relationship.
Below we prepared for you a collection of useful links related to the topics we covered in our use case.
Authors: kristian.papai, cesare.calabria
Introduction
In the previous blog post written by my colleague kristian.papai, we introduced the use case of the urban public transport optimization. Let's briefly recap what it is, the solution that we propose in SAP BTP and the components of the solution that we have prototyped and that we will cover in this blog post.
In our use case we are imaging to play the role of a SAP partner who is engaged by a public transport operator in the city of London who need to build an AI-driven solution on top of SAP BTP to optimize the bus service he operates.
The scenario of the public transport is usually very complicated and it can be described only by acquiring different types of data from many data sources, endogenous or exogenous to the enterprise. So, here data is the foundation and for this reason we have conceived the architecture depicted in Figure 1 where we have designed a performant data orchestration with SAP Data Intelligence and we have foreseen a suitable data persistency layer based on SAP Datasphere (which relies on SAP HANA Cloud DB and HANA Data Lake) that will feed the AI algorithms for the timetable optimization in SAP AI Core. The consumption of data and insights from AI is performed in SAP Analytics Cloud.

Figure 1: Solution architecture for the urban public transport use case.
Below you can find the list of technical topics related to the proposed solution that we will cover in this blog post:
Data ingestion and orchestration for the London bus service
- Data ingestion pipelines with SAP Data Intelligence
- Data tiering with SAP Data Intelligence
- Integration of SAP Digital Vehicle Hub
Harmonization and modeling of the London bus service data
- Harmonizing and modeling data with SAP Datasphere graphical & SQL views
- Harmonizing data SAP Datasphere Analytic Models
Implementing AI for the London bus service
- Introducing the optimization problem in the urban public transport context
- Hints about how to execute an optimization algorithm in SAP AI Core
Visualizing insights from data and AI for the London bus service
- Relevant aspects of the development of SAC stories for the urban public transport use case
Let's start our deep dive into the prototype implementation.
Data ingestion and orchestration for the London bus service
Data is the foundation for any analytics solution and the urban public transport is no exception, so let's see what are the main data sources we considered in our prototype and how we can ingest data from them.
Data sources
As we have learnt from the previous blog post, the public transport industry can produce many data and it can be accurately described only considering several data sources, the endogenous but also exogenous ones.
In our use case we focus on a small but essential subset of data types in the context of the urban public transport: the timetables, the real-time vehicle position, the road disruptions, and the social media. Let’s analyse them one by one and let’s see why they are important in our scenario and where and how they can be acquired.
Bus timetables
In our use we focus on the bus service in the city of London. In general, the service timetables are distributed by the agencies, and they are made available publicly for developers and analysts very often through API’s. This is the case of the United Kingdom where the Government provides open data about the bus service in England (Bus Open Data Service).
The timetables are distributed in the General Transit Feed Specification (GTFS) format launched by Google in 2004. Since its release, the GTFS has revolutionized the way to work with public transit data. It defines a common format for public transportation schedules and associated geographic information. A GTFS feed is composed of a series of text files collected in a ZIP file. Each file models a particular aspect of transit information: stops, routes, trips, and other schedule data (see Figure 1).

Figure 1: The txt mandatory and optional files that compose a GTFS feed (source here).
So, we are basically talking of structured data that together with the entity relationships determine the service timetables and the configuration and performance of the service. For example, let’s consider the bus line 155 in the city of London and let’s imagine we execute the call to the specific API exposed by the UK Government. Once the data are acquired and the relationships are established one can build the following timetable:

Figure 2: Timetable for bus line 155.
Just to give an idea of the data volume, the timetables for the UK bus service are updated 2 times per day and for the city of London the biggest entity (i.e., stop times entity) contains ~1M records.
Real-time bus location
The real time vehicle location recorded with Automatic Vehicle Location (AVL) systems often based on GPS technology allows agencies to remotely track the location of their vehicle fleet.
Actually, leveraging data from an AVL system can improve transit on-time performance, for example identifying bus stops that do not meet performance standards for on-time performance and factors that cause under-performance.
Usually, this information is also made available openly by agencies through API in the GTFS format. Again, the UK Government exposes a specific API to get the real-time bus location in England. The information is delivered every 10 seconds in the form of structured data. Below (Figure 3) you can see an example of the table you can get from the API for the bus line 155 in London.

Figure 3: Example of output of the Location data API.
Considering that ~8000 buses are operated by different agencies in the city of London, the number of records per day to ingest can be up to ~70M.
Road disruptions
Having detailed information about the status of the streets in a city is crucial for planning a public transport service. This information is also made available through an API by the Transport for London.
The mentioned API delivers every 5 minutes the update list of road disruptions in London, below you can see an example table built with the response that one can get from the API: the structure data provides information about the streets impacted, the type of disruptions, the geo coordinates of the disruptions and the start and end dates.
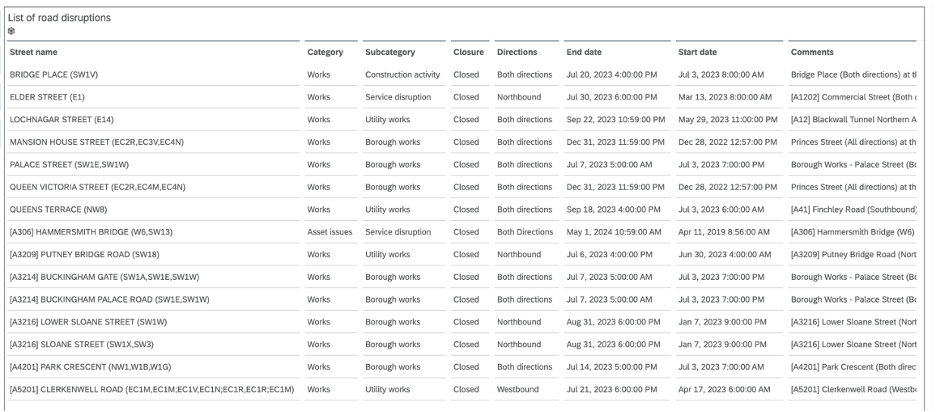
Figure 4: Example of road disruptions in the city of London.
Social media in the public transport sector
We all know that individuals release information on social media alongside with their location, through global positioning system (GPS) coordinates. The nature of information is mainly unstructured (text, images, videos, etc.), with a lot of noise that needs to be removed, and dynamic.
Social media characteristics, such as the continuous flow of information, user-generated content, and the combination of temporal, spatial, and textual information, have created a current research focus on the exploitation of information that can be extracted from social media platforms in many industries, include the public transport sector.
Some social media sites such as Facebook and Twitter provide application programming interfaces (APIs) that allow crawler applications to directly interface with the data sources.
Such networks are therefore an important potential tool for the public transport sector because the amount of data generated in that context gives the possibility to analyse and investigate with greater precision critical issues of urban mobility.
Social media data can provide useful information for the urban public transportation such as:
- Origin-destination data;
- Socio-economic and contextual data;
- Evidence on mode demand;
- Evidence on link demand;
- Estimation of travel times;
- Evidence on demand for responsive agencies;
- Detection of many types of events and incidents;
- Information for understanding mode choice rationale;
- Data from non-motorized modes (such as bike riders and pedestrians);
- Analysis of text content can be effective in generating service quality data and in supplementing or replacing public opinion data sources.
From recent studies it turned out that Twitter is probably the most suitable social media network for the public transport since it is able to provide information on almost all the relevant topics (see figure below). This is the reason why we considered specifically Twitter in our solution.

Figure 5: Social media and transport-related information (source here).
In general, there are different modes to access to the social network data: one can access on time-based mode or setting up a stream, for example filtering the posts by looking for specific hashtags, keyword or by setting rules (for instance, let's think about the filtered stream in Twitter).
Another possibility is the event-based access: imagine, for example, that you can get and event from another system and that this event triggers the search for posts base on certain hashtags or keywords. This is an effective way to proceed if you are able to capture anomalies on your network, but you don’t know exactly the reason behind them. The explanation can come from a search on Twitter.
Another important information that can come from a social network is the number of posts on a certain topic and the number of likes acquired by a post on a certain topic. This information can be strictly related to the interest of people in certain events happening (or that will happen) in the city and certain areas of the city.
The role of SAP Data Intelligence
We have seen the data sources we need to consider in our use case, now we need a tool that allows to ingest, transform, and orchestrate data in real-time from those data sources. Actually we have such a tool in SAP BTP and it is SAP Data Intelligence (DI) Cloud.
Data Intelligence Cloud is designed to provide data integration, data quality, and data governance capabilities. It provides a unified platform for managing and orchestrating data pipelines, enabling integration of diverse data sources and systems, exactly what is needed in the urban public transport scenario.
DI provides an intuitive interface and drag-and-drop functionality, so that users can easily design and deploy data pipelines, perform data transformations and enrichments, and gain insights through advanced analytics and machine learning. The extensibility of data pipelines is supported by a vast library of over 250 pre-defined operators. These operators cover a wide range of functionalities, including data integration, connectivity, processing, data quality, and machine learning. Moreover, custom operators can be created, allowing for tailored solutions to specific business needs. As you will see, this is what we will do in our prototype.
The execution of operators is containerized by using Docker, this ensures their execution in isolated and consistent environments, contributing to scalability. Horizontal scaling is also possible, facilitating the processing of large volumes of data.
Reusability is another crucial aspect of data pipelines developed in DI. Users can create complex and multistep pipelines, which can be easily modularized and reused in other pipelines. This promotes efficiency and saves time by eliminating the need to recreate similar workflows.
Let’s see how we used DI to build all the pipelines needed to handle the urban public transport scenario.
Data ingestion pipelines for the London bus service with SAP Data Intelligence
Let’s start from the most important pipeline, the one used to get data about the bus location in the city of London. As I anticipated, we will create our own custom operator in Python to perform this operation. In Fig. 6 you can see our pipeline workflow, where we are making use of one custom python operator, and we are using as storage element the HANA Cloud DB behind SAP Datasphere. Let’s have a closer look at it.
The pipeline starts retrieving the previous locations of all the buses from a technical table in the underlying HANA DB in Datasphere, this will be needed later for the average speed calculation. After that, we execute a new call to the API exposed by the UK Government to get the current bus locations. In the third step we transform and prepare the acquired data, and finally we proceed with the average bus speed calculation, and we save all the enriched data into a specific table created in the underlying HANA DB in Datasphere.

Figure 6: Workflow of the ingestion pipeline to get the bus location in the city of London.
Let’s explore how this data pipeline can be developed and deployed in SAP DI by watching the following video.
The custom Python operator we have created is highly reusable and adaptable to perform any other API integration, it is enough to create another instance and modify the script it wraps. This is what we did for example to ingest data about the road disruptions in the city of London, another crucial information for planning a public transport service. First, let’s have a look at the workflow below (Fig. 7). This time the operator executes only three steps: in the first one it executes an API call to the API exposed by Transport for London, after that it prepare the data and in the last step it saves the data into a specific HANA DB table in Datasphere.

Figure 7: Workflow of the pipeline to ingest the London road disruptions.
We can have a look at how the Python script changed in this case, and you can notice is much simpler: it makes use of a standard Python package (Requests) to execute the API call, then Pandas dataframe is used to manipulate the data and a HANA ML module (dataframe) is used to save the response into a table in the HANA DB.

Figure 8: Code snippet for the road disruption API integration.
The data about the London road disruptions are used to build a specific analytic model in Datasphere, as it will be shown later in this blog post, and that analytic model will be used to populate a geo map in SAC like the one shown in the introductory demo (see screenshot below in Fig. 9).

Figure 9: Example of disrupted road in city of London, closed for works in one direction.
Now, let’s see how we can further modify the pipeline and the python operator in order to get data from a social network like Twitter. Let’s refer to the new workflow in Fig. 10. This time the workflow starts with the authentication to the Twitter service and then, once the access mode is decided, the Python operator executes a call to the exposed API. At this point there are two possible options: the first one is to get the unstructured data and save it as HANA Data Lake files for later processing, the other one is to consume on the fly a ML algorithm deployed in SAP AI Core or made available online by third parties. The ML algorithm role would be to interpret the unstructured data (text, images, videos) acquired by Twitter (by means of NLP or computer vision techniques). For example, we can imagine having deployed a computer vision advanced algorithm to classify what is represented in the images. In this case, we can save only the output of the inference step into a dedicated table in the underlying HANA DB. This is probably the most frequent procedure in data science.

Figure 10: Workflow explaining the main steps to build a pipeline to get data from Twitter.
At this point, how would we use these insights from ML? They can be used to build an interactive dashboard that can provide a comprehensive view of the criticalities and events that are happening or about to happen in the city. Fig. 11 shows how such a dashboard could look like. It can play a crucial role in supporting decision making allowing prompt reaction in the context of urban mobility.

Figure 11: Geo map in SAC displaying events reported by users on Twitter (simulated data).
Data tiering with SAP Data Intelligence
It is clear now that the public transport generates many data, and it requires just as much data from other exogenous sources. The data are collected and harmonized in unified views leading to a centralized repository of digitally stored business information (data warehouse), we will see later how. So, you can understand this huge amount of data cannot be kept all in the hot storage of the solution. Let’s think about the bus real-time locations. We can expect to load up to 70 M records per day only in the city of London. The need to move part of this data into a cheaper cold storage comes naturally.

Figure 12: Data layers in SAP HANA Cloud.
SAP HANA Cloud provides a large scale queryable data lake that can be used to store large amount of (cold) data. SAP HANA Cloud Data Lake can be enabled as an integrated solution in Datasphere or it can be provisioned as a stand-alone product. In our use case solution, we integrate also HANA Cloud Data Lake Relation Engine in order to save the historical data about the bus locations. But how can we move all those data? Actually, DI can help on this point, in fact it can be used to create a pipeline to orchestrate the data tiering process between HANA Cloud DB and the HANA Cloud Data Lake.
Fig. 13 shows an example of how this pipeline could look like. We have several steps: in the first step we load the data we want to move from the HANA DB table. Then we write the data into a table with the same structure into the Data Lake. We take note of the timestamp of the data we have already moved into a HANA DB technical table and finally we make use of that timetable to delete the moved records in the HANA DB table.

Figure 13: Workflow to move data from HANA Cloud DB to HANA Cloud Data Lake Relational Engine.
Let’s see in the following video recording how such a pipeline can be built in SAP Digital Intelligence.
Integration of SAP Digital Vehicle Hub
Let’s now focus on the role of SAP Digital Vehicle Hub (DVH) that you have seen in the solution architecture.
The Digital Vehicle Hub represents the digital twin for any ground transportation object, which integrates and interacts seamlessly along the automotive and mobility value chain in the cloud. It serves as a central repository to manage all types of vehicle related master, transactional and usage data. The information is built and shared between internal and external business partners to enable and handle collaborative business models and processes along the automotive and mobility value chain.
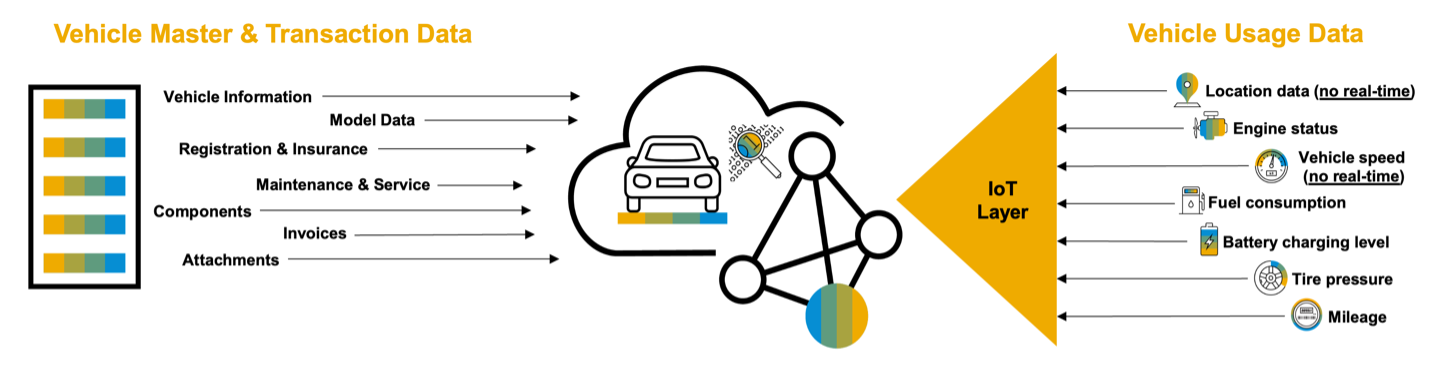
Figure 14: Types of data stored in SAP Digital Vehicle Hub.
It is very probable that you can find this SAP core component in the landscape of a customer in the transport sector. For our purposes SAP DVH plays the role of an additional source of data. In particular, we are interested in the master data about the fleet and the planned maintenance of the vehicles, essential information in case we want to enhance the service or react promptly to critical issues.
The next video recording will help us to understand how to integrate this component directly to SAP Datasphere.
Harmonization and modeling of the London bus service data
The role of SAP Datasphere
Previously we have used the SAP Data Intelligence, where the data ingestion and orchestration had been performed. Now we are moving to the next stage where we would use the SAP Datasphere, which is a comprehensive data service built on the SAP Business Technology Platform (SAP BTP) and it represents the foundation for a business data fabric. SAP Datasphere is responsible for Data Warehousing in BTP and the foundation for the data warehousing is the underlying SAP HANA Cloud.

Figure 15: SAP Datasphere capabilities.
Let's have a look at the most relevant capabilities of SAP Datasphere, for example the integration of data sources. Integration in Datasphere can happen in several ways: virtual access to remote table (remote table federation), remote table replication (single or multiple entities), batch loads (data flows). Datasphere allows also external data movement tools (SAP and non-SAP). For example, we have used SAP Data Intelligence to bring data into the system in real-time, this feature is currently not available yet in SAP Datasphere.
Datasphere offers the possibility to transform and model the data in several ways, such as transformation directly during batch loads with data flows or through graphical and SQL views. Graphical and SQL views alongside with analytic model provide the tools for covering any need concerning data modelling.
Now let's see how we can use these capabilities for harmonizing and modeling the data of the London bus service.
Creating the urban public transport unified views
Figure 16 describes in detail what we have at this point and what we would like to achieve with Datasphere.
Figure 16: London bus services entities in SAP Datasphere.
In the lowest layers, we have several tables: remote tables we access as federated data (from HANA Data Lake and DVH), and other local tables we populated with Data Intelligence. All the data contained in these tables will be further transformed, harmonized by means of the forementioned Graphical and SQL Views in the central layer.
All this work is preparatory for last step in the upper layer, where we prepare the unified views that will be used for specific analytical purposes in our use case.
These unified views are based on the entity relationships defined on the target tables of the Graphical Views and are built with the help of this new analytic model in Datasphere.
Let’s see a demo where we demonstrate how to build in SAP Datasphere the most important Graphical View for this use case, that is the "vehicle activity view" containing the real-time information about the London buses.
Now, assuming we have built all the other Graphical Views in a similar way, we can see in the next demo how all these views contribute to the creation of the final models for the urban public transport use case. In particular, we will focus on the most important analytic model, the one that will combine in a single view the real-time positions of the buses and the service timetables that we named "urban public transport model".
Implementing AI for the London bus service
As seen in the previous blog post, AI is essential to achieve an efficient public transport service. All we have described so far (data ingestion, orchestration, and preparation) is the foundation for many possible applications, but in our use case the data are meant to be used specifically for feeding AI algorithms.
In SAP, we can think of using SAP AI Core for such use cases. We did not cover this aspect in our prototype, but we would like to spend a few words to discuss how you can integrate AI in the architecture. Let’s focus in particular on the timetable optimization problem.
What is optimization?
Let’s try to understand first what optimization is. A simple example of optimization is the travelling salesman problem: the salesman has to visit different customers. What’s the order that allows him to visit everyone in the shortest time? There are multiple possible combinations, but the challenge is to find the one that optimise a certain quantity (distance, time, etc).
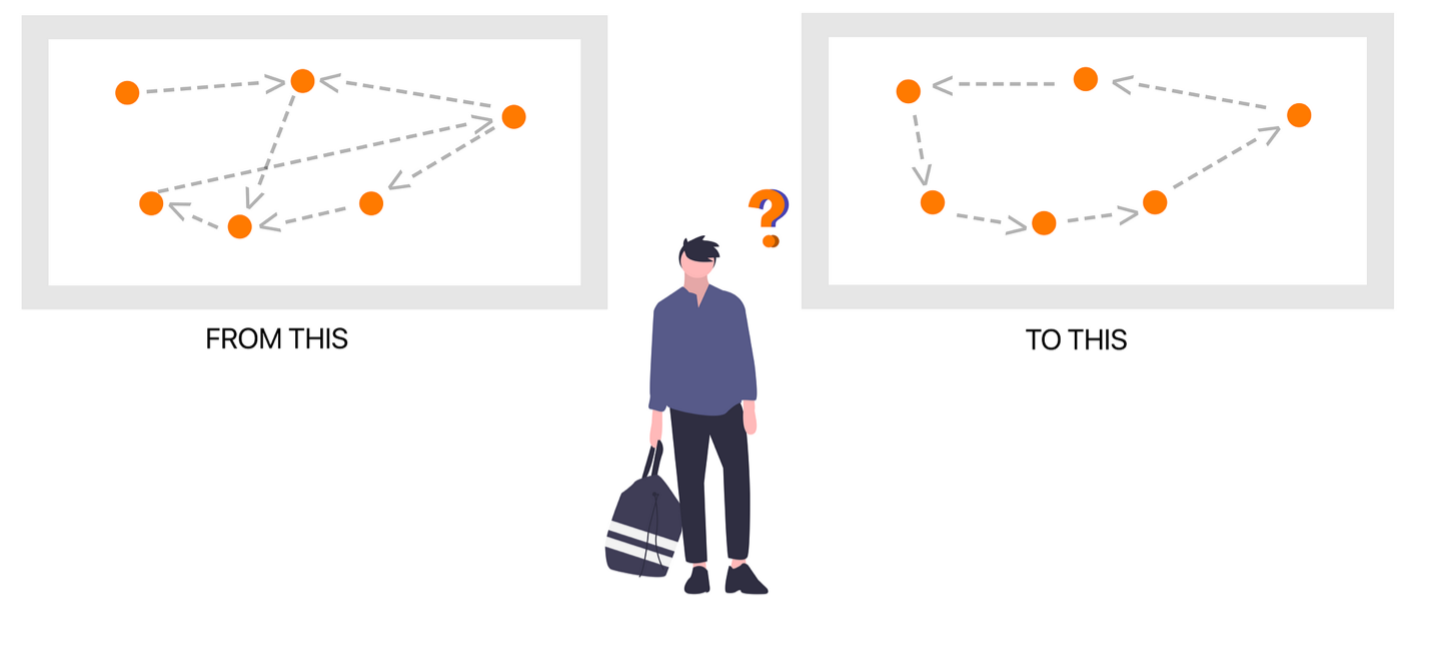
Figure 17: The travelling salesman problem.
To solve this kind of problems, one has to proceed iteratively by comparing all the possible solutions unless the optimal one is found. In other words, one has to execute an optimization algorithm. An optimization algorithm is a search method, where a procedure is executed iteratively by comparing various solutions till an optimum or a satisfactory solution is found, such that a given quantity (called objective function) is optimized.
For the public transport, the problem is much more complicated than the travelling salesman problem, because there are multiple variables to optimise at the same time (multi-objective optimization problem). For example, we can name a few possible objectives:
- Minimize travel time;
- Minimize waiting time;
- Maximize vehicles’ occupancy;
- Minimize the energy consumption;
- Minimize the total travel time;
- Minimize the interchange waiting times (timetable synchronization problem),
In general, optimization in the context of public transportation is an extremely difficult task even for small transit network because of the large number of variables and constraints and the discrete nature of variables and non-linearity of the objective function.
To solve the optimization problems, many heuristic algorithms are very popular in the public transport sector. We can mention the evolutionary algorithm, for example:
- The genetic algorithms that imitate the biological processes of reproduction and natural selection to solve for the ‘fittest’ solutions;
- The Ant Colony Optimiser (ACO) that is based on the behaviour of a group of real ants following their path from the nest to food source;
- The Bee Colony Optimization (BCO) that is an optimization algorithm based on the intelligent foraging behaviour of honeybee swarm which solves a hybrid complex optimization problem;
- The Particle Swarm Optimization (PSO) that is a stochastic optimization technique based on the movement and intelligence of swarms. In PSO, the concept of social interaction is used for solving a problem. It uses a number of particles (agents) that constitute a swarm moving around in the search space, looking for the best solution.
ACO, BCO, PCO are part of the so-called swarm intelligence systems. The intelligent computational analytics of these system are able to represent uncertainty, imprecision and vague concepts, hence these techniques are used for route optimization problems in the transport sector.
Once the objectives of the optimization problem are determined and the algorithm is chosen, one needs an environment where to execute the algorithm. Let’s see how SAP AI Core can accomplish this task.
How to run an optimization algorithm in SAP AI Core
First of all, let’s introduce this new service provided by SAP: AI Core is a runtime designed to develop and deploy custom and advanced AI solutions in the cloud using open-source frameworks. To this end, it integrates with the most popular tools for developing cloud native AI solutions, like GitHub, Docker and the hyperscaler object stores. Recently we as BTP Solution Architects have delivered a nice openSAP course on this topic that you can refer to in case you are interested in understanding the capabilities and possible usages of AI Core.
Usually, an AI model needs a training phase and a deployment phase, something AI Core is designed for. Anyway, AI Core is also suitable for running batch executions, what we need for a complex algorithm like the ones mentioned above for the public transport sector. Let’s see how to do it with the help of Fig. 18.
Figure 18: Steps for running an optimization algorithm in SAP AI Core.
Everything starts with the code that includes the chosen algorithm. AI Core is agnostic from the point of view of the programming language because any code is run in the form of Docker containers. So once you have prepared your code you need to dockerize it and load the Docker image into a Docker repository so that it is available for consumption in the cloud.
Then you need to prepare your input dataset and load it in a cloud storage element. When working with AI Core there is the possibility to read data from any hyperscaler object store or from the HANA Data Lake. Recently SAP added the possibility to use data lake files, and indeed this is what we are considering in our solution.
In our use case we acquired data from a number of sources. Probably this data is not enough to optimize all the quantities we mentioned in the previous section, but they are already enough to perform for example an optimization of some lines of the London bus service in terms of total travel time. So let’s imagine our input dataset is made of the current timetable of line 155 (representing the current configuration of the line), the current road disruptions and the current bus total travel time and bus average speeds that quantify the current performance of the line.
At this point a so-called workflow template is needed. It is a YAML declarative configuration file (based on the Argo Workflow Engine prescriptions) that is used to instruct AI Core about the containers to run and how, about the datasets to use and where to save the output of the execution, about the computing resources to allocate for the execution. The file is hosted by GitHub and AI Core reads time by time the content of this files and aligns its configuration.
Once all these ingredients are ready, AI Core is ready as well to start the execution of the algorithm and, if some metrics have been defined in the code, then one can also follow the execution in SAP AI Launchpad that plays the role of graphical client for AI Core. At the end of the execution, AI Core writes the output into the chosen storage element. In our case it would be the HANA Data Lake, and the output would be the optimized timetable for line 155.
Visualizing insights from data and AI for the London bus service
In every end-to-end solution visualization is crucial to consume data, get insights and support decision making. In our use case the data we acquired and we prepared can be used already to build several types of dashboards targeting different personas as we have seen in the solution description. In particular a monitoring dashboard for the bus service in the city of London and a simple anomaly detection tool can be immediately developed on top of this data. The front-end part of the solution could be also designed in order to properly consume the outcomes of the AI algorithms (let's think about Twitter).
There are many possibilities for developing the front-end of a solution like the one we propose, anyway we are considering as first option SAP Analytics Cloud, the most user-friendly one that allows already to create appealing and interactive dashboards without requiring extensive technical expertise.
SAP Analytics Cloud in a nutshell
SAP Analytics Cloud (SAC) is a Software as a Service Cloud solution and it covers three types of analytics area: Business Intelligence, Augmented Analytics and Enterprise Planning in a single solution.
SAC offers a user-friendly interface that also allows users to easily create, customize, and interact with enterprise reports. It allows to create highly interactive dashboards with Linked Analysis, Ranking and Sorting, Filtering and Drill Functionality.
It provides extensive visualization library, geo maps powered by ESRI and custom R visualizations. Moreover, it allows also to define custom calculations, calculated dimensions, and aggregations.

Figure 19: SAP Analytics Cloud capabilities.
Relevant aspects of the development of SAC stories for the urban public transport use case
Since for this use case we are not prototyping the AI part, we will see in the following short video how to use SAC to develop the forementioned monitoring dashboards for the London bus service by consuming the analytics models we have prepared in Datasphere.
Conclusions
In this journey we had the chance to understand the complexity and importance of the urban public transport for our cities, society, and environment. Moreover, we understood how big data and AI can be used to improve the planning, designing and operations of a public transport network.
In this scenario we have learnt how SAP BTP can be used to build an end-to-end solution powered by AI to solve the key problems of the public transport industry and achieve a high-performance service.
As mentioned in the introduction to this series of sessions about real-life use cases, our goal was to provide some content that could inspire you. In fact, what is presented and prototyped (which will also be provided in the form of a GitHub repository) is meant to be reusable, not only in the public transport industry, but in all those complex scenarios that can only be managed by combining data and AI into a synergistic relationship.
Useful links
Below we prepared for you a collection of useful links related to the topics we covered in our use case.
Public transport and its data sources
- UK Government Bus Open Data Service
- GTFS Overview
- The hitchhiker’s guide to GTFS with python
- A python client for UK BODS
- How To Get Data from Google Maps Places API
- Transport for London APIs
- TomTom Traffic Index
- APTA Public Transportation Fact Book
- Review of Transit Data Sources: Potentials, Challenges and Complementarity
Social Media
- Twitter tutorials
- Twitter tutorial about filtered stream
- Twitter API
- Utilizing Social Media in Transport Planning and Public Transit Quality: Survey of Literature
- Sentiment Analysis on Twitter Data using SAP Data Intelligence
SAP Datasphere and HANA Cloud
- SAP HANA Cloud Allow/Deny IP-Address incoming connections
- Making a Direct Connection to a HANA Data Lake with Python from a Windows Laptop
- SAP Datasphere: Overview and Architecture
- Connect to Data Lake Relational Engine Using the ODBC Driver
- Use Clients to Query a Data Lake Relational Engine
- HANA_ML dataframe documentation
- Create a Geo-Coordinates Column
SAP Data Intelligence
- SAP Data Intelligence Cloud Help Page
- Connect SAP Data Intelligence Cloud to SAP Datasphere
- Connect SAP Data Intelligence Cloud to SAP HANA Cloud
- SAP Data Intelligence Operators
- Supported Connections in SAP Data Intelligence
- The operator for inserting data into a HDL database crashes: https://me.sap.com/notes/0003111520
- Load data into SAP HANA Cloud using SAP Data Intelligence
SAP Digital Vehicle Hub
- SAP Digital Vehicle Hub Data Model
- SAP Digital Vehicle Hub
- SAP Digital Vehicle Hub API to create or update vehicles
SAP Analytics Cloud
- SAP Community – SAP Analytics Cloud
- Deep integration of SAP Analytics Cloud and ArcGIS
- Learn How to Use Geo Maps in SAP Analytics Cloud in 25 Minutes
AI and Optimization
- Applications of Artificial Intelligence in Transport: An Overview
- Optimization of Public Transport Services to Minimize Passengers’ Waiting Times and Maximize Vehicle...
- Analysis and Optimization of Urban Public Transport Lines Based on Multiobjective Adaptive Particle ...
- Optimization of Bus Stops Locations Using GIS Techniques and Artificial Intelligence
- Sci-kit optimization library for Python
- Ant colony optimization algorithms
- Particle swarm optimization
SAP AI Core and AI Launchpad
Labels:
2 Comments
You must be a registered user to add a comment. If you've already registered, sign in. Otherwise, register and sign in.
Labels in this area
-
ABAP CDS Views - CDC (Change Data Capture)
2 -
AI
1 -
Analyze Workload Data
1 -
BTP
1 -
Business and IT Integration
2 -
Business application stu
1 -
Business Technology Platform
1 -
Business Trends
1,658 -
Business Trends
93 -
CAP
1 -
cf
1 -
Cloud Foundry
1 -
Confluent
1 -
Customer COE Basics and Fundamentals
1 -
Customer COE Latest and Greatest
3 -
Customer Data Browser app
1 -
Data Analysis Tool
1 -
data migration
1 -
data transfer
1 -
Datasphere
2 -
Event Information
1,400 -
Event Information
67 -
Expert
1 -
Expert Insights
177 -
Expert Insights
301 -
General
1 -
Google cloud
1 -
Google Next'24
1 -
GraphQL
1 -
Kafka
1 -
Life at SAP
780 -
Life at SAP
13 -
Migrate your Data App
1 -
MTA
1 -
Network Performance Analysis
1 -
NodeJS
1 -
PDF
1 -
POC
1 -
Product Updates
4,577 -
Product Updates
346 -
Replication Flow
1 -
REST API
1 -
RisewithSAP
1 -
SAP BTP
1 -
SAP BTP Cloud Foundry
1 -
SAP Cloud ALM
1 -
SAP Cloud Application Programming Model
1 -
SAP Datasphere
2 -
SAP S4HANA Cloud
1 -
SAP S4HANA Migration Cockpit
1 -
Technology Updates
6,873 -
Technology Updates
430 -
Workload Fluctuations
1
Related Content
- Recommended approach for Fiori Adapt UI in S/4H On-Premise system (Customizing client) with no data in Technology Q&A
- Mistral gagnant. Mistral AI and SAP Kyma serverless. in Technology Blogs by SAP
- Unify your process and task mining insights: How SAP UEM by Knoa integrates with SAP Signavio in Technology Blogs by SAP
- Deep dive into Q4 2023, What’s New in SAP Cloud ALM for Implementation Blog Series in Technology Blogs by SAP
- Cloud BADI Implementation via Developer Extensibility in Technology Blogs by SAP
Top kudoed authors
| User | Count |
|---|---|
| 26 | |
| 18 | |
| 15 | |
| 13 | |
| 11 | |
| 9 | |
| 8 | |
| 8 | |
| 8 | |
| 7 |