


- SAP Community
- Products and Technology
- CRM and Customer Experience
- CRM and CX Blogs by SAP
- Managing Performance in an SAP Commerce Cloud Proj...
CRM and CX Blogs by SAP
Stay up-to-date on the latest developments and product news about intelligent customer experience and CRM technologies through blog posts from SAP experts.
Turn on suggestions
Auto-suggest helps you quickly narrow down your search results by suggesting possible matches as you type.
Showing results for
Product and Topic Expert
Options
- Subscribe to RSS Feed
- Mark as New
- Mark as Read
- Bookmark
- Subscribe
- Printer Friendly Page
- Report Inappropriate Content
08-29-2023
11:58 AM
Overview
Managing Performance in an SAP Commerce Cloud Project
Learn how to incorporate recommended performance testing practices into your SAP Commerce Cloud project right from the start.
Start Early
Performance tends to be a topic that is left for the later stages of a project, however early design decisions can have a dramatic impact on your project. Typically many of these issues are only discovered as the go-live date approaches. As the User Acceptance Testing (UAT) phase starts, production or legacy data is loaded into the system and performance issues are discovered, or multiple interfaces collapse and bring the system to a halt when the system faces actual load.In this article we advocate that storefront performance testing should be performed regularly and as early as possible, so you can detect issues early, before they become problems.
We will describe a step by step process to help you design, implement and validate your performance tests, we will focus, specifically, on your storefront.


Define Performance Targets
The first step is to determine general performance targets for your application, these must be measurable and will generally consist of an estimation of the number of cores needed, a performance threshold per request (in milliseconds) and a maximum number of concurrent users your application can handle without central processing unit (CPU) saturation. These three metrics are interdependent, changing one will affect the others.A standard target is to try and ensure 95% of your requests are delivered in less than 200 milliseconds. It is important to remember that not all of you requests will be in this sub-200 millisecond range. The remaining 5% of the requests will consist of heavier operations, such as the checkout, or operations impacted by housekeeping activities or contention, such as Garbage Collection.
Anatomy of a Request To familiarize yourself with these numbers, think that, roughly speaking, if one page takes 200 milliseconds (ms) to render, you will be able to render 5 pages impressions (PI) in one second (1000ms / 200 ms/PI = 5 PI) using one core. This time includes all activities necessary to render the page, including pure CPU processing time, DB, Network, external interface calls and wait/sync times. In the example below, a request for a cached Product Category Page, the total Request time was 121 ms, which would translate to 8.26 PI/Second (1000ms /121 ms).   For this request, code execution (CPU time) took around 12 ms, a call to Solr 53.3 ms, network (input/output) IO 52.8 ms and a (database) DB call to retrieve a product 56 ms. For this request, code execution (CPU time) took around 12 ms, a call to Solr 53.3 ms, network (input/output) IO 52.8 ms and a (database) DB call to retrieve a product 56 ms.Some of the times are measured concurrently, which explains why the total time of 174.1 ms is bigger than the total response time.
|
Define User Journeys
The second step is to define the user journeys of your customers in your application, these will be translated into testable scenarios. These journeys represent the behavior of your users in your storefront, including the actions they perform, the wait (or think time) and the number of pages they visit during a session. Customers often do not come directly to a single product page and then check out immediately from there. A journey may consist of searching and opening various product pages, adding items to cart and then checking out. If you would like examples of how to define your user journeys you can find an example document here.You will need to provide values for your user journeys and their distributions. If you already have analytics provided by SAP Marketing Cloud, Google Analytics or a similar tool, then this data can be used. In a greenfield implementation, data from an existing system, enterprise resource planning (ERP) or similar back-end application can be used as a proxy, otherwise the marketing department of your company may help to provide forecasts based on offline sales data.
SAP Commerce Cloud provides sample jMeter test scripts for three standard business to consumer (B2C) journeys in the accelerator storefronts. These are generated in the resources/jmeter folder of your storefront's test folder, or they can be found in bin/ext-template/yacceleratorstest/resources/jmeter folder.
| Journey | Sample Distribution | Activities |
| Browser User Journey | 55% | The browser is looking for products or product related documentation to buy offline. He goes to the main page, looks for a store nearby, then visits a category page, a product detail page or performs a search. |
| Abandoned Cart User Journey | 45% | The abandoned cart user is looking for a product to buy, but is insecure about his purchasing decision, he browses the shop, adds a product to the cart, visits the cart page, modifies the cart and then leaves the shop without performing the checkout step. |
| Checkout User Journey | 5% | The checkout user goes to the shop with the intention of purchasing one item. After adding it to the cart, he decides to change the quantity and then performs the complete checkout step. |
Collect or Estimate Volumetric Information
In order to build a meaningful test model, you will need as much information as possible on the amount of data your target system will contain once it goes live, and a forecast of at least the next two years after that, to make sure that the system will scale accordingly.Typical volumetric information includes the following:
| Item | Expected Current Year (Sample) |
| Total number of items in DB storage | 17 million (MM) |
| Number of enabled promotions | 45 |
| Number of registered users | 95K |
| Average number of searches per user | 3 |
| Average number of page visits per user | 9 |
| Maximum values of user journey - Number of carts - Number of order lines in an order | 1 3 |
Base (Sample)
| Metric | Current Year | Year + 1 | Year + 2 |
| Orders per Year | 200K | 250K | 300K |
| Orders per Month | 16.6K | 20.8K | 25K |
| Orders per Day | 548 | 684 | 822 |
| Orders Peak per Hour | 68 | 86 | 102 |
| Peak Page Impression / Sec | 32 | 40 | 43 |
Peak (Sample)
| Metric | Current Year | Year + 1 | Year + 2 |
| Orders per Day | 3K | 4K | 5K |
| Orders Peak per Hour | 300 | 350 | 405 |
| Peak Page Impression / Sec | 127 | 131 | 135 |
Page Impressions / second (also known as PI/s) bear a direct relationship to the average number of concurrent users .
PI/s vs Number of Concurrent Users
Total PI/s = (Avg. Number of concurrent users * Avg. Number of Requests x Session) / Avg. Session length (in seconds)
Validate Your Performance Targets
Once you have defined your targets, it's time to validate them with various types of performance tests. Using the test scripts developed based on your User Journeys and your Performance Metrics, you can now prepare a test instance with a full set of data (creating dummy records, if necessary) and execute a baseline test.There are different kinds of performance tests, with different purposes, so it is important that you get acquainted with them. Initially you will start with a capacity test of your base configuration, where you will progressively increase the amount of concurrent users until CPU saturation is observed.


When performing load tests on SAP Commerce Cloud there are a few things to consider:
- Warm-up phase: it's usually necessary to run a small warm up phase to fill caches and stabilize the system response times
- Liveliness probe: pay particular attention to the interaction between the maximum number of tomcat HTTP threads per node and the liveliness probe (fired every 2 seconds). Several long running requests (i.e. not paginated wish lists or recommendation services) can fail the probe repeatedly and trigger a re-start
- Transaction length: keep transactions as short as possible, given that the DB connection will be held for the entire duration and may lead to the DB Connection pool being depleted
- Stock levels: write groovy scripts to avoid blocking situations (low stock level, disabled users, etc.)
- Data quality/quantity: the data set should be rich and varied to avoid unrealistic caching
- Back-end systems: due to environment differences some systems might have to be mocked when they don't have the capacity to deal with high load
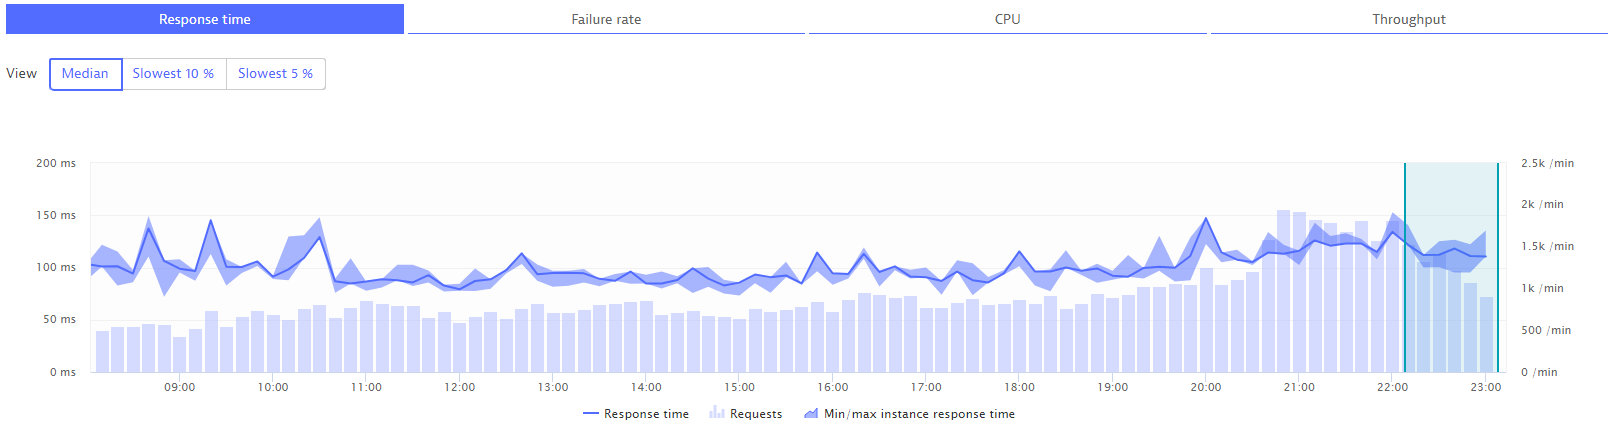
Examining the test results
In the example above 4 scenarios were tested, with saturation observed after testing with 800 concurrent users. This graph also shows the Volume of requests per Minute and the 95% response time threshold.So how did this test compare with our targets?
| Number of Users | Requests per Minute | Requests x Second (previous column dividedby 60) |
| 200 | 3200 | 53.3 |
| 400 | 5800 | 96.6 |
| 600 | 7800 | 130 |
Looking at the response time in detail and calculating PI/s from them, you have the following table.
| Response Time (ms) | Translates to PI/s x Core |
| 180-255 | 5,55 - 3,92 |
Perform Root cause Analysis and Fix Bottlenecks
After running the baseline capacity test, go through your requests and analyze those that do not comply with your target; in our example you would review all requests that took longer than 200 ms.Look at relative distributions of CPU, DB, Network and external service calls, and for calls that display high variance between different invocations. For each Page/Request Type locate the Hotspots and bottlenecks. Depending on your requirements the solutions can range between improving the code, lazy loading parts of your page or data model, adding caching, simplifying your page, improving hardware or scaling storefront nodes, but it is important to note that the ratio of throughput to response time does not necessarily scale linearly with more hardware, specially when external services or databases are involved.
Perform the process iteratively until your performance targets are reached, testing every change in isolation and keeping track of the delta change in response times.
Measure, Measure, Measure
Run your load testing cycle as part of your Continuous Integration process so that you can track the state of the application on a week by week basis. You will notice if performance suddenly decreased from one week to the next, of if the gap between min/max response times widens.Through continuous testing you will develop a feel for the system that will tell you where to focus your optimization efforts, and where the problematic areas can be found.

Get Acquainted with APM Tools
As part of your SAP Commerce Cloud in the Public Cloud subscription you will have access to Dynatrace, which will provide you with everything you need to monitor the performance of your project. Make sure that you know the tools as well as any potential limitations for your project. You can also watch this webinar, which provides an introduction to Dynatrace for SAP Commerce Cloud.Review Back-end Performance
Do not forget about the performance of other system components. Interfaces, cron jobs, data imports and synchronizations can have a direct or indirect impact on the performance of your application. These should be tested at the same time as your storefront performance tests are running to ensure there isn't excessive load being caused by back office tasks that will be running at the same time as your peak loads.Conclusion
It is important to pro-actively manage performance early on in your project to avoid surprises later on. Performance Testing should be incorporated into your Continuous Integration Pipeline from the beginning, and tests should be performed on a fully loaded and representative test instance.You should become familiar with the 3 main indicators of performance (response times, page impressions/second and maximum number of concurrent users), and track this indicators as your project evolves and post go-live.
If you're looking for expertise to ensure your solution can meet your performance needs, please contact SAP Expert Services.
- SAP Managed Tags:
- SAP Commerce,
- SAP Commerce Cloud,
- Customer Experience
Labels:
1 Comment
You must be a registered user to add a comment. If you've already registered, sign in. Otherwise, register and sign in.
Labels in this area
-
Business Trends
270 -
Business Trends
13 -
chitchat
1 -
customerexperience
1 -
Event Information
256 -
Event Information
20 -
Expert Insights
30 -
Expert Insights
56 -
Life at SAP
133 -
Life at SAP
1 -
Product Updates
666 -
Product Updates
34 -
SAP HANA Service
1 -
SAPHANACloud
1 -
SAPHANAService
1 -
Technology Updates
453 -
Technology Updates
16
Related Content
- Power of E-commerce Subscription Models in Increasing Conversions and Boosting Average Order Value in CRM and CX Blogs by SAP
- SAP Commerce Best Practices for Performance in CRM and CX Blogs by SAP
- SAP Commerce Cloud Q1 ‘24 Release Highlights in CRM and CX Blogs by SAP
- Unlock the Power of AI with Intelligent Selling Services for SAP Commerce Cloud in CRM and CX Blogs by SAP
- How to create specific entity region cache in SAP Commerce in CRM and CX Blogs by SAP
Top kudoed authors
| User | Count |
|---|---|
| 10 | |
| 2 | |
| 2 | |
| 1 | |
| 1 | |
| 1 | |
| 1 | |
| 1 | |
| 1 | |
| 1 |