
- SAP Community
- Products and Technology
- Technology
- Technology Blogs by SAP
- What’s New in SAP Analytics Cloud and SAP Digital ...
Technology Blogs by SAP
Learn how to extend and personalize SAP applications. Follow the SAP technology blog for insights into SAP BTP, ABAP, SAP Analytics Cloud, SAP HANA, and more.
Turn on suggestions
Auto-suggest helps you quickly narrow down your search results by suggesting possible matches as you type.
Showing results for
Former Member
Options
- Subscribe to RSS Feed
- Mark as New
- Mark as Read
- Bookmark
- Subscribe
- Printer Friendly Page
- Report Inappropriate Content
10-03-2017
2:17 AM
This blog covers some of the latest new features and enhancements in SAP Analytics Cloud* and SAP Digital Boardroom release 2017.19. Please note that the Analytics Cloud Help documentation is updated at the same time as the upgrade to this release, so the links here may not yet reflect what is described below until after the upgrade is complete.
With the 2017.19.0 release of SAP Analytics Cloud, SAP Analytics Cloud agent's minimum version remains at 1.0.75, with the following exceptions:
For more information, see System Requirements and Technical Prerequisites.
Highlights of this release:
Learn with our latest video tutorials
How to get Support for SAP Analytics Cloud
Support with SAP Analytics Cloud has evolved over the past year. Whether you have a ‘how-to’ question, want to report a bug, or have an idea on how we can improve the product, there are now a few new ways you can get support.
Users with the SAP Analytics Cloud for business intelligence license can now view data from planning models in stories, create private versions of the data, and temporarily adjust planned or forecast values to simulate different business scenarios.

Our new and improved Digital Boardroom area is now out of Beta and available to help you to easily create new agenda and dashboard presentations. With this release, you will no longer be able to create new agendas from the old Boardroom Agendas area. Here’s a recap of all the goodies we’ve packed into the new area:

Drag-and-drop: Using the drag-and-drop interface, you can now add pages or entire stories to a topic. Topics act as page containers and make it easy for you to group and structure of your dashboard. You can also rearrange pages using drag-and-drop or press the delete button to remove a page from a topic.

Reuse: You can reuse dashboards by importing them into your presentation, with the option to include the entire Digital Boardroom or select individual topics. Don’t forget to check the Live link option if you want to automatically update when changes are made to the original dashboard.

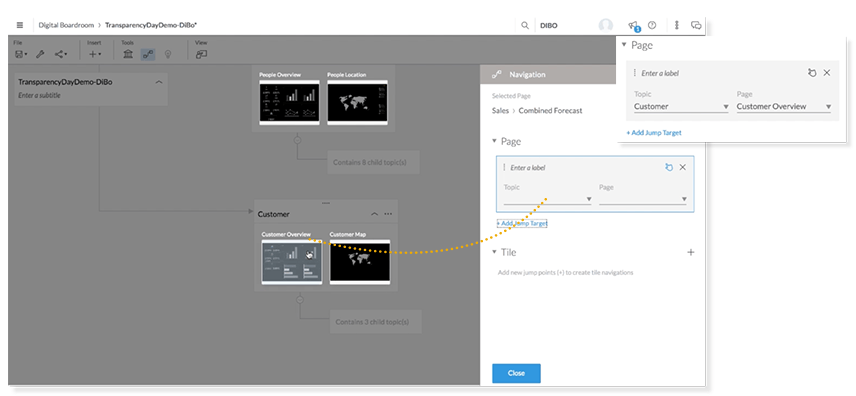
Links/page jumping: Link pages dynamically in dashboards to enable jumping from a certain page or tile to another page. For example, you could have a combined sales forecast across all industries and regions, and jump whenever needed during your presentation to show the sales forecast split up by customers on a separate page.
Search: You can now also find specific topics within your canvas using the search located on the right side of the toolbar. Your target topic will be centered on the canvas and highlighted with a blue glow.

Customized action bar: You can now customize the action bar in the Digital Boardroom settings by dragging and dropping functions onto the action bar. Some of the settings require a specific configuration to work properly, such as the RSS feed.

Formulas can be made input-enabled by defining inverse formulas in the model. The inverse formulas define how to change the operands of a formula depending on the changed formula value.

When creating an allocation step, you can now set time as the source or target dimension for the step.

R comes with advanced abilities for presenting data in visually attractive and interactive ways. In this release, R visualizations can now be displayed as interactive HTML content. For R scripts with interactivity, we increased the navigation options for visualizations and provided support for the full range of R packages integrated with SAP Analytics Cloud.


The preferred language that you set in the profile settings is now used as the default connection language when retrieving strings from a live data connection. Text strings will be displayed in your preferred language if the translations are available from the remote data source. You can also choose a specific connection language for cases where only one language can be found on the remote data source.

When importing data from SAP BW, the prompt selection UI is unified with other data sources.

On a responsive page, you can now add lanes above or below other lanes. Using the drag-and-drop interface, you can reorder the lanes on pages without having to swap all the widgets individually.

You can now use a dimension input control to drive your visualizations (i.e. charts, tables, geo tooltip charts, etc.). In addition, the dimension input control will remember the dimension’s drill level even when you switch from one dimension to another.

You can now choose your own set of measures (i.e. calculations and measure input control, etc.) to create a single-level waterfall chart where the first and last measures represent a total. You can also set a data point as a total when a non-PCH (non-parent child hierarchy) dimension is in the visualization.

You can now create a blended visualization without having to explicitly include the linked dimensions in the chart or table (an “out of context” blended visualization). Also, you will be notified by a warning message if the blending results in duplicate members.

When adding an unlinked dimension to a blended chart, you can now choose whether to use a union or a join for the data.

You can now create an IF calculation without a corresponding ELSE statement. Currently, we support two following formats:
For your convenience, we’ve added a formula explanation dialog in the modeler to help you with the formula syntax and use case.

The base maps used to create geo maps now show the length scales to indicate the distance in kilometers and miles. However, you can also disable the length scale via the Show/Hide option in the geo quick action menu.

*SAP Analytics Cloud was previously known as SAP BusinessObjects Cloud
**Legal disclaimer
SAP has no obligation to pursue any course of business outlined in this blog or any related presentation, or to develop or release any functionality mentioned therein. This blog, or any related presentation and SAP’s possible future developments, products and or platforms directions and functionality are all subject to change and may be changed by SAP at any time for any reason without notice. The information in this blog is not a commitment, promise or legal obligation to deliver any material, code, or functionality. This blog is provided without a warranty of any kind, either express or implied, including but not limited to, the implied warranties of merchantability, fitness for a particular purpose, or non-infringement. This blog is for informational purposes and may not be incorporated into a contract. SAP assumes no responsibility for errors or omissions in this document, except if such damages were caused by SAP’s willful misconduct or gross negligence.
All forward-looking statements are subject to various risks and uncertainties that could cause actual results to differ materially from expectations. Readers are cautioned not to place undue reliance on these forward-looking statements, and should not be relied upon in making purchasing decisions.
With the 2017.19.0 release of SAP Analytics Cloud, SAP Analytics Cloud agent's minimum version remains at 1.0.75, with the following exceptions:
- If you require data acquisition from SAP BW, you must upgrade to version 1.0.77
For more information, see System Requirements and Technical Prerequisites.
Highlights of this release:
- BI license can now view data from planning models in stories
- Use the new Digital Boardroom area to create Agenda or Dashboard presentations
- Inverse formulas
- Allocations: Set time as the source or target dimension
- Display R visualizations as interactive HTML content
- Specify language for live data connections
- Improved prompt selection process for data import from SAP BW
- Add lanes and reorder lane positions on responsive pages
- Drive visualizations with dimension input control
- Create a single-level waterfall chart using arbitrary measures
- Blend visualizations without explicitly showing linked dimensions
- Separate vs Merge members
- Create an IF calculation without an ELSE statement
- Base map indicates scale in geo visualizations
Learn with our latest video tutorials
- Spread, distribute, and assign values in stories
- Apply formatting to objects in a story using styling mode
- Apply a layout to a story
- Full tutorial playlist >
How to get Support for SAP Analytics Cloud
Support with SAP Analytics Cloud has evolved over the past year. Whether you have a ‘how-to’ question, want to report a bug, or have an idea on how we can improve the product, there are now a few new ways you can get support.
License Update
BI license can now view data from planning models in stories
Users with the SAP Analytics Cloud for business intelligence license can now view data from planning models in stories, create private versions of the data, and temporarily adjust planned or forecast values to simulate different business scenarios.
- Other planning features, such as publishing versions and carrying out allocations, remain restricted to users with SAP Analytics Cloud for planning licenses.
SAP Digital Boardroom
Use the new Digital Boardroom area to create Agenda or Dashboard presentations
Our new and improved Digital Boardroom area is now out of Beta and available to help you to easily create new agenda and dashboard presentations. With this release, you will no longer be able to create new agendas from the old Boardroom Agendas area. Here’s a recap of all the goodies we’ve packed into the new area:
Drag-and-drop: Using the drag-and-drop interface, you can now add pages or entire stories to a topic. Topics act as page containers and make it easy for you to group and structure of your dashboard. You can also rearrange pages using drag-and-drop or press the delete button to remove a page from a topic.
Reuse: You can reuse dashboards by importing them into your presentation, with the option to include the entire Digital Boardroom or select individual topics. Don’t forget to check the Live link option if you want to automatically update when changes are made to the original dashboard.
Links/page jumping: Link pages dynamically in dashboards to enable jumping from a certain page or tile to another page. For example, you could have a combined sales forecast across all industries and regions, and jump whenever needed during your presentation to show the sales forecast split up by customers on a separate page.
Search: You can now also find specific topics within your canvas using the search located on the right side of the toolbar. Your target topic will be centered on the canvas and highlighted with a blue glow.
Customized action bar: You can now customize the action bar in the Digital Boardroom settings by dragging and dropping functions onto the action bar. Some of the settings require a specific configuration to work properly, such as the RSS feed.
- Learn more about the Digital Boardroom.
Planning
Inverse formulas
Formulas can be made input-enabled by defining inverse formulas in the model. The inverse formulas define how to change the operands of a formula depending on the changed formula value.
- Learn more about formulas in modeler.
Allocations: Set time as the source or target dimension
When creating an allocation step, you can now set time as the source or target dimension for the step.
- Learn how to create an allocation step.
- Learn more about allocation processes, steps, and rules.
Predictive
Display R visualizations as interactive HTML content
R comes with advanced abilities for presenting data in visually attractive and interactive ways. In this release, R visualizations can now be displayed as interactive HTML content. For R scripts with interactivity, we increased the navigation options for visualizations and provided support for the full range of R packages integrated with SAP Analytics Cloud.
- Learn how to use R in SAP Analytics Cloud.
- Learn how to add R visualizations to stories.
- Learn how to add an R visualization to a story (video tutorial).
Infrastructure
Specify language for live data connections
The preferred language that you set in the profile settings is now used as the default connection language when retrieving strings from a live data connection. Text strings will be displayed in your preferred language if the translations are available from the remote data source. You can also choose a specific connection language for cases where only one language can be found on the remote data source.
Data Integration
Improved prompt selection process for data import from SAP BW
When importing data from SAP BW, the prompt selection UI is unified with other data sources.
Data Analysis, Stories, and Tables
Add lanes and reorder lane positions on responsive pages
On a responsive page, you can now add lanes above or below other lanes. Using the drag-and-drop interface, you can reorder the lanes on pages without having to swap all the widgets individually.
- Learn more about responsive lanes.
Drive visualizations with dimension input control
You can now use a dimension input control to drive your visualizations (i.e. charts, tables, geo tooltip charts, etc.). In addition, the dimension input control will remember the dimension’s drill level even when you switch from one dimension to another.
Create a single-level waterfall chart using arbitrary measures
You can now choose your own set of measures (i.e. calculations and measure input control, etc.) to create a single-level waterfall chart where the first and last measures represent a total. You can also set a data point as a total when a non-PCH (non-parent child hierarchy) dimension is in the visualization.
Blend visualizations without explicitly showing linked dimensions
You can now create a blended visualization without having to explicitly include the linked dimensions in the chart or table (an “out of context” blended visualization). Also, you will be notified by a warning message if the blending results in duplicate members.
Separate vs merge members
When adding an unlinked dimension to a blended chart, you can now choose whether to use a union or a join for the data.
Create an IF calculation without an ELSE statement
You can now create an IF calculation without a corresponding ELSE statement. Currently, we support two following formats:
- IF (Condition, True, False)
- IF (Condition, True)
For your convenience, we’ve added a formula explanation dialog in the modeler to help you with the formula syntax and use case.
Base map indicates scale in geo visualizations
The base maps used to create geo maps now show the length scales to indicate the distance in kilometers and miles. However, you can also disable the length scale via the Show/Hide option in the geo quick action menu.
Additional resources:
- Video tutorials
- Guided learning
- Events and recordings
- SAP Analytics Cloud help resources
- Official roadmap contains more info on future plans, subject to change.
Previous feature summary blogs:
- SAP Analytics Cloud release 2017.18
- SAP Analytics Cloud release 2017.17
- SAP Analytics Cloud release 2017.16
- More >
*SAP Analytics Cloud was previously known as SAP BusinessObjects Cloud
**Legal disclaimer
SAP has no obligation to pursue any course of business outlined in this blog or any related presentation, or to develop or release any functionality mentioned therein. This blog, or any related presentation and SAP’s possible future developments, products and or platforms directions and functionality are all subject to change and may be changed by SAP at any time for any reason without notice. The information in this blog is not a commitment, promise or legal obligation to deliver any material, code, or functionality. This blog is provided without a warranty of any kind, either express or implied, including but not limited to, the implied warranties of merchantability, fitness for a particular purpose, or non-infringement. This blog is for informational purposes and may not be incorporated into a contract. SAP assumes no responsibility for errors or omissions in this document, except if such damages were caused by SAP’s willful misconduct or gross negligence.
All forward-looking statements are subject to various risks and uncertainties that could cause actual results to differ materially from expectations. Readers are cautioned not to place undue reliance on these forward-looking statements, and should not be relied upon in making purchasing decisions.
- SAP Managed Tags:
- SAP Analytics Cloud
2 Comments
You must be a registered user to add a comment. If you've already registered, sign in. Otherwise, register and sign in.
Labels in this area
-
ABAP CDS Views - CDC (Change Data Capture)
2 -
AI
1 -
Analyze Workload Data
1 -
BTP
1 -
Business and IT Integration
2 -
Business application stu
1 -
Business Technology Platform
1 -
Business Trends
1,658 -
Business Trends
109 -
CAP
1 -
cf
1 -
Cloud Foundry
1 -
Confluent
1 -
Customer COE Basics and Fundamentals
1 -
Customer COE Latest and Greatest
3 -
Customer Data Browser app
1 -
Data Analysis Tool
1 -
data migration
1 -
data transfer
1 -
Datasphere
2 -
Event Information
1,400 -
Event Information
74 -
Expert
1 -
Expert Insights
177 -
Expert Insights
346 -
General
1 -
Google cloud
1 -
Google Next'24
1 -
GraphQL
1 -
Kafka
1 -
Life at SAP
780 -
Life at SAP
14 -
Migrate your Data App
1 -
MTA
1 -
Network Performance Analysis
1 -
NodeJS
1 -
PDF
1 -
POC
1 -
Product Updates
4,575 -
Product Updates
388 -
Replication Flow
1 -
REST API
1 -
RisewithSAP
1 -
SAP BTP
1 -
SAP BTP Cloud Foundry
1 -
SAP Cloud ALM
1 -
SAP Cloud Application Programming Model
1 -
SAP Datasphere
2 -
SAP S4HANA Cloud
1 -
SAP S4HANA Migration Cockpit
1 -
Technology Updates
6,871 -
Technology Updates
479 -
Workload Fluctuations
1
Related Content
- First steps to work with SAP Cloud ALM Deployment scenario for SAP ABAP systems (7.40 or higher) in Technology Blogs by SAP
- SAP Cloud ALM: Requirements Management on Steroids in Technology Blogs by SAP
- SAP BTP FAQs - Part 1 (General Topics in SAP BTP) in Technology Blogs by SAP
- What’s New in SAP Analytics Cloud Q2 2024 in Technology Blogs by SAP
- DevOps with SAP BTP in Technology Blogs by SAP
Top kudoed authors
| User | Count |
|---|---|
| 17 | |
| 15 | |
| 11 | |
| 11 | |
| 9 | |
| 8 | |
| 8 | |
| 7 | |
| 7 | |
| 7 |