

- SAP Community
- Products and Technology
- Technology
- Technology Blogs by SAP
- What’s New in SAP Analytics Cloud and SAP Digital ...
Technology Blogs by SAP
Learn how to extend and personalize SAP applications. Follow the SAP technology blog for insights into SAP BTP, ABAP, SAP Analytics Cloud, SAP HANA, and more.
Turn on suggestions
Auto-suggest helps you quickly narrow down your search results by suggesting possible matches as you type.
Showing results for
Former Member
Options
- Subscribe to RSS Feed
- Mark as New
- Mark as Read
- Bookmark
- Subscribe
- Printer Friendly Page
- Report Inappropriate Content
09-18-2017
11:53 PM
This blog covers some of the latest new features and enhancements in SAP Analytics Cloud* and SAP Digital Boardroom release 2017.18. Please note that the Analytics Cloud Help documentation is updated at the same time as the upgrade to this release, so the links here may not yet reflect what is described below until after the upgrade is complete.
SAP Analytics Cloud agent version required for data acquisition with this release:
For more information, see System Requirements and Technical Prerequisites.
Highlights of this release:
Learn with our latest video tutorials:
Meet your SAP Analytics Cloud product coach: We are proud to present a new video series, ‘Getting Started’. These tutorials will help new users get started quickly in SAP Analytics Cloud.
Other video tutorials:
You now have more control over the look and feel of your table. When creating a formatting rule for a table, you can now base the rule on one or more members that you choose, and you can specify whether the formatting style applies to the table’s header cells as well as the data values.
Filter ranges with week and day can now be modified in the SAP Analytics Cloud mobile app.

The SAP Analytics Cloud mobile app now supports iOS 11.
Google Drive is a handy place to store your data. Beginning with this release, you no longer need to contact our team at SAP when you want to create a connection to your Google Drive accounts. To simplify things for you, you can now directly connect to Google Drive from SAP Analytics Cloud.
We want to make data import as simple as possible for you. Now when you import data from Google Drive (or SuccessFactors, Google BigQuery) into a new or existing model, the data acquisition will happen in the background while you work on something else.
When the data import is complete, you will be notified that the data was imported successfully. You can build your model then, or leave it for later. Please note that the imported data expires seven days after the import.

Previously when you are in the modeler, you could add dimension attributes that would be displayed in tables. Now in this release, we’ve extended this capability so that you can now use a dimension property within a story to create visualizations, including filters, calculations, input controls and linked analyses etc.

When creating a geo map, you can now filter the data in each layer by any dimension via the builder panel. For example, you can create filters to perform geospatial analysis in specific time periods, or for products.

Table tooltips are now available for thresholds in data cell and in-cell charts so you can quickly identify positions within the thresholds boundaries.

To help you meet IBCS standards, we’ve added the "Show Sign As" option for calculations in a table. You can now choose to show the numbers as positive or negative in the following ways:

*SAP Analytics Cloud was previously known as SAP BusinessObjects Cloud
**Legal disclaimer
SAP has no obligation to pursue any course of business outlined in this blog or any related presentation, or to develop or release any functionality mentioned therein. This blog, or any related presentation and SAP’s possible future developments, products and or platforms directions and functionality are all subject to change and may be changed by SAP at any time for any reason without notice. The information in this blog is not a commitment, promise or legal obligation to deliver any material, code, or functionality. This blog is provided without a warranty of any kind, either express or implied, including but not limited to, the implied warranties of merchantability, fitness for a particular purpose, or non-infringement. This blog is for informational purposes and may not be incorporated into a contract. SAP assumes no responsibility for errors or omissions in this document, except if such damages were caused by SAP’s willful misconduct or gross negligence.
All forward-looking statements are subject to various risks and uncertainties that could cause actual results to differ materially from expectations. Readers are cautioned not to place undue reliance on these forward-looking statements, and should not be relied upon in making purchasing decisions.
SAP Analytics Cloud agent version required for data acquisition with this release:
- Note: With the 2017.18.0 release of SAP Analytics Cloud, SAP Analytics Cloud agent must be updated to version 1.0.75 for all data-acquisition types.
For more information, see System Requirements and Technical Prerequisites.
Highlights of this release:
- Formatting rules for member cells
- Support for week and day modifications in filters
- Support for iOS 11
- Automatically create Google Drive connections
- Asynchronous data acquisition for Google Drive
- Use dimension attributes to create visualizations
- Dimension filter support for geo visualizations
- Table tooltip for thresholds in data cells and in-cell charts
- Number formatting: Option to show +/– signs
Learn with our latest video tutorials:
Meet your SAP Analytics Cloud product coach: We are proud to present a new video series, ‘Getting Started’. These tutorials will help new users get started quickly in SAP Analytics Cloud.

Other video tutorials:
- Create an input task
- Work with grid pages and tables
- Create a connection and import a model from SuccessFactors
- Full tutorial playlist >
Planning
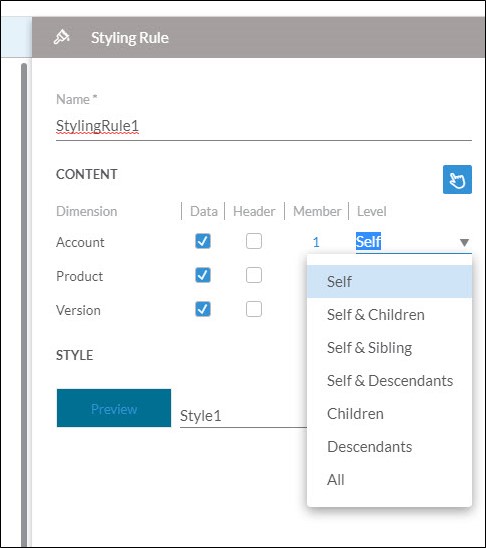
Formatting rules for member cells
You now have more control over the look and feel of your table. When creating a formatting rule for a table, you can now base the rule on one or more members that you choose, and you can specify whether the formatting style applies to the table’s header cells as well as the data values.
- Learn how to apply formatting to tables (tutorial video)
Mobile
Support for week and day modifications in filters
Filter ranges with week and day can now be modified in the SAP Analytics Cloud mobile app.
Support for iOS 11
The SAP Analytics Cloud mobile app now supports iOS 11.
Data Integration
Automatically create Google Drive connections
Google Drive is a handy place to store your data. Beginning with this release, you no longer need to contact our team at SAP when you want to create a connection to your Google Drive accounts. To simplify things for you, you can now directly connect to Google Drive from SAP Analytics Cloud.
Asynchronous data acquisition for Google Drive
We want to make data import as simple as possible for you. Now when you import data from Google Drive (or SuccessFactors, Google BigQuery) into a new or existing model, the data acquisition will happen in the background while you work on something else.
When the data import is complete, you will be notified that the data was imported successfully. You can build your model then, or leave it for later. Please note that the imported data expires seven days after the import.
- Learn how to import Google Drive data to a new or existing model (tutorial video)
- Learn how to create a model or story using data from Google Drive (tutorial video)
Data Analysis, Stories, and Tables
Use dimension attributes to create visualizations
Previously when you are in the modeler, you could add dimension attributes that would be displayed in tables. Now in this release, we’ve extended this capability so that you can now use a dimension property within a story to create visualizations, including filters, calculations, input controls and linked analyses etc.
- Please note that dimension properties are hidden in Explorer.
- Unbooked data planning is disabled.
Dimension filter support for geo visualizations
When creating a geo map, you can now filter the data in each layer by any dimension via the builder panel. For example, you can create filters to perform geospatial analysis in specific time periods, or for products.
- Please note that parent-child hierarchy dimensions for remote HANA will disable bubble clustering.
Table tooltip for thresholds in data cells and in-cell charts
Table tooltips are now available for thresholds in data cell and in-cell charts so you can quickly identify positions within the thresholds boundaries.
Number formatting: Option to show +/– signs
To help you meet IBCS standards, we’ve added the "Show Sign As" option for calculations in a table. You can now choose to show the numbers as positive or negative in the following ways:
- Default
- Positive does not have a sign; Negative –
- +/-
- Positive +; Negative –
- ()
- Positive does not have a sign; Negative ()
Additional resources:
- Video tutorials
- Guided learning
- Events and recordings
- SAP Analytics Cloud help resources
- Official roadmap contains more info on future plans, subject to change.
Previous feature summary blogs:
- SAP Analytics Cloud release 2017.17
- SAP Analytics Cloud release 2017.16
- SAP Analytics Cloud release 2017.15
- More >
*SAP Analytics Cloud was previously known as SAP BusinessObjects Cloud
**Legal disclaimer
SAP has no obligation to pursue any course of business outlined in this blog or any related presentation, or to develop or release any functionality mentioned therein. This blog, or any related presentation and SAP’s possible future developments, products and or platforms directions and functionality are all subject to change and may be changed by SAP at any time for any reason without notice. The information in this blog is not a commitment, promise or legal obligation to deliver any material, code, or functionality. This blog is provided without a warranty of any kind, either express or implied, including but not limited to, the implied warranties of merchantability, fitness for a particular purpose, or non-infringement. This blog is for informational purposes and may not be incorporated into a contract. SAP assumes no responsibility for errors or omissions in this document, except if such damages were caused by SAP’s willful misconduct or gross negligence.
All forward-looking statements are subject to various risks and uncertainties that could cause actual results to differ materially from expectations. Readers are cautioned not to place undue reliance on these forward-looking statements, and should not be relied upon in making purchasing decisions.
- SAP Managed Tags:
- SAP Analytics Cloud
3 Comments
You must be a registered user to add a comment. If you've already registered, sign in. Otherwise, register and sign in.
Labels in this area
-
ABAP CDS Views - CDC (Change Data Capture)
2 -
AI
1 -
Analyze Workload Data
1 -
BTP
1 -
Business and IT Integration
2 -
Business application stu
1 -
Business Technology Platform
1 -
Business Trends
1,658 -
Business Trends
91 -
CAP
1 -
cf
1 -
Cloud Foundry
1 -
Confluent
1 -
Customer COE Basics and Fundamentals
1 -
Customer COE Latest and Greatest
3 -
Customer Data Browser app
1 -
Data Analysis Tool
1 -
data migration
1 -
data transfer
1 -
Datasphere
2 -
Event Information
1,400 -
Event Information
66 -
Expert
1 -
Expert Insights
177 -
Expert Insights
293 -
General
1 -
Google cloud
1 -
Google Next'24
1 -
Kafka
1 -
Life at SAP
780 -
Life at SAP
13 -
Migrate your Data App
1 -
MTA
1 -
Network Performance Analysis
1 -
NodeJS
1 -
PDF
1 -
POC
1 -
Product Updates
4,577 -
Product Updates
340 -
Replication Flow
1 -
RisewithSAP
1 -
SAP BTP
1 -
SAP BTP Cloud Foundry
1 -
SAP Cloud ALM
1 -
SAP Cloud Application Programming Model
1 -
SAP Datasphere
2 -
SAP S4HANA Cloud
1 -
SAP S4HANA Migration Cockpit
1 -
Technology Updates
6,873 -
Technology Updates
419 -
Workload Fluctuations
1
Related Content
- 体验更丝滑!SAP 分析云 2024.07 版功能更新 in Technology Blogs by SAP
- Top Picks: Innovations Highlights from SAP Business Technology Platform (Q1/2024) in Technology Blogs by SAP
- What’s New in SAP Analytics Cloud Release 2024.08 in Technology Blogs by SAP
- Sneak Peek in to SAP Analytics Cloud release for Q2 2024 in Technology Blogs by SAP
- Deep dive into Q4 2023, What’s New in SAP Cloud ALM for Implementation Blog Series in Technology Blogs by SAP
Top kudoed authors
| User | Count |
|---|---|
| 35 | |
| 25 | |
| 13 | |
| 7 | |
| 7 | |
| 6 | |
| 6 | |
| 6 | |
| 5 | |
| 4 |