
- SAP Community
- Products and Technology
- Technology
- Technology Blogs by SAP
- What’s New in SAP Analytics Cloud and SAP Digital ...
Technology Blogs by SAP
Learn how to extend and personalize SAP applications. Follow the SAP technology blog for insights into SAP BTP, ABAP, SAP Analytics Cloud, SAP HANA, and more.
Turn on suggestions
Auto-suggest helps you quickly narrow down your search results by suggesting possible matches as you type.
Showing results for
former_member75
Participant
Options
- Subscribe to RSS Feed
- Mark as New
- Mark as Read
- Bookmark
- Subscribe
- Printer Friendly Page
- Report Inappropriate Content
09-16-2021
10:08 PM
This blog post covers some of the latest features and enhancements in SAP Analytics Cloud and SAP Digital Boardroom Release 2021.19, which will be included in the Q4 2021 Quarterly Release Cycle (QRC).
Please note that the SAP Analytics Cloud Help Portal is updated at the same time as the upgrade to this release, so the links here may not yet reflect what is described below until after the upgrade is complete.
Be sure to upgrade to the latest SAP Analytics Cloud agent version 1.0.333 to take advantage of all the data acquisition types. Here are the minimum data acquisition requirements:
SAP Analytics Cloud fully supports Microsoft Edge and Google Chrome for all activities and areas of viewing, authoring, and administration. For more information, check out the following System Requirements and Technical Prerequisites.
When working on tables with SAP BW live data connections, users can now format the ID and description of row members to short, medium, or long text through the context menu item "Display Options". This feature enhances the text/description of dimensions visually within tables that are available through Story, Analytical Application, and Data Analyzer in both edit and view mode. Note that the type and number of format options to be displayed in the sub menu depends on the back-end configuration and that these options are not enabled for UDH dimension.
Users can now use the styling panel in Data Analyzer to change the number formatting for specific measures at runtime including measure selection, scale format, display unit or currency, and decimal place.
Users can now remove client calculations without also removing the relevant anchored calculations in a table. This feature offers a more convenient table design that is less prone to errors.
Thresholds are now supported with cross calculations added to charts. Note that this feature is currently not available on the mobile app.
Optimized View Mode now supports the following features once a story is resaved:
For additional information on Optimized View Mode, check out the following resources:
Users can now define a recommended planning area on a planning model to optimize version size when editing public versions or creating private versions. The planning area is based on existing data access configurations such as Data Access Control and/or Data Locking. Furthermore, the version management panel and dialogs have been adjusted to indicate the scope of edit. This feature improves performance for planning processes especially with large versions.
Users can now add work files and multiple review rounds to their generated tasks and processes in the Calendar Wizard. This feature enables users to easily and quickly design larger planning processes along a driving dimension.
Application designers can now use the technical component "Calendar Integration" together with the following new APIs for the calendar task of type composite, general, or review:
This feature helps with testing if a status change API can be used while providing an overview on what calendar tasks are to be submitted, declined, approved, or rejected as well.
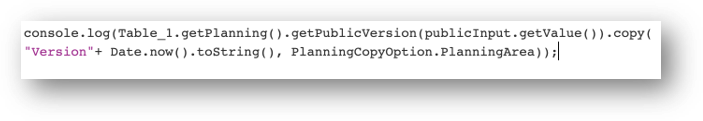
Application designers can now choose to copy data from a version to a Planning Area when using the copy() API. This feature enhances performance and mitigates errors for invalid operations regarding the Planning Area.
The new linked analysis diagram allows application designers to get a visual overview of all the links among widgets, after they create a linked analysis or a filter line in their analytic application. In addition, application designers can also modify the existing relationships for each widget directly here.
Content discovery is enhanced with the Catalog as iOS mobile app users are now able to:
iOS mobile app administrators can now push a configuration through the supported MDM tools to allow editing for the enforced default server URL to a new connection URL by using a Key/Value pair "isServerEditable=True".
Note that there is no auto-connect supported, on log-off MDM default URL is pre-filled, and the setting default server is not available. This feature allows administrators to make the tenant URL editable and connect to multiple tenants when the app is managed by an MDM with a default URL configured as well.
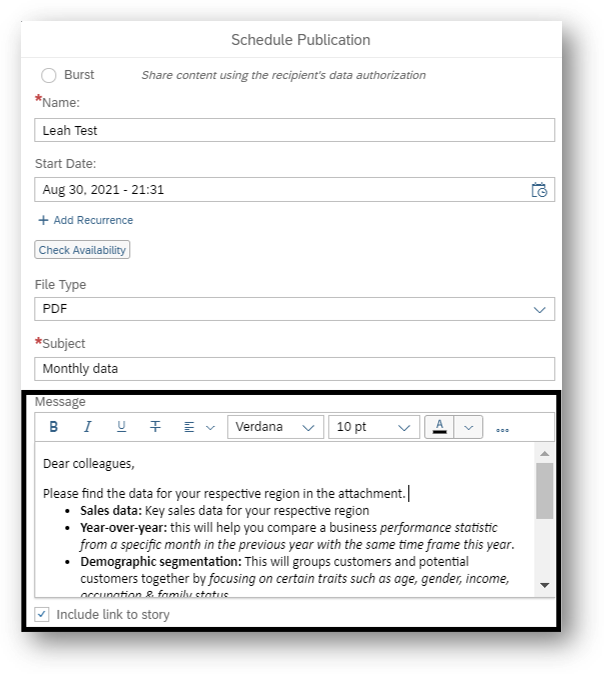
Schedulers can now format their messages in rich text and add links for further reference content when scheduling and sharing stories over email.
Content creators can now use all resource types that are available in the "My Files" area within content creation workflows from any workspace while subject to their access rights on the resources.
Catalog administrators can create custom tabs in addition to the "Overview" tab which are then available to content creators to surface additional metadata for content in the Catalog view. A rich text formatting editor has been introduced for content editing experience.
By default, the catalog sort and filter state will be remembered by the system for subsequent visits to the Catalog. The filter panel open/close state is remembered across sessions and is included in the URL with sort parameters.
In the filter panel, the count of the number of items is shown and the cascading filter behaviour dynamically hides irrelevant filter members. These features enhance the user experience by remembering user selections and improve the ability to get to search results quicker by showing relevant filters.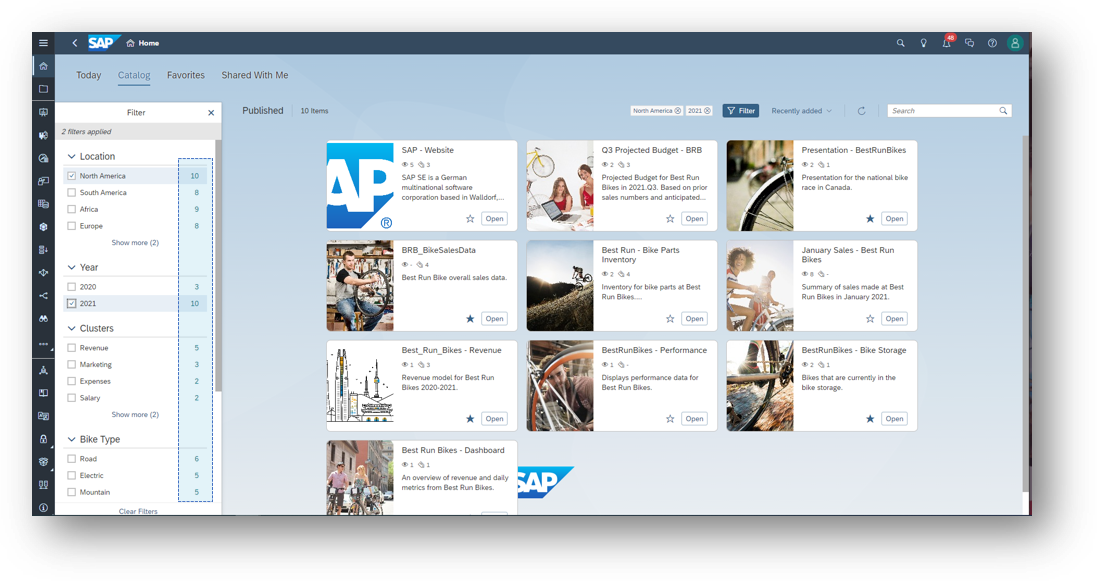
Users can now report and plan on new models with calculations and currencies. Note that currency variables should have a default value (prompting is not yet available) and that changed models need to be re-inserted again.
This blog post provides a high-level overview of the latest features and enhancements in SAP Analytics Cloud and SAP Digital Boardroom. For further details, please visit the SAP Analytics Cloud Help Portal.
Please note that the SAP Analytics Cloud Help Portal is updated at the same time as the upgrade to this release, so the links here may not yet reflect what is described below until after the upgrade is complete.
Technical Requirements
Be sure to upgrade to the latest SAP Analytics Cloud agent version 1.0.333 to take advantage of all the data acquisition types. Here are the minimum data acquisition requirements:
- Version 1.0.99 for SAP ERP/SQL Database
- Version 1.0.91 for SAP Universe (UNX)
- Version 1.0.233 for SAP Business Warehouse (BW)
- Version 1.0.235 for SAP HANA View
- Version 1.0.248 for File Server
- Version 1.0.75 for all other data source types
SAP Analytics Cloud fully supports Microsoft Edge and Google Chrome for all activities and areas of viewing, authoring, and administration. For more information, check out the following System Requirements and Technical Prerequisites.
Release Highlights
- Data Integration
- Live Connections to SAP Business Warehouse
- Live Connections to SAP Business Warehouse
- Data Discovery
- Dashboard and Story Design
- Data Visualization
- Stabilize Front-End Client Calculations in Tables
- Use Thresholds and Cross Calculations in Charts
- Explore New Features of Optimized View Mode
- Data Visualization
- Enterprise Planning
- Define Recommended Planning Area in Version Management
- Add Automatic Calendar Tasks to Parent Processes
- Leverage New User Interface of Calendar Wizard
- Analytics Design
- Enable Calendar Task Utility APIs
- Integrate a Planning Area in Analytics Designer copy() API
- Manage Links among Widgets in Linked Analysis Diagrams
- Mobile Analytics
- Access Analytics Catalog in Mobile App on iOS
- Allow Editing in the Tenant URL Screen with Default URL Policy applied by MDM
- Analytics Platform Services
- Apply Rich Text Formatting to Scheduled Messages
- Access All Resource Types in My Files across Workspaces
- Analytics Cataloging
- Customize the Layout of Catalog Cards with Rich Text Editor
- Leverage Filter Enhancements in the Catalog
- Add-In for Microsoft Office
Data Integration
Live Connections to SAP Business Warehouse
Configure Text Display Options in Tables
When working on tables with SAP BW live data connections, users can now format the ID and description of row members to short, medium, or long text through the context menu item "Display Options". This feature enhances the text/description of dimensions visually within tables that are available through Story, Analytical Application, and Data Analyzer in both edit and view mode. Note that the type and number of format options to be displayed in the sub menu depends on the back-end configuration and that these options are not enabled for UDH dimension.

Data Discovery
Set Number Formatting for Specific Measures in Data Analyzer
Users can now use the styling panel in Data Analyzer to change the number formatting for specific measures at runtime including measure selection, scale format, display unit or currency, and decimal place.

Dashboard and Story Design
Data Visualization
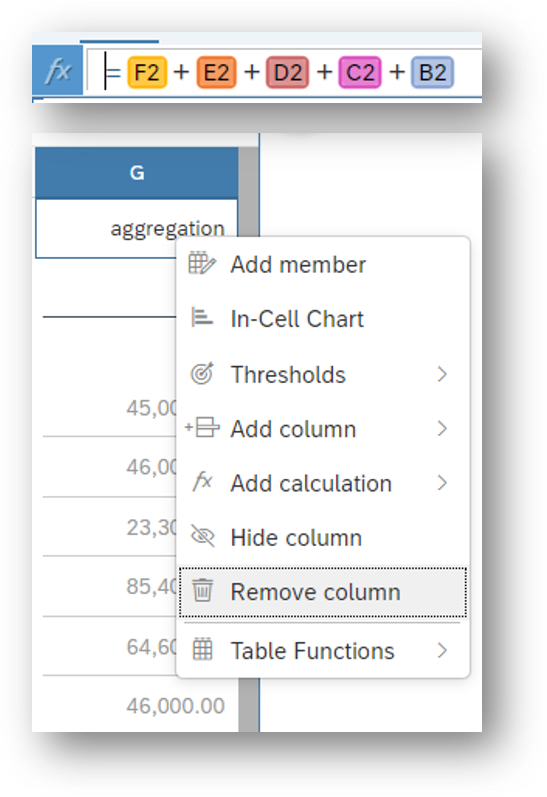
Stabilize Front-End Client Calculations in Tables
Users can now remove client calculations without also removing the relevant anchored calculations in a table. This feature offers a more convenient table design that is less prone to errors.
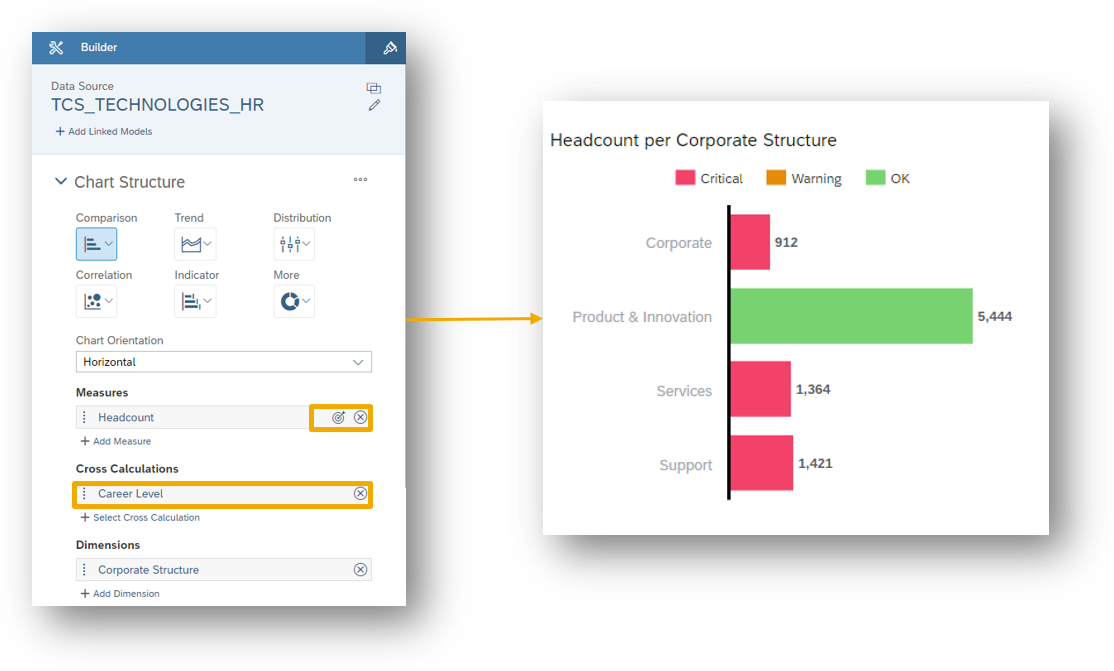
Use Thresholds and Cross Calculations in Charts
Thresholds are now supported with cross calculations added to charts. Note that this feature is currently not available on the mobile app.
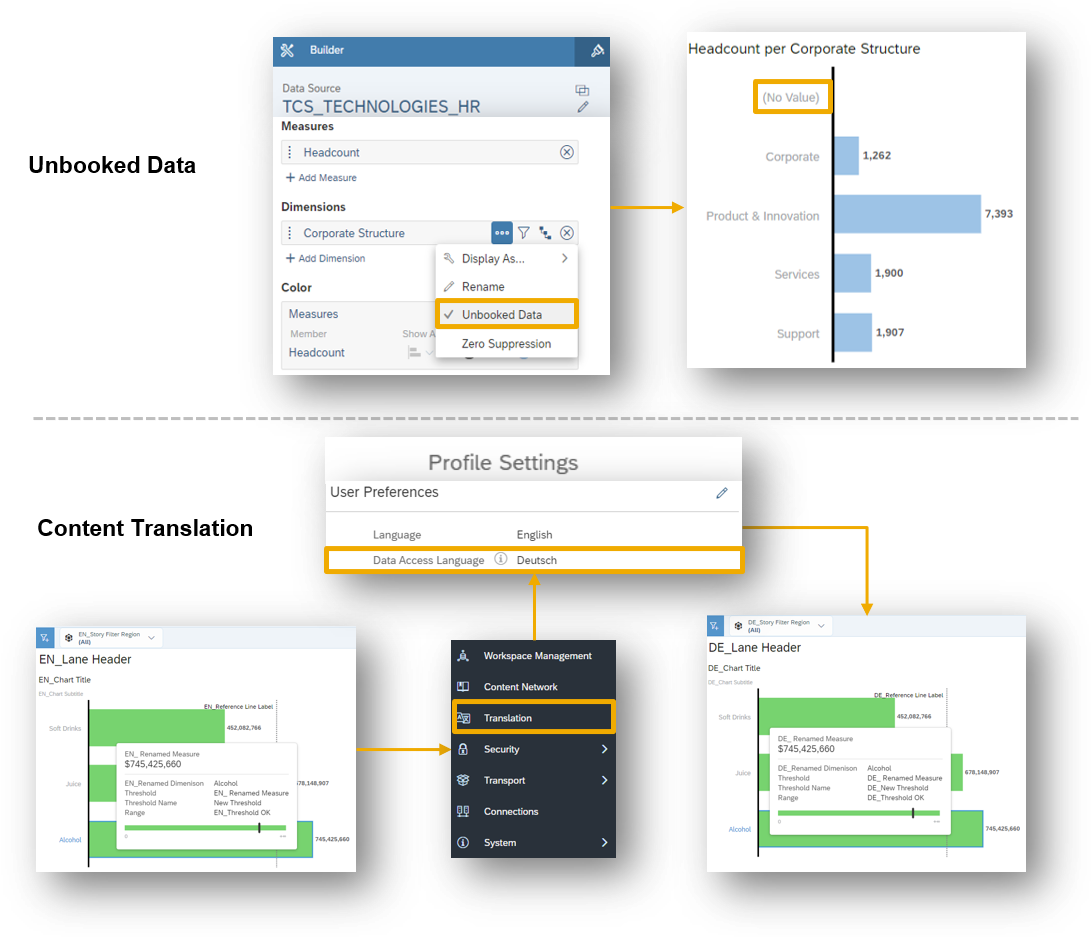
Explore New Features of Optimized View Mode
Optimized View Mode now supports the following features once a story is resaved:
- Unbooked Data on Charts
- Consumption of Bookmarks (Prompts and Variables and BW Dynamic Variable Filters)
- Public URL API
- Story Content Translation
- Minimum Drill (Measures with Required Dimensions)
- Geo Layers with Dynamic Variable Filters (BW)
For additional information on Optimized View Mode, check out the following resources:
Enterprise Planning
Define Recommended Planning Area in Version Management
Users can now define a recommended planning area on a planning model to optimize version size when editing public versions or creating private versions. The planning area is based on existing data access configurations such as Data Access Control and/or Data Locking. Furthermore, the version management panel and dialogs have been adjusted to indicate the scope of edit. This feature improves performance for planning processes especially with large versions.

Add Automatic Calendar Tasks to Parent Processes
Users can now add a parent process to automatic calendar tasks. To define the duration of the process more precisely, users can edit the estimated due date of the automatic tasks. The default duration is 10 minutes.
After creation, the automatic tasks are now inactive and need to be activated to change their status to open. This innovation allows users to automatically lock data or execute data actions as part of their larger planning processes.
Leverage New User Interface of Calendar Wizard
Users can now add work files and multiple review rounds to their generated tasks and processes in the Calendar Wizard. This feature enables users to easily and quickly design larger planning processes along a driving dimension.

Analytics Design
Enable Calendar Task Utility APIs
Application designers can now use the technical component "Calendar Integration" together with the following new APIs for the calendar task of type composite, general, or review:
- canUserSubmit() and canUserDecline() APIs to verify if you can submit/decline a calendar task for the assignee user role
- canUserApprove() and canUserReject() APIs to verify if you can approve/reject a calendar task for the reviewer user role or assignee role on a review task
This feature helps with testing if a status change API can be used while providing an overview on what calendar tasks are to be submitted, declined, approved, or rejected as well.
Integrate a Planning Area in Analytics Designer copy() API
Application designers can now choose to copy data from a version to a Planning Area when using the copy() API. This feature enhances performance and mitigates errors for invalid operations regarding the Planning Area.
Manage Links among Widgets in Linked Analysis Diagrams
The new linked analysis diagram allows application designers to get a visual overview of all the links among widgets, after they create a linked analysis or a filter line in their analytic application. In addition, application designers can also modify the existing relationships for each widget directly here.


Mobile Analytics
Access Analytics Catalog in Mobile App on iOS
Content discovery is enhanced with the Catalog as iOS mobile app users are now able to:
- View list of published catalogs on mobile devices (iPhone, iPad)
- View list of files associated with a catalog
- Open supported content types in a catalog
- Search through list of published catalogs
- Sort the list by recently added, most viewed, and alphabetical
- Have the Catalog as a default tab

Allow Editing in the Tenant URL Screen with Default URL Policy applied by MDM
iOS mobile app administrators can now push a configuration through the supported MDM tools to allow editing for the enforced default server URL to a new connection URL by using a Key/Value pair "isServerEditable=True".
Note that there is no auto-connect supported, on log-off MDM default URL is pre-filled, and the setting default server is not available. This feature allows administrators to make the tenant URL editable and connect to multiple tenants when the app is managed by an MDM with a default URL configured as well.

Analytics Platform Services
Apply Rich Text Formatting to Scheduled Messages
Schedulers can now format their messages in rich text and add links for further reference content when scheduling and sharing stories over email.
Access All Resource Types in My Files across Workspaces
Content creators can now use all resource types that are available in the "My Files" area within content creation workflows from any workspace while subject to their access rights on the resources.

Analytics Cataloging
Customize the Layout of Catalog Cards with Rich Text Editor
Catalog administrators can create custom tabs in addition to the "Overview" tab which are then available to content creators to surface additional metadata for content in the Catalog view. A rich text formatting editor has been introduced for content editing experience.

Leverage Filter Enhancements in the Catalog
By default, the catalog sort and filter state will be remembered by the system for subsequent visits to the Catalog. The filter panel open/close state is remembered across sessions and is included in the URL with sort parameters.
In the filter panel, the count of the number of items is shown and the cascading filter behaviour dynamically hides irrelevant filter members. These features enhance the user experience by remembering user selections and improve the ability to get to search results quicker by showing relevant filters.
Add-In for Microsoft Office
Report and Plan on New Models
Users can now report and plan on new models with calculations and currencies. Note that currency variables should have a default value (prompting is not yet available) and that changed models need to be re-inserted again.

This blog post provides a high-level overview of the latest features and enhancements in SAP Analytics Cloud and SAP Digital Boardroom. For further details, please visit the SAP Analytics Cloud Help Portal.
- SAP Managed Tags:
- SAP Analytics Cloud,
- SAP Analytics Cloud for planning,
- Data and Analytics
Labels:
3 Comments
You must be a registered user to add a comment. If you've already registered, sign in. Otherwise, register and sign in.
Labels in this area
-
ABAP CDS Views - CDC (Change Data Capture)
2 -
AI
1 -
Analyze Workload Data
1 -
BTP
1 -
Business and IT Integration
2 -
Business application stu
1 -
Business Technology Platform
1 -
Business Trends
1,658 -
Business Trends
94 -
CAP
1 -
cf
1 -
Cloud Foundry
1 -
Confluent
1 -
Customer COE Basics and Fundamentals
1 -
Customer COE Latest and Greatest
3 -
Customer Data Browser app
1 -
Data Analysis Tool
1 -
data migration
1 -
data transfer
1 -
Datasphere
2 -
Event Information
1,400 -
Event Information
67 -
Expert
1 -
Expert Insights
177 -
Expert Insights
307 -
General
1 -
Google cloud
1 -
Google Next'24
1 -
GraphQL
1 -
Kafka
1 -
Life at SAP
780 -
Life at SAP
13 -
Migrate your Data App
1 -
MTA
1 -
Network Performance Analysis
1 -
NodeJS
1 -
PDF
1 -
POC
1 -
Product Updates
4,576 -
Product Updates
349 -
Replication Flow
1 -
REST API
1 -
RisewithSAP
1 -
SAP BTP
1 -
SAP BTP Cloud Foundry
1 -
SAP Cloud ALM
1 -
SAP Cloud Application Programming Model
1 -
SAP Datasphere
2 -
SAP S4HANA Cloud
1 -
SAP S4HANA Migration Cockpit
1 -
Technology Updates
6,873 -
Technology Updates
434 -
Workload Fluctuations
1
Related Content
- What’s New in SAP Analytics Cloud Release 2024.09 in Technology Blogs by SAP
- SAP BW/4 - revamp and true to the line 2024 in Technology Blogs by Members
- SAP Fiori for SAP S/4HANA - Empowering Your Homepage: Enabling My Home for SAP S/4HANA 2023 FPS01 in Technology Blogs by SAP
- Composite Data Source Configuration in Optimized Story Experience in Technology Blogs by SAP
- 体验更丝滑!SAP 分析云 2024.07 版功能更新 in Technology Blogs by SAP
Top kudoed authors
| User | Count |
|---|---|
| 26 | |
| 20 | |
| 12 | |
| 11 | |
| 9 | |
| 9 | |
| 8 | |
| 8 | |
| 7 | |
| 7 |