- SAP Community
- Products and Technology
- Technology
- Technology Blogs by SAP
- SHAP Interaction values with Automated Predictive ...
Technology Blogs by SAP
Learn how to extend and personalize SAP applications. Follow the SAP technology blog for insights into SAP BTP, ABAP, SAP Analytics Cloud, SAP HANA, and more.
Turn on suggestions
Auto-suggest helps you quickly narrow down your search results by suggesting possible matches as you type.
Showing results for
Advisor
Options
- Subscribe to RSS Feed
- Mark as New
- Mark as Read
- Bookmark
- Subscribe
- Printer Friendly Page
- Report Inappropriate Content
06-23-2023
3:42 PM
We already covered SHAP-explained models for classification and regression scenarios in a previous APL blog post, and at the time we talked briefly about the main effect of a predictor and its interaction effect with the other predictors of the model. Now with HANA ML 2.17, you have the ability to visualize the interaction between variables in a heatmap. This new visualization adds to the bar chart Variable Importance in providing a global explanation of the classification/regression model. To get that new feature you need APL 2311 or a later version.
This blog will walk you through an example using the Census dataset that comes with APL.
First, we train a gradient boosting classification model with the interaction parameter set to true:
When the model training is completed, we ask for the report:
You may want to generate the report as an HTML file:
The usual "Variable Importance" tab provides a global explanation of the predictive model.
But because we explicitly requested the interactions when setting the model parameters, a new tab "Interaction Matrix" appears at the end:
On the diagonal is the main effect of each variable. The interaction matrix presents only the variables with the highest interactions. By default, it is limited to a size of 6x6. For a larger matrix, 9x9 for example, we must specify a maximum number as follows:
The larger the matrix, the longer it takes to fit the model.
If needed, one can obtain the interaction values in a pandas dataframe:
These figures are computed using the Shapley Taylor index.
To know more about APL
This blog will walk you through an example using the Census dataset that comes with APL.
from hana_ml import dataframe as hd

conn = hd.ConnectionContext(userkey='MLMDA_KEY')

sql_cmd = 'SELECT * FROM "APL_SAMPLES"."CENSUS" ORDER BY 1'

hdf_train = hd.DataFrame(conn, sql_cmd)
First, we train a gradient boosting classification model with the interaction parameter set to true:
from hana_ml.algorithms.apl.gradient_boosting_classification import GradientBoostingBinaryClassifier

apl_model = GradientBoostingBinaryClassifier(variable_auto_selection=True,

                                             interactions=True)

apl_model.fit(hdf_train, label='class', key='id')
When the model training is completed, we ask for the report:
from hana_ml.visualizers.unified_report import UnifiedReport

UnifiedReport(apl_model).build().display()
You may want to generate the report as an HTML file:
apl_model.generate_html_report('APL_Census')The usual "Variable Importance" tab provides a global explanation of the predictive model.

But because we explicitly requested the interactions when setting the model parameters, a new tab "Interaction Matrix" appears at the end:

On the diagonal is the main effect of each variable. The interaction matrix presents only the variables with the highest interactions. By default, it is limited to a size of 6x6. For a larger matrix, 9x9 for example, we must specify a maximum number as follows:
apl_model = GradientBoostingBinaryClassifier(variable_auto_selection=True,

                                             interactions=True,

                                             interactions_max_kept=8)

apl_model.fit(hdf_train, label='class', key='id')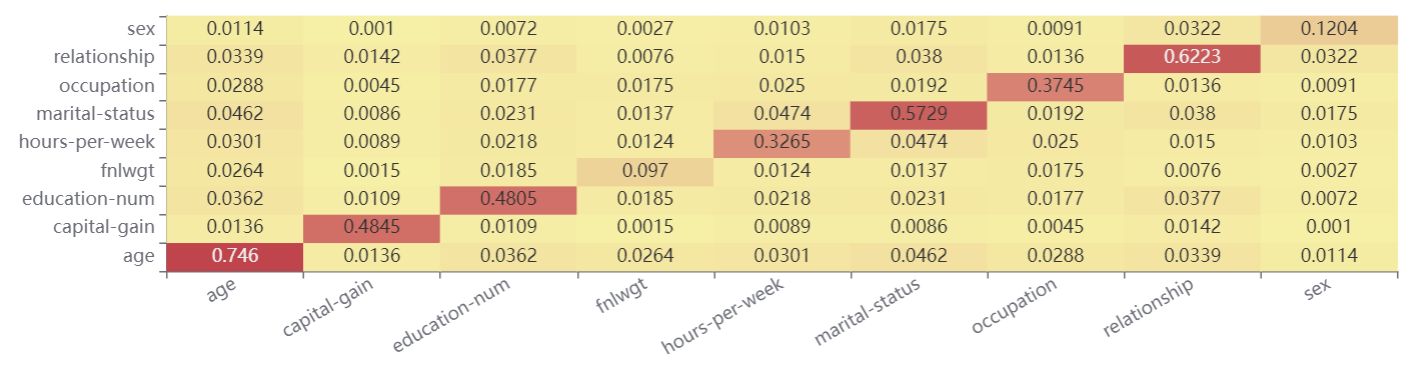
The larger the matrix, the longer it takes to fit the model.
If needed, one can obtain the interaction values in a pandas dataframe:
df = apl_model.get_debrief_report('ClassificationRegression_InteractionMatrix').deselect('Oid').collect()

df.style.hide(axis='index')
These figures are computed using the Shapley Taylor index.
To know more about APL
- SAP Managed Tags:
- Machine Learning,
- Python,
- SAP HANA
Labels:
1 Comment
You must be a registered user to add a comment. If you've already registered, sign in. Otherwise, register and sign in.
Labels in this area
-
ABAP CDS Views - CDC (Change Data Capture)
2 -
AI
1 -
Analyze Workload Data
1 -
BTP
1 -
Business and IT Integration
2 -
Business application stu
1 -
Business Technology Platform
1 -
Business Trends
1,658 -
Business Trends
105 -
CAP
1 -
cf
1 -
Cloud Foundry
1 -
Confluent
1 -
Customer COE Basics and Fundamentals
1 -
Customer COE Latest and Greatest
3 -
Customer Data Browser app
1 -
Data Analysis Tool
1 -
data migration
1 -
data transfer
1 -
Datasphere
2 -
Event Information
1,400 -
Event Information
70 -
Expert
1 -
Expert Insights
177 -
Expert Insights
336 -
General
1 -
Google cloud
1 -
Google Next'24
1 -
GraphQL
1 -
Kafka
1 -
Life at SAP
780 -
Life at SAP
14 -
Migrate your Data App
1 -
MTA
1 -
Network Performance Analysis
1 -
NodeJS
1 -
PDF
1 -
POC
1 -
Product Updates
4,575 -
Product Updates
378 -
Replication Flow
1 -
REST API
1 -
RisewithSAP
1 -
SAP BTP
1 -
SAP BTP Cloud Foundry
1 -
SAP Cloud ALM
1 -
SAP Cloud Application Programming Model
1 -
SAP Datasphere
2 -
SAP S4HANA Cloud
1 -
SAP S4HANA Migration Cockpit
1 -
Technology Updates
6,872 -
Technology Updates
468 -
Workload Fluctuations
1
Related Content
- Improving Time Management in SAP S/4HANA Cloud: A GenAI Solution in Technology Blogs by SAP
- IoT - Ultimate Data Cyber Security - with Enterprise Blockchain and SAP BTP 🚀 in Technology Blogs by Members
- New Machine Learning features in SAP HANA Cloud in Technology Blogs by SAP
- Forecast Local Explanation with Automated Predictive (APL) in Technology Blogs by SAP
- Predictive Forecast Disaggregation in Technology Blogs by SAP
Popular Blog Posts
| Subject | Kudos |
|---|---|
|
|
|
|
|
|
|
|
|
|
|
|
|
|
|
|
|
|
|
Top kudoed authors
| User | Count |
|---|---|
| 18 | |
| 12 | |
| 10 | |
| 8 | |
| 7 | |
| 6 | |
| 6 | |
| 6 | |
| 6 | |
| 6 |