- SAP Community
- Products and Technology
- Technology
- Technology Blogs by SAP
- Forecast Local Explanation with Automated Predicti...
- Subscribe to RSS Feed
- Mark as New
- Mark as Read
- Bookmark
- Subscribe
- Printer Friendly Page
- Report Inappropriate Content
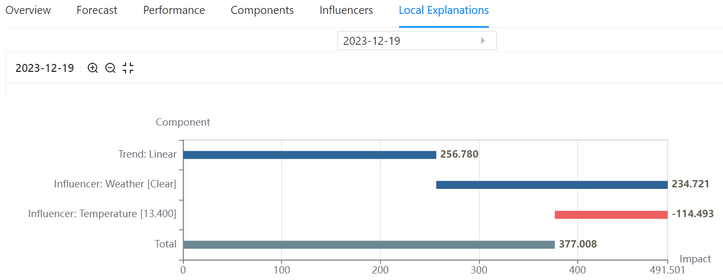
In HANA ML 2.20, APL introduces a new tab “Local Explanations” in the time series HTML report. This new tab includes a waterfall chart showing how each component of the time series model contributed to individual forecasts. Thanks to this visualization end users will be able to better understand how individual forecasts are generated by the predictive model. This feature requires APL 2325 or a later version.
Let’s create a Jupyter notebook to see how it works.
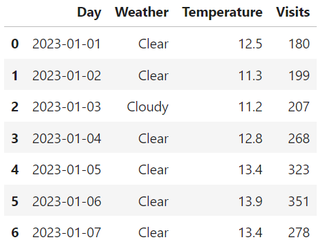
We will use a daily number of visits for a touristic site. This series has two candidate predictors, Weather and Temperature, that can help improve the forecast accuracy.
We first define the HANA dataframe for the input series:
from hana_ml import dataframe as hd
conn = hd.ConnectionContext(userkey='MLMDA_KEY')
series_in = conn.table('DAILY_VISITS', schema='APL_SAMPLES')
series_in.head(7).collect()
Then we fit the historical data and extrapolate 7 days ahead:
from hana_ml.algorithms.apl.time_series import AutoTimeSeries
apl_model = AutoTimeSeries(time_column_name= 'Day', target= 'Visits',
                           horizon= 7, last_training_time_point='2023-12-17 00:00:00')
series_out = apl_model.fit_predict(data = series_in, build_report=True)
df_out = series_out.collect()
Last, we generate the HTML report:
apl_model.generate_html_report('my_html')
apl_model.generate_notebook_iframe_report()
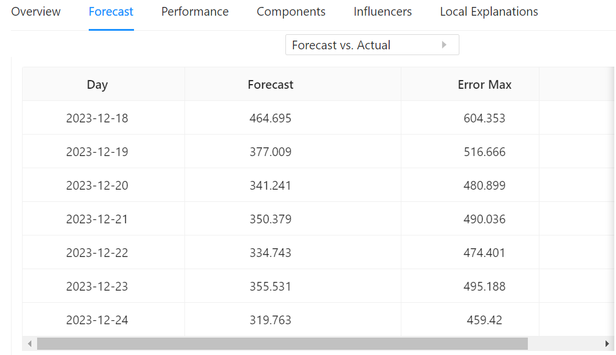
Here are the 7 values in the horizon presented in a table:
The forecasted value for December 19th is: 377. To see how this number is decomposed we go to the Local Explanations tab:
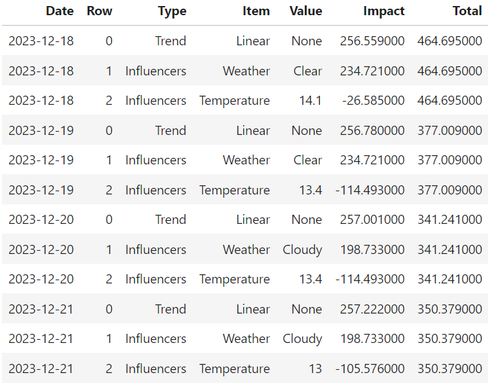
The data used to build the waterfall chart comes from the following tabular report:
df = apl_model.get_debrief_report('TimeSeries_ForecastBreakdown').deselect('Oid').collect()
df.style.hide(axis='index')
- SAP Managed Tags:
- Machine Learning,
- SAP HANA Cloud, SAP HANA database,
- Python
You must be a registered user to add a comment. If you've already registered, sign in. Otherwise, register and sign in.
-
ABAP CDS Views - CDC (Change Data Capture)
2 -
AI
1 -
Analyze Workload Data
1 -
BTP
1 -
Business and IT Integration
2 -
Business application stu
1 -
Business Technology Platform
1 -
Business Trends
1,658 -
Business Trends
95 -
CAP
1 -
cf
1 -
Cloud Foundry
1 -
Confluent
1 -
Customer COE Basics and Fundamentals
1 -
Customer COE Latest and Greatest
3 -
Customer Data Browser app
1 -
Data Analysis Tool
1 -
data migration
1 -
data transfer
1 -
Datasphere
2 -
Event Information
1,400 -
Event Information
67 -
Expert
1 -
Expert Insights
177 -
Expert Insights
308 -
General
1 -
Google cloud
1 -
Google Next'24
1 -
GraphQL
1 -
Kafka
1 -
Life at SAP
780 -
Life at SAP
13 -
Migrate your Data App
1 -
MTA
1 -
Network Performance Analysis
1 -
NodeJS
1 -
PDF
1 -
POC
1 -
Product Updates
4,576 -
Product Updates
351 -
Replication Flow
1 -
REST API
1 -
RisewithSAP
1 -
SAP BTP
1 -
SAP BTP Cloud Foundry
1 -
SAP Cloud ALM
1 -
SAP Cloud Application Programming Model
1 -
SAP Datasphere
2 -
SAP S4HANA Cloud
1 -
SAP S4HANA Migration Cockpit
1 -
Technology Updates
6,873 -
Technology Updates
438 -
Workload Fluctuations
1
- The 2024 Developer Insights Survey: The Report in Technology Blogs by SAP
- IoT - Ultimate Data Cyber Security - with Enterprise Blockchain and SAP BTP 🚀 in Technology Blogs by Members
- New Machine Learning features in SAP HANA Cloud in Technology Blogs by SAP
- Trigger a process in SAP Build Process Automation from SAP Build Apps without using API in Technology Blogs by SAP
| User | Count |
|---|---|
| 24 | |
| 15 | |
| 13 | |
| 11 | |
| 11 | |
| 10 | |
| 9 | |
| 9 | |
| 8 | |
| 8 |


