
- SAP Community
- Products and Technology
- Technology
- Technology Blogs by SAP
- SAP BI 4.3 SP4: What’s New In Web Intelligence and...
Technology Blogs by SAP
Learn how to extend and personalize SAP applications. Follow the SAP technology blog for insights into SAP BTP, ABAP, SAP Analytics Cloud, SAP HANA, and more.
Turn on suggestions
Auto-suggest helps you quickly narrow down your search results by suggesting possible matches as you type.
Showing results for
Advisor
Options
- Subscribe to RSS Feed
- Mark as New
- Mark as Read
- Bookmark
- Subscribe
- Printer Friendly Page
- Report Inappropriate Content
12-04-2023
12:31 AM

Over the years, this has become a December tradition: A new Support Package is available for SAP BI 4.3! This fourth one, comes as usual with great innovations, long awaited capabilities and usability enhancements requested by customers. This is the perfect Support Package you need until the release of SAP BI 2025 who will come with unexpected and breakthrough features.
This article is a complement of the official SAP documentation. It is part of the
What’s New in Web Intelligence and Semantic Layer series and summarizes the following changes:
- Web Intelligence: Data Mode
- Web Intelligence: Query
- Web Intelligence: Prompts
- Web Intelligence: Reporting
- Web Intelligence: Display Format
- Web Intelligence: Formula Language
- Web Intelligence: Hyperlinks and OpenDocument
- Web Intelligence: Usability Enhancements
- Web Intelligence: Customization
- Web Intelligence: SDK
- Semantic Layer: Data Sources
- Semantic Layer: Information Design Tool
- Semantic Layer: Java SDK
Web Intelligence: Data Mode⤒
The Data mode introduced in SAP BI 4.3 SP3 has been improved. Combining cubes is more powerful and flexible while more help is provided in its user interface.
Virtual Cube
In SAP BI 4.3 SP3, you create a virtual, combined cube to synchronize the datasets of two (and only two) cubes. In a combination, the objects identifiers are re-used, and a cube can be the parent of only one combined cube to avoid name collision.
To support new functional requirements, in SAP BI 4.3 SP4, the concept of virtual cube is extended, and a virtual cube can have one, two or more parents:
- A virtual cube with one parent is a copy of its parent.
- A virtual cube with two parents is like the SAP BI 4.3 SP3 combined cube, where a primary parent cube is combined with a secondary parent cube through an operator.
- A virtual cube with more than two parents is also a combined cube, where a primary parent cube is successively combined with several secondary parent cubes.

Virtual Cubes
When a virtual cube is created, new identifiers are created for the objects of this cube and there is no longer name collision between different cubes. Hence the limitation to use a cube only once as a parent does not apply anymore and the same cube can:
- Have several child cubes.
- Be used in the combinations of different cubes (as primary or secondary cube).
- Be used several times in the same virtual cube definition (as secondary cubes).
Virtual cubes are identified by a name that must be unique in the document.
Create Child
You can create a child of a cube to keep its dataset before applying other transformations or combining it:
- Any cube can have a child: a query cube or a virtual cube.
- The resulting virtual cube has only one parent, with the same objects and dataset, but this cube and its objects have new identifiers.
- Transformations can be applied to this child cube: only this cube’s dataset is impacted.
- A cube can have multiple children.

Cubes' Children
To create a cube’s child, you can select a cube in the Graph Panel and:
- Select the Create Child command in its context menu.
- Or drag and drop it in an empty location in the canvas.
- Or click the Create Child button (
 ) in the toolbar.
You can also select this cube in the Main > Objects tab and select the Create Child command in its context menu.
The new created cube is displayed in the Graph Panel and in the Main > Objects tab and is identified with the Child icon (
).Combine Cubes
The Combine feature released in SAP BI 4.3 SP3 has the following limitations:
- It is not available by default and must be explicitly enabled through a toggle.
- It supports only two operators: Left join and Append.
- It is possible to combine only two cubes, and these cubes can’t be used in other combinations.
In SAP BI 4.3 SP4, these limitations have been addressed:
- This feature is available by default. As in SAP BI 4.3 SP3, a combination is defined by an operator and a list of paired objects (the keys) in each cube.
- The other usual operators are available to complete the Left Join and Append:
 : Full join.
 : Inner join.
 : Left join without intersection.
 : Full join without intersection.
- You can combine more than two cubes at once:
- The first cube, the primary cube, is combined with a first secondary cube.
- The other secondary cubes are then successively combined with the result of the previous combination.
- When all cubes have been combined, the resulting cube defines the objects and dataset of the final combined cube.
These combinations are ordered, and this order impacts the resulting objects and dataset at each step.
Applying several combinations to generate one single combined cube reduces the number of cubes and datasets in the document.
Because of these changes, combined cubes created in SAP BI 4.3 SP3 are no more supported in SAP BI 4.3 SP4 and must be recreated. When opening a document with such cubes in another mode than Reading mode, they are removed after a warning message.
Transformations defined on a combined cube are applied after all combinations have been performed.
To combine cubes and create a virtual cube:
- Select the cubes to combine in the Graph Panel.
- In the Graph Panel toolbar, select the Create Cube button (
 ).
). - The Create Cube dialog box opens. The first selected cube is displayed as the primary cube, whereas the second one is used as secondary cube for the first combination.
- In the Operators drop-down menu, select the operator to apply (Left join by default). The tooltip over the question mark icon (
 ) shows the operator’s example.
 - Select the Add keys (
 ) button to open the Edit Keys dialog box. It displays the objects of the two cubes in two separate columns.
 - Select an object in each column to map them and create a key. These objects are moved up, in the Selected Keys section.
- o Repeat the previous step to create as many keys as needed.
- To remove a key, click the Remove icon (
 ) beside the objects defining the key.
 - Click OK to validate the selected keys.
- Repeat these steps for each combination.
- You may click the Add cube button (
 ) in the dialog box footer to add another combination in the cube definition. You then need to select an operator, another cube to combine and a list of keys to combine these cubes.
 - Click Create to finalize the combined cube creation.

Create Combined Cube: Operator List

Edit Keys Dialog Box
The new created cube is displayed in the Graph Panel and in the Main > Objects tab. It is linked to its parent cubes and is identified with the operator icon if it has only two parents or the Combined cube icon (
) if it has more than two parents.Managing Virtual Cubes
To edit or delete a virtual cube, you can:
- Select it in the Graph Panel and:
- Click the Edit or Delete button in the Graph Panel toolbar.
- Or select the Edit or Delete command in its context menu.
- Select it in the Main > Objects tab and in its context menu, select the Edit or Delete command.
When you edit a child or combined cube, the Edit Cube dialog box opens where you can rename it, change its description, modify its combinations, or add a new combination. When you edit a virtual cube in the Edit Cube dialog box, you can also click the Add cube button (
) to add a new combination: A new line appears where you must select the operator, the cube to combine and the keys.Adding a new combination to a cube does not modify the identifiers of this cube’s objects. If these objects are already used in the report, the lists of values they return take into consideration the new added combination. If you create a new cube, its objects have new identifiers, and you must replace these objects in the report to take into consideration the new added combination.
To add a combination to an existing virtual cube, you can also:
- Select a cube in the Graph Panel and drag and drop it while pressing the [Ctrl] key on a virtual cube to add the first cube as a combination of the second one.
- Or select two cubes in the Graph Panel and click the Add Combination button (
 ) in the toolbar. The second selected cube is added as a combination to the first selected cube, that must be a virtual cube.

Edit Cube Dialog Box
This opens the Edit Cube dialog box to edit this virtual cube. A new combination with the other cube is added and you may change its operator and the default keys.
If some transformations are applied to the virtual cube, if a new combination is added, then these transformations apply after this new combination. If this is not the expected behavior, it remains possible to create explicitly a new combined cube who uses this cube as parent. But in this case, the new cube has new objects with new identifiers. To take advantage of its new dataset would require replacing the previous objects with the new objects in the report in Design mode.
Hide Cubes and Objects
You usually combine cubes to focus on their resulting dataset. Their parent cubes can be seen as temporary cubes that you do not necessarily need to have in Design mode to create your document. In Data mode, you can hide cubes, so they do not appear anymore in Design mode.
In the Graph Panel or the Main > Objects tab, use the Hide (or Show) command in the context menu of a cube to hide (or show) it. The Hidden icon (
 ) appears beside hidden cube.
Combined cubes inherit all objects from their parent cubes. But these objects may turn out to be useless to design the document. Identically, in Data mode, you can hide objects, so they do not appear in Design mode.
In the Main > Objects tab, you can use the Hide in children cubes (or Show in children cubes) command in the context menu of an object to hide (or show) it. The Hidden icon (
) appears beside hidden object.In the Main > Objects tab, use the Show main view/Show all cubes toggle button (
 ) to display all cubes or only the cubes and objects that are visible in Design mode.
Copy Paste
If you are connected through HTTPS or if you are using the Rich Client, you can copy lines and columns from Dataset View tables or facets and paste them into the Operating System’s clipboard (Request 294164😞
- With the mouse, select an area or multiple rows and columns in a table or a facet. It is not possible to select and copy disjointed cells, rows, or columns. You can use the following shortcuts:
- [Ctrl] + [A]: To select a full table or a full facet.
- Right-click + [Shift]: To select an area.
- Right-click + [Ctrl]: To toggle a selected area.
- Right-click this selection (rows headers, lines headers, selected area) and select the Copy command in the context menu (you may also use the [Ctrl] + [C] shortcut). Both the selected cells and their headers are copied into the clipboard, but the copy cannot exceed 25,000 cells.
- If you paste this selection into another tool that supports Rich Text, then the table is added with its formatting and borders. If you paste it into a simpler text editor like Notepad, a plain text version is used. Its format (column separators, text qualifiers, charset) is defined in the options set in the Export to dialog box when exporting to CSV and saved in the user settings.
Usability Enhancements
The Data mode user interface has been improved with the following changes:
- In the Dataset View, null values are displayed in blue with an italic font.
- In the Graph Panel, click the Hide data sources and queries toggle button (
 ) in the toolbar to hide or show the nodes for data sources and queries and leave more space for the cubes.
 - Right clicking a cube in the Graph Panel or the Main > Objects tab opens the same contextual menu.
- In the Main > Objects tab, the Properties icon (
 ) is displayed beside objects on which transformation(s) have been defined and cubes containing such objects.
 - When clicking a query in the Graph Panel, then the Build > Properties tab displays this query properties, including the query refresh time and the data source name and path.
- When you save a document, the following Data mode settings are saved and restored when the document is opened:
- The opened tabs and the selected one.
- For each tab: the display options (table/facet, distinct row), the displayed objects, the sorts that apply to them.
- In the Graph Panel, select a cube to highlight its links with its parents and ancestors. Select a specific parent cube inside the node of a virtual cube to highlight only the links to this parent and its ancestors.
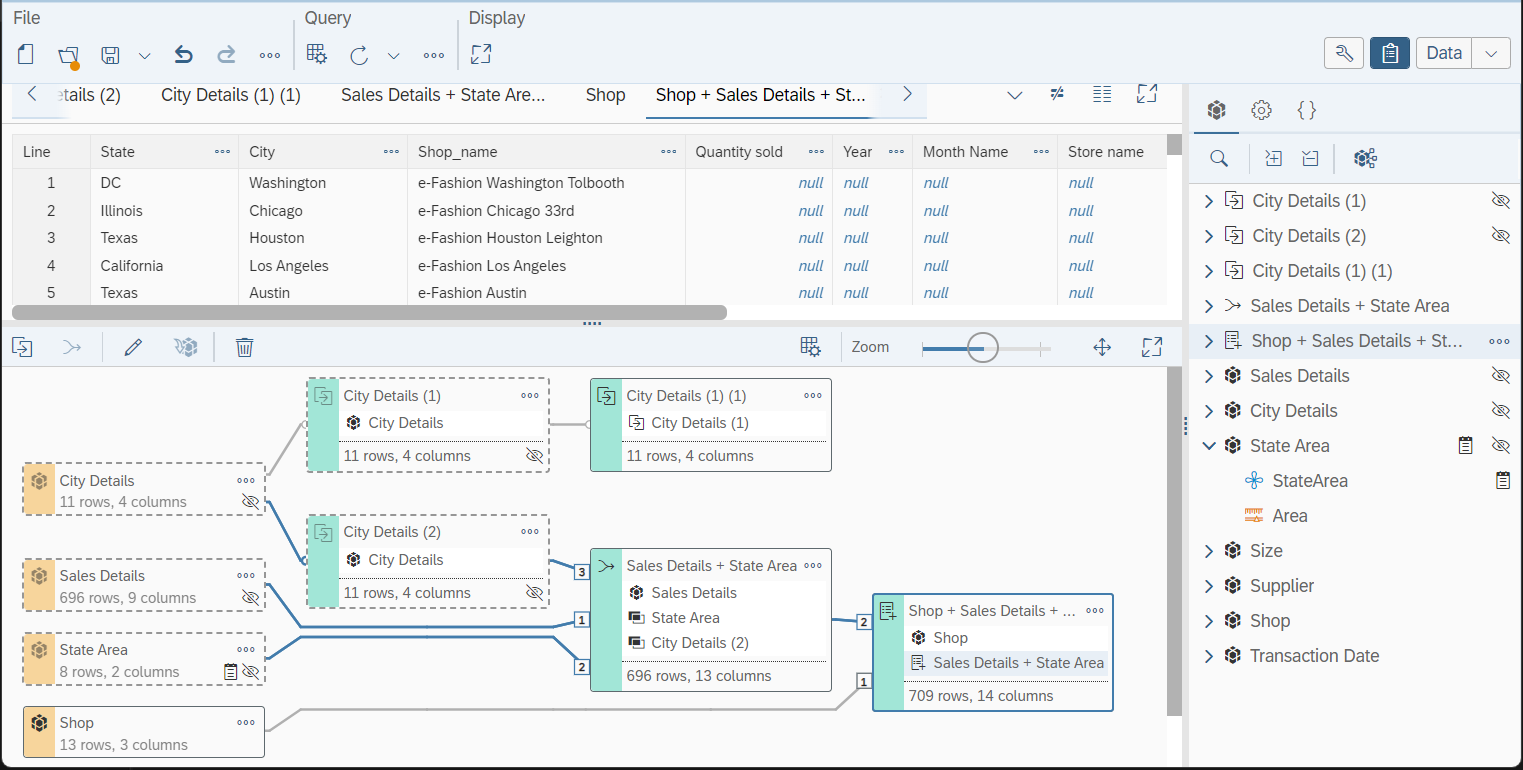
Hiding Data Sources and Queries
Web Intelligence: Query⤒
Web Intelligence Document as a Data Source
Since SAP BI 4.3, you can query another Web Intelligence document used as a data source. When this query is run, it retrieves the dataset already saved in the source document. This dataset might have been updated and saved during the last manual refresh, or through a schedule, if the Smart View > View Latest Instance option has been set in the CMC, in Web Intelligence application preferences.
In SAP BI 4.3 SP4, when you add a query based on a Web Intelligence document, you can select the new option Keep data up-to-date on refresh in the Web Intelligence Document Provider dialog box. If you select this checkbox and the document is refreshed, the underlying Web Intelligence document is refreshed as well (Request 285080).

Web Intelligence Document Provider Dialog Box
You can also modify this option in the Web Intelligence Document Provider dialog box when you edit this query in the Query Panel.
This refresh is propagated to only one level, i.e if the data source document also queries another Web Intelligence document, this document will not be refreshed.
If this document contains prompts, they are also prompted and factorized with other prompts when possible. However:
- Groups of prompts are not leveraged and not exposed.
- Prompts for contexts are not displayed and they are answered by reusing the previously selected context(s).
When creating a query in a Web Intelligence document containing multiple cubes, objects of all cubes are displayed in the Query Panel. Objects from different cubes are not compatible with each other and adding them in the same query creates multiple flows.

Query Panel
Data Source Path
When the document is refreshed, data source properties (paths, descriptions,…) are retrieved and stored in the document when it is saved.
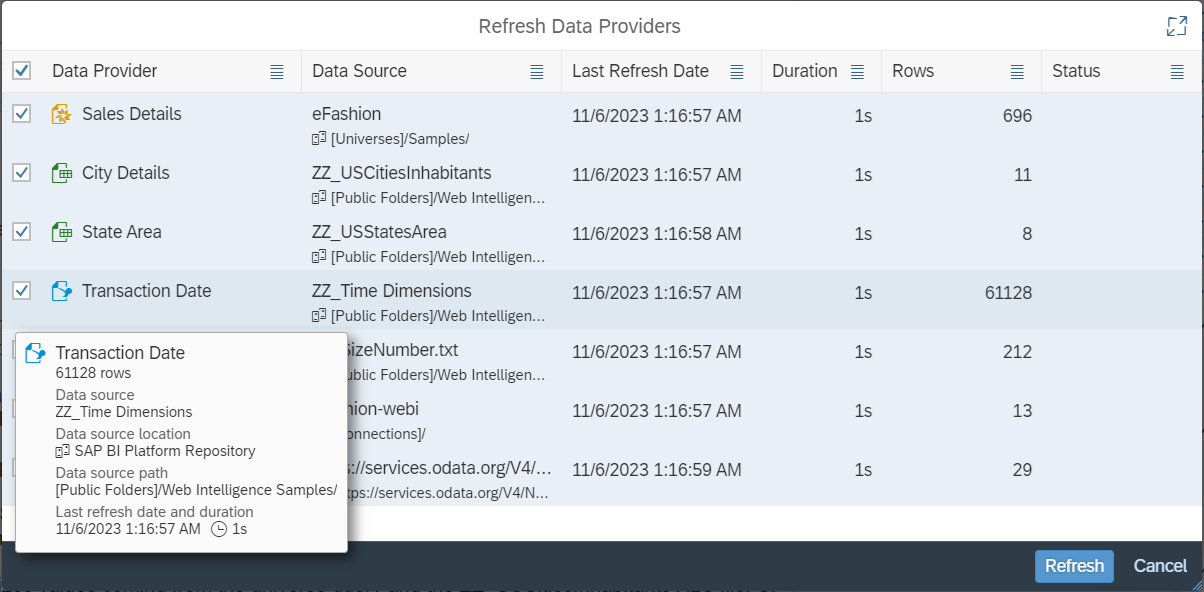
In Design mode, the Advanced Refresh, Purge Data and Change Source dialog boxes contain a new column with the queries’ data source and their path. If you hover your mouse over a query, the tooltip displays a summary of the query properties.
Design Mode: Advanced Refresh Dialog Box
This path is also displayed:
- In the Build > Properties tab when you select a query in the Main > Objects tab.
- In the Query Panel when you display a query’s properties.

Design Mode: Query Properties Tab
As these paths are retrieved only when the document is refreshed, they are not displayed if you open a document that has just been migrated from a previous release. You need to refresh it first.
Refresh in Reading Mode
In Reading mode, you can select the queries to refresh:
- If you simply click the Refresh button in the toolbar, all refreshable data sources are refreshed.
- If you open the menu in the Refresh button and select the Advanced Refresh command, the Advanced Refresh dialog box opens in which you can select the queries to refresh. This dialog box is identical to the one used in Design mode, except that it does not display the data sources’ path.

Reading Mode: Advanced Refresh Command
SAP Datasphere
In addition to universes created in Information Design Tool, Web Intelligence can query SAP Datasphere through BICS connector and direct access. Like SAP BW and SAP HANA, this direct access takes advantage of multidimensional metadata created in SAP Datasphere.
To query SAP Datasphere when creating a document, adding a query, or changing a data source:
- In the Select a Data Source dialog box, select the SAP Datasphere option in the SAP BI Platform Repository section.
- Navigate in the BI Platform repository.
- Select an OLAP connection to SAP Datasphere. Such connection can be created in Information Design Tool or the CMC.
- Browse SAP Datasphere native views that are enabled for consumption such as analytical datasets, analytic models, and perspectives from consumption models.
- In the Query Panel, create your query on this view.

SAP Datasphere in Web Intelligence Data Sources
Configuring Authentication
Web Intelligence Direct Access connects to SAP Datasphere by using the OAuth 2.0 protocol via the BI Platform.
As for Google Drive or Microsoft OneDrive, to authorize this access and query SAP Datasphere, you must first configure the OAuth 2.0 protocol in the CMC > Applications page > Authentication Server Configuration.
Once done, each user must generate its token from SAP BI Launch Pad either in the Settings dialog box of the SAP BI Launch Pad, or when s/he tries to access SAP Datasphere.
SAP BICS Support Attributes for Query Filters
In a query on top of an SAP BW, SAP HANA, or SAP Datasphere data source, you can create a filter based on an attribute (exposed as a detail in Web Intelligence), and not only on a dimension.

SAP BW/HANA/Datasphere: Filter Based on Attribute
Usability Enhancements
The following simplifications are now offered in the query creation interface:
- In the Select Excel/Text Data Source dialog boxes (used to browse the BI Platform repository and select an Excel, text, or CSV data source), you can directly upload a file into the BI Platform repository by clicking the Upload document button (
 ). This opens a browser in which you can select a file from your file system without going back to the SAP BI Launch Pad home page.
 - The Select Excel/Text Data Source and Select a Web Intelligence Document dialog boxes contain a new column, Last Updated, with the files’ last change date and time.
- The Select a Universe dialog box offers the option Show Content of Subfolders, to display the universes located in the current folder’s sub-folders or not. This option is only available in the Folders tab and can be changed by opening the Settings menu (
 ).
). - In the Query Panel, when you rename a query, the previous name is proposed by default.
- In the Query Panel, if a query contains a filter, a bullet is displayed on the Filter toolbar button (
 ).
).
Web Intelligence: Prompts⤒
Group of Prompts
You can group optional prompts to define how they are displayed and how they are answered (Request 295788).
In Design mode, in the Main > Prompts tab (
 ), click the Add Group button in the toolbar to open the Create Group dialog box.
- Enter a name to identify this new group (it is not yet possible to translate this name). You may also enter a description.
- By default, a group is mandatory and at least one of the prompts it contains must be answered. Select the Optional checkbox to turn this group into an optional one.
- By default, a group is not exclusive and any prompt of the group can be answered. Select the Exclusive checkbox so that only one of the prompts in the group can be answered. Answering one prompt of the group resets the answered values of its other prompts
- Add prompts to this group by clicking the optional prompts listed in the Available prompts panel. The selected prompts are moved to the Selected prompts panel.
- If needed, select a prompt the Selected prompts panel and use the Up (
 ) and Down (
 ) buttons to define its order in the group.
 - Click OK to confirm the group creation.

Create Group Dialog Box
The new group appears in the Main > Prompts tab. From this tab, you can select a group and:
- Click the Edit button to open the Group dialog box.
- Click the Delete button to delete this group.
- Open the Build > Properties tab to display and edit the properties of this group.
You can use the Up (
) and Down () buttons to define the groups and prompts order of appearance in the Prompts dialog box.If all optional prompts of a group are deleted or turned to mandatory, the group no longer appears in the Prompts dialog box when the document is refreshed. But in Design mode, a warning icon (
 ) is displayed beside this group in the Main > Prompts tab to highlight that this group is no longer used. You can delete it or add new optional prompts to it.
Groups in Prompts Tab
When the document is refreshed, in the Prompts dialog box, the prompts are displayed under the groups to which they have been added. You can expand or collapse a group to show or hide its prompts. If a group is mandatory, you need to answer at least one prompt from this group. If a group is exclusive, you can answer only one prompt from this group.

Groups in Prompts Dialog Box
Scheduling / Publishing: Use Source Document Values
When scheduling or publishing a document with prompts, you do not need to explicitly answer these prompts. They can be dynamically answered by using the document’s saved answers. In SAP BI Launch Pad (this option is not available in the CMC), select the Use prompt values from source document checkbox in the Prompts section of the schedule or publication definition.

Schedule Prompts Option
Using this option leads to creating an instance for which the prompts’ values are retrieved from the source document during the scheduling or publication process. These prompt values are saved in the source document if the prompt is defined with the Keep last values option or has default prompt values. If previous or default values are not saved in the document, the scheduling or publication process fails.
Usability Enhancements
The Prompts dialog box also offers a few usability enhancements:
- A prompt hint can be hidden or shown by clicking the Hint button at the top of the dialog box.
- A new yellow icon () is used to identify the mandatory prompts and groups.
- In the Prompts dialog box, the tooltip for the button used to refresh list of values is renamed as Refresh and displays the last refresh date (Request 305120).
- The former lengthy list of values is now displayed as a drop-down menu of batches rather than as a page-by-page chunk list (as in SAP BI 4.2). The default batch size is 1,000. It can be extended in the CMC, with a maximum value of 2,500. The batch can also be displayed as chunks of 1,000 values.
Web Intelligence: Reporting⤒
Hide Objects When
Until SAP BI 4.3 SP4, it was possible to always hide an object in a table. In SAP 4.3 SP4, you can also conditionally hide objects of a vertical or horizontal table (Request 109833).
In Design mode, right-click a column of a vertical table or a row of a horizontal table to open the context menu. The possible options under the Hide menu are:
- Hide Column/Row: to always hide the column or the row. This option is static and can only be changed by the report designer.
- Hide Column/Row When Empty: to hide the column/row if the corresponding object contains no data.
- Hide Column/Row When…: to hide the column/row depending on a formula. If you select this option, the Build > Format > Display Settings tab opens.
- Enter the formula in the Hide when formula is true text field.
- Click the Validate button and then the Apply button (if the Instant Apply checkbox is not selected).
When the table is displayed, the conditions (when empty or formula) to hide these columns/rows are evaluated. If they are true, the columns/rows are hidden.
You can also select a vertical and horizontal table and set these conditions:
- Directly in the Build > Format > Display Settings tab, or
- In the Data > Feeding tab, from an object’s context menu.

Hide When in Display Settings Tab
This new feature is not supported by other table types or charts. If you turn a table with conditions into an unsupported table type or into any chart, they are lost.
Maximizing Charts
In Reading mode, it is now possible to maximize custom elements. This was not the case in SAP BI 4.3 SP3.
When a chart or custom element is maximized via the Maximize button in the floating toolbar, a navigation window is displayed in the top left corner of the chart. This window displays a full preview and the zoom area of the corresponding chart.
- You can click on this window to move the zoom area around or reposition it through drag and drop.
- You can hide or display this window by clicking the Show/Hide navigation window button in the floating toolbar.
- In this floating toolbar, you can also use the Zoom in and Zoom out buttons to define the zoom level. This is an alternative to the mouse wheel button or the pinch gesture on touch screens.

Chart Navigation Window
Presentation Mode
If the Freeze Header option is selected for tables, the tables headers remain on display while you scroll through the document in Presentation mode.
Web Intelligence: Display Format⤒
New features have been added to format numeric and date/time values in your document.
Object Display Format
You can define a display format for numeric or date/time values directly on the object rather than defining it for each table or chart in which it is used.
In Design mode, select an object in the Main > Objects tab. In the Build > Properties tab, click the Edit Format link to open the Display Format dialog box. Assign a format to this object and click OK.

Object Format in Properties Tab
A preview sample using this format is displayed in the Build > Properties tab. To harmonize the user interface, the same Edit Format link that opens the Display Format dialog box is also used when defining a formatting rule.
The format defined at object level is not only used for tables and charts, but also for input controls that use this object.
The display format applying in order of priority to a value is the one defined in:
- A formatting rule, if any.
- A table or a chart, if any.
- An object (introduced in SAP BI 4.3 SP4), if any.
- A universe, if any, in case the object is defined in a universe
Display Format Dialog Box
The Display Format dialog box has been overhauled to better manage custom and assigned formats.
To create a custom format, select an existing (predefined or custom) format, and click Add Custom Format. The selected format is used as a model for the new custom format. In the New Custom Format dialog box, select the data type in the Type dropdown menu. Depending on your selection, you may enter the tokens that define values for:
- Positive, negative, null, or undefined values, if the selected data type is Number.
- Positive or undefined values, if the selected data type is Date/Time.
- True, false, or undefined values if the selected data type is Boolean.

New Custom Format Dialog Box
It is not yet possible to edit a custom format, but you can:
- Hover the mouse over a custom format to display its definition in a tooltip.
- Explicitly unassign a format from the selected formatting rule, table, chart, or object by selecting the No format is explicitly assigned radio button.
- Delete custom formats that are no longer used by clicking the Delete button () beside a custom format in the Custom category. If this button is not displayed, the custom format is still used in the document and cannot be deleted.

Format Display Dialog Box
New Numeric Display Formats
You can use the following new tokens to create custom formats for numeric values:
- COMPACT
To shorten numbers by keeping significant figures and using an abbreviated, locale-specific suffix (Request 232386😞 K for 1000, M for 1,000,000…. - LONG_COMPACT
To shorten numbers by keeping significant figures and using a locale-specific suffix displayed in full name. - CURRENCY: To display the value as a currency and apply the locale’s rules for monetary values.
- ACCOUNTING_CURRENCY
To display the value as a currency and apply the locale’s rules for accounting values (Request 102308). - CURRENCY_COMPACT
To display the value as a currency with an abbreviated metric suffix. - [MIN_DEC:n]
Used with COMPACT, LONG_COMPACT and CURRENCY_COMPACT to define the minimal number of decimals to display. It is equal to 0 by default. - [MAX_DEC:n]
Used with COMPACT, LONG_COMPACT and CURRENCY_COMPACT to define the maximum number of decimals to display. It is equal to MIN_DEC by default. - [CURRENCY:c]
Used with CURRENCY, ACCOUNTING_CURRENCY and CURRENCY_COMPACT to define the monetary symbol to display. It is ¤ by default.
The returned values depend on the user’s preferred viewing locale and follow the Unicode standards of this locale (suffix rules and translations, accounting rules…) The currency symbol cannot depend on this locale without leading to changes in values. It must therefore be explicitly set through [CURRENCY:c].
For example, the value -12,345 is displayed:
| Custom Format | Locales | ||
| English | French | Japanese | |
| COMPACT | -12K | -12 k | -1万 |
| COMPACT[MIN_DEC:2] | -12.35K | -12,35 k | -1.23万 |
| COMPACT[MAX_DEC:5] | -12.345K | -12,345 k | -1.2345万 |
| LONG_COMPACT[MIN_DEC:2] | -12.35 thousand | -12,35 mille | -1.23万 |
| CURRENCY | -¤12,345.00 | -12 345,00 ¤ | -¤12,345.00 |
| CURRENCY[CURRENCY:€] | -€12,345.00 | -12 345,00 € | -€12,345.00 |
| ACCOUNTING_CURRENCY[CURRENCY:€] | (€12,345.00) | (12 345,00 €) | (€12,345.00) |
| CURRENCY_COMPACT[CURRENCY:€] | ¤-12K | -12 k € | €-1万 |
| CURRENCY_COMPACT[CURRENCY:€][MIN_DEC:2] | €-12.35K | -12,35 k € | €-1.23万 |
These formats can also be used in the Formula Language through the FormatNumber function that formats numeric values. For example: FormatNumber([Margin]; "COMPACT[MIN_DEC:2][MAX_DEC:4]").
Time Zone Conversion
By default, Web Intelligence considers a date/time in the UTC time zone. When creating custom formats for date/time values, you can use a new token, [TIMEZONE:t] in which t corresponds to a time zone name. The date/time is converted and displayed into this specified time zone. More than 500 time zones are supported, and their list is available in the SAP Online Help. For example:
- HH:mm:ss[TIMEZONE:Etc/GMT+11]
- DATETIME[TIMEZONE:Europe/Paris]
This new token can also be used for more advanced time zone conversion (Request 203204) via two Formula Language functions: FormatDate and ToDate.
If the data type of your date/time value is string, you first need to parse it with ToDate by specifying its time zone and getting this date/time in UTC. Once you have a date/time in UTC, use FormatDate and specify the target time zone to convert the date/time in this time zone.
For example, to convert data/time values in the Europe/Paris time zone returned by the object [MyTime] whose data type is string into US/Pacific time zone, you may use the following steps:
- date [TimeParis] = ToDate ( [MyTime] ; "dd/MM/yyyy hh:mm:ss[TIMEZONE:Europe/Paris]" )
- string [TimePac] = FormatDate ( [TimeParis]; "dd/MM/yyyy hh:mm:ss[TIMEZONE:US/Pacific]" )
If the data type of your value is date, Web Intelligence considers its time zone as UTC. You need to turn it into a string to parse it with the correct time zone and get the real date/time in UTC. Once the date/time is in UTC, you can use FormatDate to transform it in the target time zone as previously described.
For example:
- date [TimeParis] = ToDate ( FormatDate ([MyTime]; "dd/MM/yyyy hh:mm:ss") ; "dd/MM/yyyy hh:mm:ss[TIMEZONE:Europe/Paris]")
- string [TimePac] = FormatDate ([TimeParis]; "dd/MM/yyyy hh:mm:ss[TIMEZONE:US/Pacific]")
Web Intelligence: Formula Language⤒
Time Aware Functions
New functions have been added to the Web Intelligence formula language to take advantage of the time dimension:
- input_type OpeningPeriod ( Object measure; Object timePeriod )
Returns the value of the measure for the first date of the time period timePeriod in the current context. - input_type ClosingPeriod ( Object measure; Object timePeriod )
Returns the value of the measure for the last date of the time period timePeriod in the current context. - input_type ParallelPeriod ( Object measure; Object timePeriod; integer offset )
Returns the measure at the date of a period parallel to the dates present in the block in the current context. Selected dates are shifted several intervals either forward or back in time. - input_type PeriodToDate ( Object measure; Object timePeriod; [Sum|Max|Count|Average|Product] )
Returns the running total of the measure measure 's values over the time period timePeriod to date, in the current context. By default, the aggregation is the one of the object, but it can be changed by using one of the keywords Sum, Max, Count, Average or Product.
In the following example, a query retrieves the measure [Sales] and some dates in [Date]. A time dimension for [Date] is created and the following variables are defined:
- [Opening] = OpeningPeriod ( [Sales]; [Date].[Date].[Month of Date] )
- [Closing] = ClosingPeriod ( [Sales]; [Date].[Date].[Month of Date] )
- [Parallel+1] = ParallelPeriod ( [Sales]; [Date].[Date].[Month of Date] ; 1)
- [Period] = PeriodToDate ( [Sales]; [Date].[Date].[Year of Date] )
These variables return the following values:
| [Date].[Date].[Month of Date] | [Sales] | [Opening] | [Closing] | [Paralell+1] | [Paralell-1] | [Period] |
| January | 10 | 10 | 60 | 20 | 10 | |
| February | 20 | 10 | 60 | 30 | 10 | 30 |
| March | 30 | 10 | 60 | 40 | 20 | 60 |
| April | 40 | 10 | 60 | 50 | 30 | 100 |
| May | 50 | 10 | 60 | 60 | 40 | 150 |
| June | 60 | 10 | 60 | 50 | 120 |
Custom Properties
Using the OpenDocument URL, you can set some custom properties in the document. New functions are available in the formula language to retrieve these custom properties and use them in your formulas:
- string CustomProperties ()
Returns the list of custom properties defined in the document. - string CustomPropertyValue ( string Property )
Returns the value of the custom property named Property. If this custom property does not exist, the function returns an empty string.
For example, if you add the "&cpLine=Monitor&cpColor=Black" string to an OpenDocument URL that opens a Web Intelligence document, the following formulas can be used in this document to return its custom properties:
- CustomProperties () returns "Line;Color".
- CustomPropertyValue ("Line") returns "Monitor".
- CustomPropertyValue ("Color") returns "Black".
Data Provider Properties
New auto-documentation functions have been added to provide additional details on the document’s data sources:
- string DataSourceName ( DataProvider dp | Object obj )
- string DataSourceDescription ( DataProvider dp | Object obj )
- string DataSourcePath ( DataProvider dp | Object obj )
- string DataSourceParentFolder ( DataProvider dp | Object obj )
- string DataSourceLocationType ( DataProvider dp | Object obj )
- string QueryName ( DataProvider dp | Object obj )
With:
- dp: the name of a data provider.
- obj: the name of an object.
The DataSource functions return a data source’s name, description, full path, parent folder and location type respectively. To get these values, you need to first refresh the document since they are retrieved and stored in the document when it is refreshed.QueryName returns the name of a query.
You may use:
- DataSourceName instead of UniverseName, since UniverseName does not return consistent values for non-universe data sources.
- QueryName and DataSourceName instead of DataProvider, since DataProvider returns both the query name and the data source name.
UserResponse
New parameters have been added to the UserResponse function to modify the default strings used to separate prompts’ answers:
- string UserResponse ( [Data provider dp;] string prompt_string [;Index] [;string multi_separator] )
- string UserResponse ( [Data provider dp;] string prompt_string [;Index] [;string multi_separator|DefaultSeparator; string between_separator] )
In which:
- multi_separator is a string used to separate the different answers of a prompt’s answer or of a prompt’s complex answer (if the query is based on SAP BW). By default, it is ";".
- between_separator is a string used to separate the two values of a prompt’s range. By default, this separator is "-". To change it without changing the multiple values separator, you can pass the keyword DefaultSeparator for the multi_separator parameter.
Web Intelligence: Hyperlinks and OpenDocument⤒
OpenDocument Custom Properties
When using the OpenDocument URL to open a Web Intelligence document, you can pass one or several custom properties and their corresponding values. These custom properties can then be retrieved through the Web Intelligence formula language (CustomProperties and CustomPropertyValue), allowing you to customize and control the document content when opening it.
The syntax to pass a custom property in the OpenDocument URL is:
"cp<CustomPropertyName>=<Value>"
In which:
- CustomPropertyName is the name of the custom property.
- Value is the value to assign to this custom property.
If the custom property does not exist in the document, it is created. For example, adding the string "&cpLine=Monitor&cpColor=Black" to an OpenDocument URL creates two custom properties in the document (if they do not yet exist):
- "Line", the value of which is "Monitor".
- "Color", the value of which is "Black".
If the custom property already exists, its value is replaced by the new value passed in the OpenDocument URL.
These changes are not persisted in the document if you do not save it.
In the Hyperlink dialog box, when parsing an OpenDocument URL that contains a custom property definition, this custom property is listed in a dedicated section.

Custom Properties in Hyperlink Dialog Box
Intra-Document Link: Input Controls
Since SAP BI 4.3 SP3, you can set values for list or text field input controls during the intra-document link definition process. In SAP BI 4.3 SP4, you can also set these values for spinner, slider and double slider input controls.
In the Hyperlink dialog box, you can select these input controls and assign some values to them, values that you want to be set when the intra-document link is clicked. For each input control, the operator, minimal and maximal values are displayed. For a double slider, you must set two values.

Intra-Document Link: New Supported Input Controls
Authorize URL
Due to the growing number of security threats, the use of hyperlinks is prevented in Web Intelligence by default to avoid links that potentially open malicious locations or trigger unwanted actions. From SAP BI 4.3 SP4 on, administrators must explicitly authorize all URLs used in Web Intelligence for:
- Clickable hyperlinks in the document (Request 292564).
- Clickable hyperlinks in prompt hint.
- Background pictures referenced through URLs.
- OData data sources.
These URLs must be authorized in the CMC, in Web Intelligence application > Properties > Authorized URLs page. This page was already used in previous versions to authorize URLs for custom elements and extensions. In SAP BI 4.3 SP4, a URL listed on this page is also authorized for hyperlinks in the document, as well as prompt hints, pictures and OData data sources.

Authorized URLs Page
To authorize a new URL, click the Add new URL button in the toolbar. In the Add URL dialog box, add the new authorized URL in the Authorized URL text field. This URL must contain the authorized protocol (http or https) and port. If this URL is used for a custom element or an extension, you can also enter a proxy server and port.

Add URL Page
You can enable all hyperlinks by typing the "*" character in the Authorized URL text field. It is a shortcut to authorizing all URLs for hyperlinks, OData data sources and pictures referenced by an URL. However, this character does not work for custom elements or extensions, for which the corresponding URLs must be explicitly entered. If you enter this character, a warning message is displayed, and you must confirm that you understand the potential risks.

Authorized URLs Shortcut Confirmation
When you upgrade to SAP BI 4.3 SP4, URLs used in your documents will no longer work, unless you authorize them in the CMC, either explicitly or through the "*" shortcut. This also includes some samples provided in the Public Folders/Web Intelligence Samples folder that reference https://services.odata.org/ and https://blogs.sap.com/.
If you enable hyperlinks, JavaScript, and HTML elements, in the Web Intelligence application > Properties dialog box of the CMC, a warning message is displayed, and you must confirm that you understand the associated potential risks.

Enable Hyperlinks, JavaScript, and All HTML Elements Confirmation Confirmation
Web Intelligence: Usability Enhancements⤒
Copy Paste
If you are connected through HTTPS or if you are using the Rich Client, you can copy the content of a table or chart and paste it into the Operating System’s clipboard.
In Reading mode, select a table or a chart and copy it by clicking the Copy button in the floating toolbar.
In Design mode, select a table or a chart and copy it by clicking Content > Copy from the context menu.
If you copy a table and paste it into another tool that supports Rich Text, then the table is added with its formatting and borders. If you paste it into a simpler text editor like Notepad, a plain text version is used. Its format (column separators, text qualifiers, charset) is defined in the options set in the Export to dialog box when exporting to CSV and saved in the user settings.
Both the selected cells and their headers are copied into the clipboard, but the copy cannot exceed 25,000 cells.
If you copy a chart, a picture generated from this chart can be pasted into tools that support pictures (Request 265822).
Side Panel
The following usability changes have been made in the side panels:
- In Design mode, in the Main > Objects tab:
- When you type a string in the Search text field, not only the objects or variables containing this pattern in their name are displayed, but also the variables containing a formula with the typed pattern. You can hover your mouse over this object to display a tooltip with the variable’s formula, the typed pattern of which is highlighted.
You can click Search in variable’s formula from the context menu of an object, to display only the variables that use this object in their formulas. These two methods can be used to find the variables using an object (Request 295520).
- The Expand All and Collapse All buttons can be used to fold and unfold all folders.
- When multi-selecting several variables and/or references and/or calendars, the context menu contains the Delete command to allow you to delete all of them in one go.
- When multi-selecting several merged objects, the context menu offers the Unmerge command to allow you to unmerge all these objects at the same time (Request 126531).
- When hovering the mouse over a grouping variable, the object on which the grouping variable is based is displayed in the tooltip.

Search in Variable Formula
- When you type a string in the Search text field, not only the objects or variables containing this pattern in their name are displayed, but also the variables containing a formula with the typed pattern. You can hover your mouse over this object to display a tooltip with the variable’s formula, the typed pattern of which is highlighted.
- In the Main > Report Structure tab, the toolbar contains:
- A Search text field, to find a report element by name.
- An Expand All and Collapse All buttons to fold and unfold the report structure.
- An Alphabetically order toggle button to sort report elements alphabetically or by order of creation (Request 267920).
- In the Main > Navigation Map tab, sections and subsections are displayed as a tree list and no longer as panels.
- The Main > Properties tab displays the same parameters in any mode (Reading, Design, Data). It also displays the document ID and CUID (Request 293004).
- In the Build > Formats tab, the interspace between parameters is reduced to display more of them in the same panel.
- In the Build > Layout tab, when defining a relative position, the report elements are sorted alphabetically (Request 120420).
Filter Bar and Input Control
To save space in the Filter Bar, the button to display the Prompts Summary dialog box contains an icon (
) rather than the full name Prompts. Hovering the mouse over this icon opens a tooltip that contains this Prompts Summary.Hovering the mouse over an input control displayed in this Filter Bar also opens a tooltip with the selected value(s).
When editing an input control, the icon of the object type (dimension, measure, detail) is displayed beside the object name. Hovering the mouse over this object displays a tooltip with the object’s description.
Custom Elements
In addition to the ability to maximize a custom element in Reading mode, the following changes have been made in Design mode for custom elements:
- The context menu of a custom element displays a couple of shortcuts to access the custom element’s custom properties tab.
- The categories of custom elements parameters can be expanded and collapsed in the Build > Format > Extended Parameters tab.
- When modifying a text or numeric value of a custom element’s parameter, the value is no longer sent to the server each time a key is pressed.
Setting Toggles in the CMC
Web Intelligence leverages toggles to enable preview features or modify default behaviors. These toggles are documented in SAP Notes.
To simplify the use of these toggles, you can set them in the CMC:
- Log into the CMC and open the Web Intelligence > Properties page from the Applications page.
- Scroll down to the bottom of the page to reach the Feature Toggles section.
- Enter a list of toggles to enable features that are disabled by default. You must use a JSON-format list, for example: {"toggle1": "value1", "toggle2": "value2"}
- You may click the button () to format the JSON list.

Web Intelligence Toggles in the CMC
By setting toggles in the CMC, you need to set them only once. These toggles are kept when you install a patch or upgrade to a newer version.
Miscellaneous
- When closing the document without having saved it, a warning dialog box offers you to do so.
- When you try and save an open instance of a document, a tooltip displayed when hovering the mouse over the Save button warns you that it is not possible to save a modified instance.
- In Reading mode, you can right-click a cell containing a hyperlink that has been previously authorized in the CMC. In the floating toolbar, select the Copy hyperlink URL to the clipboard button (
 ) to copy this URL into the Operating System clipboard (Request 284713).
 - In Reading mode, click the Pin button (
 ) on the vanishing toolbar to permanently display this toolbar (Request 299817). This permanent display can also be set through the [Ctrl] + [Alt] + [F7] shortcut. This choice is saved and reused in your next session.
 - In Design mode, you can right-click a cell and select Content > Edit content from the context menu. The cell content is opened in the Formula Editor. The associated shortcut for this action is [Ctr] + [Shift] + [E].
- In the Formula Editor, the Expand All and Collapse All buttons are displayed at the top right of the Objects, Functions and Operators side panels to expand or collapse these tree lists.
- You do not need to explicitly open the dropdown menu beside the Insert table, Insert chart or Insert cell buttons in the toolbar to pick a specific table, chart or cell to be added to the document. You can simply click the Insert table or Insert chart button and click in the document to add the same table or chart type you last inserted. To insert a blank cell, just click the Insert cell button, followed by a clickin the document and a blank cell appears in your document.
- When adding a predefined Summary cell (QuerySummary, PromptSummary and FilterSummary), the cell content appears left justified.

Close Document Confirmation
Web Intelligence: Customization⤒
The following customization items can now be set in the CMC to hide features from the Web Intelligence interface:
- Location > Microsoft OneDrive: To remove Microsoft OneDrive from the list of data sources’ locations (Request 304941).
- Data Source > SAP Datasphere: To remove SAP Datasphere from the list of data sources.
- Query > Change Source: To remove the Change Source command from the toolbar.
- Data > Combine Cubes: To remove all features allowing cube combinations in Data mode.
- Analysis > Track Data Changes: To remove both the Show changes and Track data changes commands from the toolbar.
- Document > New: To remove the New button from the toolbar (Request 298161).
- Document > Open: To remove the Open button from the toolbar (Request 298161).
- Document > Save: To remove the Save button from the toolbar.
- Document > Favorites: To remove the Mark as favorite / Remove from favorites button from the toolbar.
- Document > Presentation Mode: To remove the Presentation mode button from the toolbar.
Web Intelligence: SDK⤒
Web Intelligence OData Services
When you retrieve data from a document report element or cube through OData, you can first refresh the document before returning the dataflow. To do so, add the following parameter to the OData URL.
sap_refreshdata=true
If the document contains prompts, you can also answer them by adding the following parameter to the OData URL:
sap_user_prompt=(<answeredPrompt1>,<answeredPrompt2>,<answeredPrompt3>,…)
The syntax of an answered prompt is:
- PromptID%20in%20(<value1>)
To pass one value to the prompt.
- PromptID%20in%20(<value1>,<value2>)
To pass two values to the prompt. The prompt can be a multi-value prompt or use a between operator that expects two operands.
- PromptID%20in%20(<value1>,<value2>,<value3>)
To pass more than two values to the prompt.
String values must be passed between quotes and prompt identifiers can be retrieved by using the /$metadata call, under the "prompts" EntityType.
For example, adding the following string to an OData URL that queries a Web Intelligence document:
?sap_refreshdata=true&sap_user_prompt=(p_x005F_Year%20in%20(2025), p_x005F_Months%20in%20("April","August"),p_x005F_Countries%20in%20("US","France","Germany"))
refreshes this document and answers the following prompts:
- "Year:" with value 2025.
- "Month:" with the values April and August.
- "Countries:" with the values US, France and Germany.
Web Intelligence JavaScript API
New methods are introduced in the JavaScript API that can be used for Web Intelligence extensions and custom elements.
The WebiServices.document namespace contains new methods to manage document input controls:
- (static) createDocumentInputControl ( obj )
To create a document input control. - (static) updateDocumentInputControl ( obj )
To update a document input control. - (static) deleteDocumentInputControl ( obj )
To delete a document input control. - (static) getDocumentInputControl ( obj )
To retrieve a document input control details. - (static) getDocumentInputControls ( obj )
To retrieve the document input controls. - (static) getDocumentInputControlLov ( obj )
To retrieve the list of values of a document input control. - (static) setDocumentInputControlSelection ( obj )
To answer the selected values of a document input control - (static) deleteDocumentInputControlSelection ( obj )
To reset the selected values of a document input control.
In all these methods, obj is an Object representing the document input control. The document is implicitly the one for which the method is used.
In the WebiServices.document namespace, new methods are introduced to get the details of an object and the object’s list of values:
- (static) getDocumentDataObject ( obj )
- (static) getDocumentDataObjectLov ( obj )
In the WebiApplication.Events namespace, you will find the following new events:
- SAVE_DOCUMENT_AS: returning the new document’s name and ID.
- SAVE_DOCUMENT: returning the document’s ID.
An event bus is available to exchange data between Web Intelligence extensions and custom elements. In the WebiApplication.eventBus namespace, the methods that leverage this event bus are:
- (static) subscribe ( obj )
To subscribe to a specific channel and a specific event on this channel. - (static) unsubscribe ( obj )
To unsubscribe from a specific channel and a specific event on this channel. - (static) publish ( obj )
To publish an event on a specific channel. Any custom element or extension that has subscribed to this channel and to this event will receive it.
Semantic Layer: Data Sources⤒
New Supported Data Sources
In addition to the data sources supported in previous releases, the following additional data sources have been added to the SAP BI 4.3 Product Availability Matrix:
- DataBricks (JDBC) (Request 284339)
- SAP HANA Cloud, data lake (ODBC)
New versions of the following data sources are also supported:
- Informix 14 (JDBC/ODBC)
- MapR MEP 8 (JDBC/ODBC)
- PostgreSQL 15 (JDBC/ODBC)
- HP Vertica 12(JDBC/ODBC)
- Microsoft SQL Server 2022 (JDBC/ODBC/OLEDB)
- SAP HANA 2 SP7 (JDBC/ODBC)
- SAP BW 7.5 SPS27 (BICS)
- SAP BW/4HANA 2.0 SP13 (BICS)
- SAP BW/4HANA 2021 SP06 (BICS)
- SAP S/4HANA 1709 SP12 (BICS)
- SAP S/4HANA 1809 SP10 (BICS)
- SAP S/4HANA 1909 SP08 (BICS)
- SAP S/4HANA 2020 SP06 (BICS)
- SAP S/4HANA 2021 SP04 (BICS)
- SAP S/4HANA 2022 SP0 (BICS)
SAP Datasphere
Since SAP BI 4.3, SAP Datasphere is supported under the name SAP Data Warehouse Cloud through relational connections (JDBC and ODBC drivers) and universes created in Information Design Tool.
In SAP BI 4.3 SP4, the SAP BICS driver can also be used to access SAP Datasphere through:
- Web Intelligence Direct Access
- Multidimensional universes created in Information Design Tool
This BICS driver allows you to query and leverage multidimensional features of any SAP Datasphere models: analytic models, perspectives, analytical datasets…
When creating the OLAP connection to SAP Datasphere in Information Design Tool or in the CMC, the only supported authentication mode is Single Sign-On via OAuth 2.0, which requires to configure OAuth in the CMC.
Semantic Layer: Information Design Tool⤒
In addition to the support of UNX universes by Crystal Reports 2020, the following new features are also available in SAP BI 4.3 SP4 in Information Design Tool.
Allow Neutral Joins
To reduce the size of very large universes, you can set their data foundations to support only included and excluded joins, rather than included, excluded and neutral joins. Indeed, in the first case, only the included joins are saved in the data foundation whereas in the second case, both included and excluded joins must be saved.
To change this parameter, select the root of the data foundation outline tree in the data foundation editor, to display the properties panel. Select the SQL Options tab and unselect the Allow neutral joins checkbox.

Data Foundation Allow Neutral Joins Parameter
If your data foundation already contains neutral joins, you cannot change this parameter and must first turn these neutral joins into included or excluded joins.
Once this parameter is disabled:
- It is no longer possible to create neutral joins, even if you select the New joins will be added to the existing contexts as Neutral in the Information Design Tool’s Preferences dialog box.
- The ALLOW_NEUTRAL_JOINS parameter you can define in the data foundation’s Query Script Parameters is ignored.
Later, you can reactivate this parameter.
This parameter does not change the resulting queries, but it may reduce the time to generate them. This improvement can only be noticed with very large data foundations.
Universe Conversion
When converting a universe created in Universe Design Tool, the data foundation is generated with the Allow neutral joins parameter being disabled. For very large universes, this reduces the number of joins stored in the data foundation and the converted universe is like the original one with included joins only.
In the Convert .unv Universe dialog box, when converting several universes, errors do not block the conversion of other any longer. Error messages, if any, are displayed in the Status column.
Export Translation ID
When exporting a business layer into a PDF, HTML or Text format, you can save the objects’ translation ID as well. These translation IDs are used in Translation Management Tool to identify these objects in the XLIFF files.
In the Export As dialog box, select the Translation ID checkbox before validating the export.

Export As Translation ID
Usability Enhancements
To copy tables and joins between data foundations, you can use:
- The lasso to select the tables, joins and comments.
- The [Ctrl]+[A] shortcut to copy all the data foundation content.
- The [Shift] key + click to unselect selected content.
The copy keeps the objects’ positioning and tables state (Collapsed, Joins only, Expanded). The copied tables and joins remain selected after the copy.
Semantic Layer: Java SDK⤒
In the Semantic Layer Java SDK, two new methods are added to define if the data foundation can support neutral joins:
- boolean DataFoundation::isAllowNeutralJoins ();
- void DataFoundation::setAllowNeutralJoins ( boolean value );
Two further methods are added to set and get an object’s Database Format property:
- String BusinessObjects::getDatabaseFormat ();
- void BusinessObjects::setDatabaseFormat ( String value );
Labels:
12 Comments
You must be a registered user to add a comment. If you've already registered, sign in. Otherwise, register and sign in.
Labels in this area
-
ABAP CDS Views - CDC (Change Data Capture)
2 -
AI
1 -
Analyze Workload Data
1 -
BTP
1 -
Business and IT Integration
2 -
Business application stu
1 -
Business Technology Platform
1 -
Business Trends
1,658 -
Business Trends
93 -
CAP
1 -
cf
1 -
Cloud Foundry
1 -
Confluent
1 -
Customer COE Basics and Fundamentals
1 -
Customer COE Latest and Greatest
3 -
Customer Data Browser app
1 -
Data Analysis Tool
1 -
data migration
1 -
data transfer
1 -
Datasphere
2 -
Event Information
1,400 -
Event Information
67 -
Expert
1 -
Expert Insights
177 -
Expert Insights
301 -
General
1 -
Google cloud
1 -
Google Next'24
1 -
GraphQL
1 -
Kafka
1 -
Life at SAP
780 -
Life at SAP
13 -
Migrate your Data App
1 -
MTA
1 -
Network Performance Analysis
1 -
NodeJS
1 -
PDF
1 -
POC
1 -
Product Updates
4,577 -
Product Updates
346 -
Replication Flow
1 -
REST API
1 -
RisewithSAP
1 -
SAP BTP
1 -
SAP BTP Cloud Foundry
1 -
SAP Cloud ALM
1 -
SAP Cloud Application Programming Model
1 -
SAP Datasphere
2 -
SAP S4HANA Cloud
1 -
SAP S4HANA Migration Cockpit
1 -
Technology Updates
6,873 -
Technology Updates
429 -
Workload Fluctuations
1
Related Content
- Exploring Integration Options in SAP Datasphere with the focus on using SAP extractors - Part II in Technology Blogs by SAP
- Unify your process and task mining insights: How SAP UEM by Knoa integrates with SAP Signavio in Technology Blogs by SAP
- 10+ ways to reshape your SAP landscape with SAP BTP - Blog 4 Interview in Technology Blogs by SAP
- 10+ ways to reshape your SAP landscape with SAP Business Technology Platform – Blog 4 in Technology Blogs by SAP
- Experiencing Embeddings with the First Baby Step in Technology Blogs by Members
Top kudoed authors
| User | Count |
|---|---|
| 34 | |
| 17 | |
| 15 | |
| 14 | |
| 11 | |
| 9 | |
| 8 | |
| 8 | |
| 8 | |
| 7 |