
- SAP Community
- Products and Technology
- Technology
- Technology Blogs by SAP
- Capture Your Own Workload Statistics in the ABAP E...
- Subscribe to RSS Feed
- Mark as New
- Mark as Read
- Bookmark
- Subscribe
- Printer Friendly Page
- Report Inappropriate Content
As an administrator in SAP BTP, ABAP environment or in SAP S/4HANA Cloud ABAP Environment, it’s important to keep track of performance issues and identify bottlenecks. Now SAP offers a few Fiori apps to help you with monitoring the system workload. However, relying on what data the system automatically collects for you sometimes isn’t enough.
Instead, you want to define yourself what kind of workload information is captured, such as in the following use cases:
- Standard apps and tools show you that there’s a high workload, but when you drill down to details, you don’t get the information you’re interested in.
- You want to monitor the workload of a clearly defined special case, such as the workload generated by a user or by one of your custom apps (which you might want to watch using its request entry point).
- You have specific requests where you want to get alerted when the workload, for example, exceeds a defined threshold.
In this blog post, I’ll show you how to use the Capture Request Statistics app to cover these use cases.
Background: the System Workload App
Before I introduce you to the Capture Request Statistics app, let me start with a brief recap of what the System Workload app can do for you out of the box (for more details, see the blog post Analyzing performance degradations in the ABAP environment in the Cloud).
Let’s say you want to analyze the performance of your ABAP system in the System Workload app:
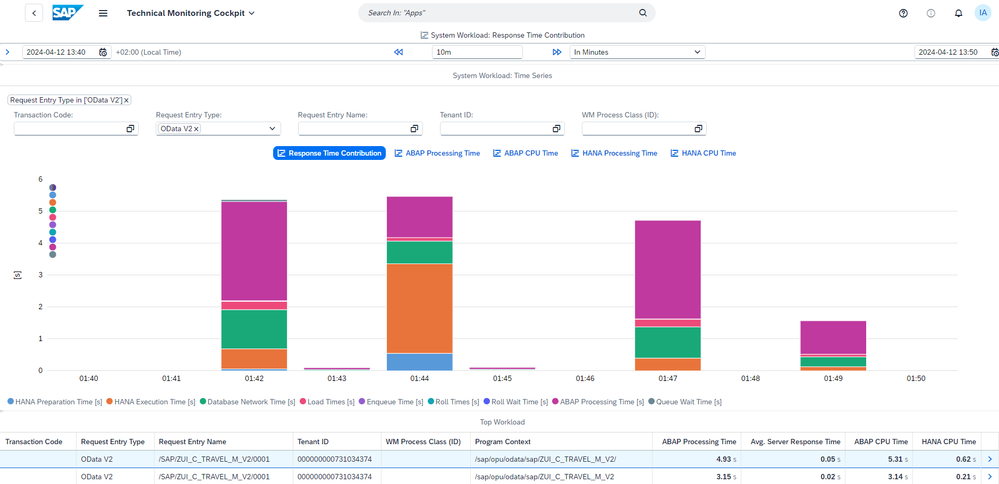
You find the top resource-consuming application in the system and want to analyze it further. You can analyze this application in more detail by choosing the Details arrow at the end of the row. In the following screen, you typically find samples of single ABAP statistics records for this workload. Now, how are these ABAP statistics records collected by default and how can you influence what is captured? Let's take a look behind the scenes.
Default Configuration: Capture Workload Statistics with Static Thresholds
An ABAP Environment in the Cloud comes with pre-delivered SAP profiles that capture ABAP statistics records in your system. You can find these pre-delivered SAP profiles in the Capture Request Statistics app:
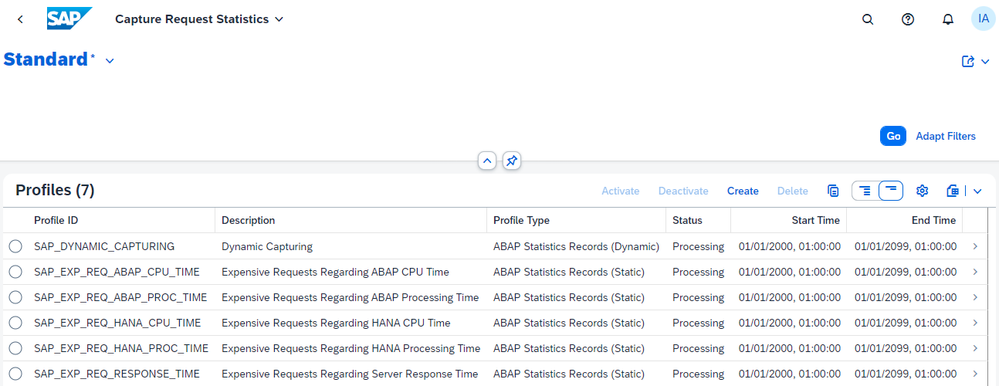
These profiles ensure that the statistics about “bad” requests - meaning a high consumption of compute resources – are captured in the system. If you look, for example, at the details of the static profile for expensive requests regarding server response time, you find a static threshold of 1 second:

With this profile always active, ABAP statistics records with an ABAP server response time larger than 1 second are captured and stored. Similarly, the other pre-delivered static profiles capture requests that exceed 1 second regarding HANA CPU time, ABAP CPU time, etc.
In the profile header, you can find that for the SAP-delivered profiles, a sampling rate of 1% has been set. It means that only 1% of the records that fulfill the filter condition will be captured. In addition, the record limit per minute is set to 50. The periodic data collector that runs every minute and processes the ABAP statistics records (together with the profiles in the Capture Request Statistics app) will only store the ABAP statistics records up to this limit in the database. So, if many ABAP statistics records fulfill the filter condition at a time, not all of these records will be stored.
For SAP-delivered profiles, this low record limit per minute together with the low sampling rate ensures that the workload and data footprint for processing and storing monitoring data in your system stay low, even if the overall business workload on the system gets exceedingly high.
Default Configuration: Capture Workload Statistics Dynamically
In addition to the pre-delivered static profiles, the dynamic SAP profile SAP_DYNAMIC_CAPTURING ensures that for the top workload of your system “good” statistic samples of requests are also captured (with respect to the server response time). As a result, you can compare statistics of samples of “bad” workload to statistics of samples of “good” workload. The top workload in your system might vary as well as the behavior in response times. The dynamic profile adapts to these changes.
In addition, for the top workload, the dynamic profile captures samples of ABAP statistics when their server response times deviate too much from the average server response time of this specific kind of workload. This ensures that for workloads with typically different server response times, samples of ABAP statistics records are also at hand, even if their server response times do not exceed the static thresholds of the static profile types.
In principle, the pre-delivered static profiles together with the dynamic profile will give you a high chance that for your top workload, you’ll find samples of ABAP statistics records in the system that you can use for detailed analysis. You get this data using the System Workload app and by drilling down to the ABAP statistics records, and in most of the cases, that’s enough. However, as these statistics are sampled, it might happen that sometimes you don't find any records that you can use for further analysis:
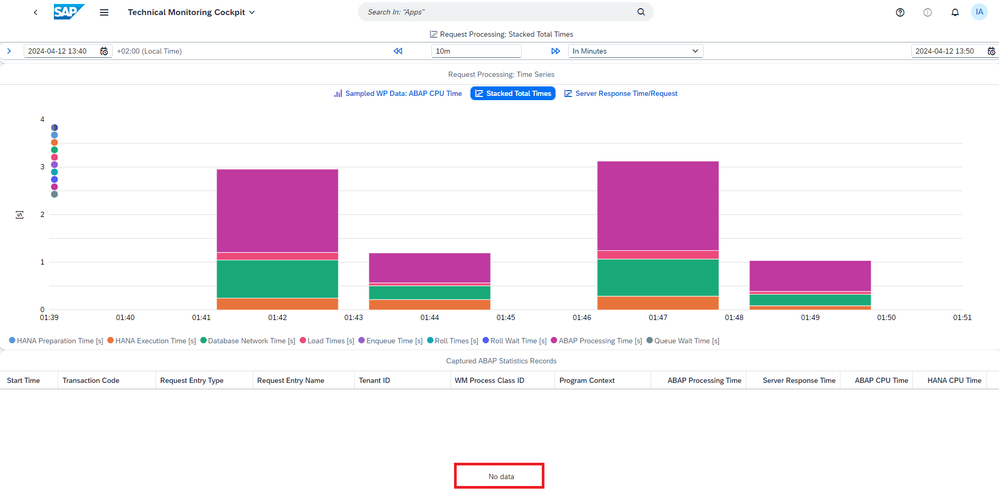
To have these detailed statistics for your root cause analysis, you can capture your own workload statistics in your ABAP environment in the Cloud.
Capture Your Own Workload Statistics in the Capture Request Statistics App
You can create your own capture profiles, of course. While the SAP profiles are designed in such a way that they capture samples of ABAP statistics records for generic expensive workload in the ABAP tenant, you might want to specify the workload more concretely. For example, you might be interested specifically in the ABAP statistics records of your user or of a certain outbound communication arrangement. Or you might be interested in workload that exceeds a specific threshold (as in the pre-delivered SAP profiles). To do so, you can create your own capture profile.
If, for example, you have built a new ABAP RESTful application for travel bookings, you could define a profile that filters on its specific request entry point (consisting of request entry name and request entry type):

A custom profile is in status Inactive when newly created. If you click on the Activate button, the profile status will be set to status Processing, and only then will the data collector process ABAP statistics records that fulfill the defined filter conditions. On activation of the profile, you also need to specify the duration of how long the profile should be active. When the duration is exceeded and all the relevant ABAP statistics records are processed, the profile will be set to status Finished and no further ABAP statistics records will be processed for this profile.
In the example profile shown here, a sampling rate of 100% and a record limit per minute of 1000 has been set. Both are the maximum possible values. This setting guarantees that all ABAP statistics records fulfilling the filter conditions are captured. Of course, if the record limit of 1000 is exceeded, you won’t capture everything. But this happens only in rare cases. In any case, it’s ensured that also for a badly designed capture profile, your business is not impacted by the additional workload of capturing request statistics.
The target user group in the profile header indicates that only workload is considered that is running in customer user context. You can specify this further by considering, for example, only customer communication users or customer business users.
If the profile is active and users are performing actions in your ABAP RESTful application, the according ABAP statistics records are captured and stored in the database for a period that you have defined in the retention time of your profile.
For further analysis, e.g., the performance of a new app that you have built, you can navigate to the captured ABAP statistics records by clicking on Analyze Request Statistics. There you can analyze the captured single ABAP statistics records in detail and obtain insights into the behavior of your newly created app:
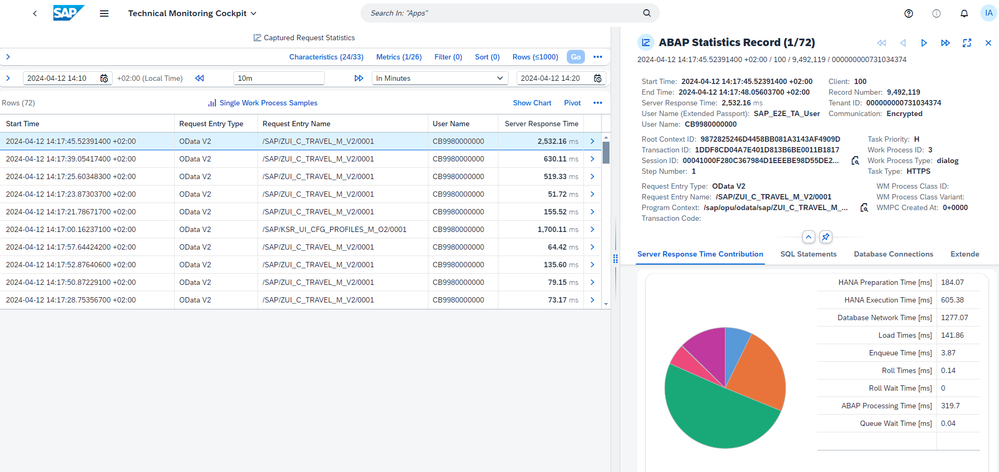
You can find more information, for example, about SQL statements or, in the case of communication, about HTTP calls by choosing the Details arrow at the end of a row, which leads you to the details of that ABAP statistics record.
If your new application belongs to the more expensive workload in the system, you’ll easily find the captured ABAP statistics records also in the System Workload app. There, you start from the overall workload (aggregated ABAP statistics records) of your business tenants. If you drill down to the details of your application, you will get to the ABAP statistics records. Your custom profile ensures that they have been captured:
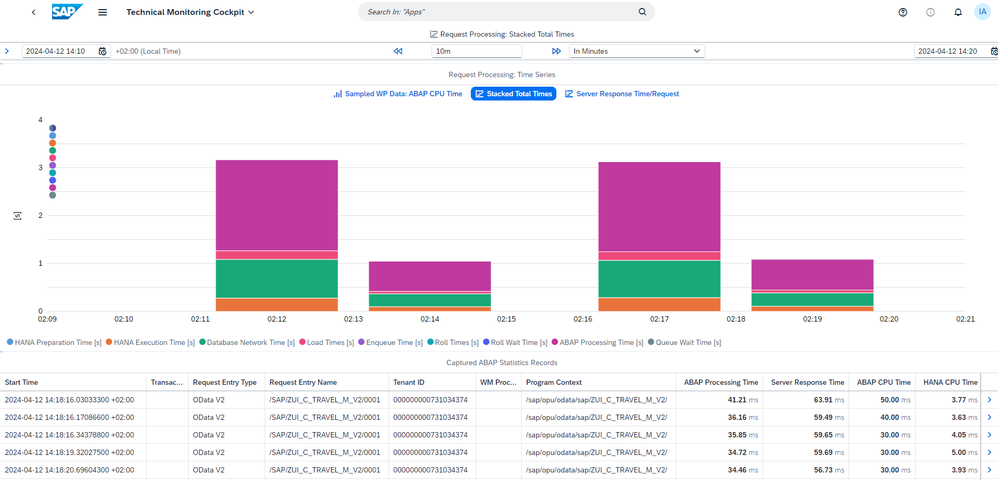
Note: With the Capture Request Statistics app, you can also define profiles with profile type SQL Trace. With these profiles, you can trace the execution of SQL statements. These captured SQL statements can be further analyzed in the SQL Trace Analysis app. This might be another story for another blog post in the future, so stay tuned.
You can find more information about the Capture Request Statistics app in the following documentation:
- Capturing Request Statistics for SAP BTP, ABAP environment
- Capturing Request Statistics for SAP S/4HANA Cloud ABAP Environment
Getting Notified About Specific Workloads
You may have noticed that by defining a custom capture profile for capturing ABAP statistics records, you can set the option for Health Monitoring. If you have connected your SAP BTP, ABAP environment or SAP S/4HANA Cloud ABAP Environment tenant to SAP Cloud ALM, you’ll receive a counter per capture request statistics profile in SAP Cloud ALM for Operations in the Health Monitoring app. You can find more information on how to connect your tenant to SAP Cloud ALM here:
- Monitor An SAP BTP ABAP Environment Service Using SAP Cloud ALM (CALM)
- Setup for SAP S/4HANA Public Cloud Edition
For our custom profile example Z_STATIC_PROFILE, you’ll find the tile Captured ABAP Statistics Records in the Health Monitoring app in your connected SAP Cloud ALM tenant. If you click on the tile for details, you find your custom profile together with a counter
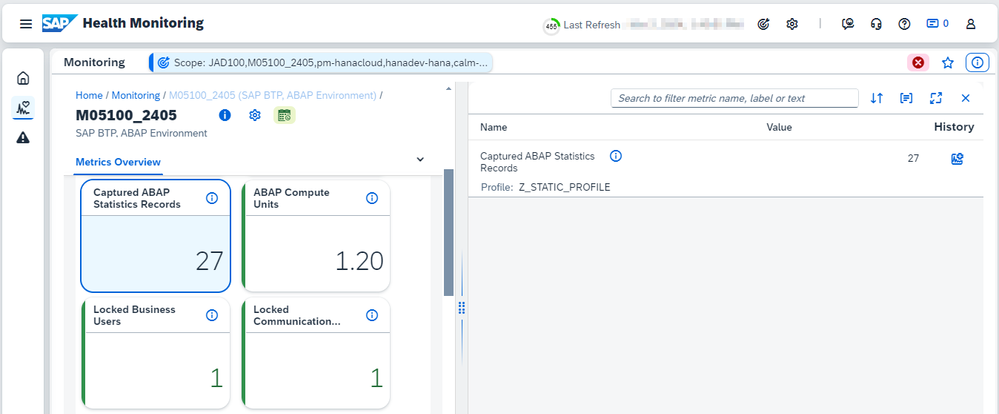
This counter is normalized to 5 minutes. This means that during the last 5 minutes, 27 ABAP statistics records were captured in your ABAP tenant that fulfill the filter conditions that you have defined in your custom profile. Besides this usage scenario, you can also use the Health Monitoring feature on capture profiles with static thresholds (like in the case of the pre-delivered static SAP profiles) to count how often your defined thresholds are exceeded. For more information, see also the blog post Monitoring the Performance of Outbound Communication in the ABAP Environment in the Cloud.
If you want to get alerted by email when the filter conditions of your profile are hit a certain number of times, you can configure alerts in SAP Cloud ALM in the Health Monitoring app. For more information, see the blog post Monitoring the Health of the ABAP System in the Cloud.
Summary
The default configuration of your SAP BTP, ABAP environment or SAP S/4HANA Cloud ABAP Environment tenant comes with pre-delivered SAP profiles that capture ABAP statistics records for the most important workload in your system. This helps you analyze and understand your system workload in detail.
However, if you want to enhance this default configuration, you can do so by creating your own profiles using the Capture Request Statistics app. The monitoring data collector ensures that requests that fulfill your filter conditions are captured and stored in the system for further analysis. You can define profiles for capturing ABAP statistics records and for capturing SQL statements.
Let’s quickly recap in which use cases creating your own profiles in the Capture Request Statistics app is useful:
- In your standard system-local analysis of the system behavior, detailed statistics are missing for a certain workload that you need to have at hand.
- You want to proactively capture extensive details for a workload of your choice to analyze it in detail.
- In SAP Cloud ALM, you want to understand how often your workload in the landscape hits certain criteria (= your filter conditions defined in the profiles), and you want to get alerted in this case
I’d like to thank everyone who contributed to this blog post, especially my colleagues @anke_griesbaum, @Karen_Kuck, @SabineReich, and @steffen_siegmund.
Let me know in the comments if and how you’ve used the Capture Request Statistics app and what you think of it.
You must be a registered user to add a comment. If you've already registered, sign in. Otherwise, register and sign in.
-
ABAP CDS Views - CDC (Change Data Capture)
2 -
AI
1 -
Analyze Workload Data
1 -
BTP
1 -
Business and IT Integration
2 -
Business application stu
1 -
Business Technology Platform
1 -
Business Trends
1,658 -
Business Trends
95 -
CAP
1 -
cf
1 -
Cloud Foundry
1 -
Confluent
1 -
Customer COE Basics and Fundamentals
1 -
Customer COE Latest and Greatest
3 -
Customer Data Browser app
1 -
Data Analysis Tool
1 -
data migration
1 -
data transfer
1 -
Datasphere
2 -
Event Information
1,400 -
Event Information
67 -
Expert
1 -
Expert Insights
177 -
Expert Insights
310 -
General
1 -
Google cloud
1 -
Google Next'24
1 -
GraphQL
1 -
Kafka
1 -
Life at SAP
780 -
Life at SAP
13 -
Migrate your Data App
1 -
MTA
1 -
Network Performance Analysis
1 -
NodeJS
1 -
PDF
1 -
POC
1 -
Product Updates
4,576 -
Product Updates
353 -
Replication Flow
1 -
REST API
1 -
RisewithSAP
1 -
SAP BTP
1 -
SAP BTP Cloud Foundry
1 -
SAP Cloud ALM
1 -
SAP Cloud Application Programming Model
1 -
SAP Datasphere
2 -
SAP S4HANA Cloud
1 -
SAP S4HANA Migration Cockpit
1 -
Technology Updates
6,873 -
Technology Updates
441 -
Workload Fluctuations
1
- Analyze Expensive ABAP Workload in the Cloud with Work Process Sampling in Technology Blogs by SAP
- SAP Analytics Cloud - Performance statistics and zero records in Technology Blogs by SAP
- Explore Business Continuity Options for SAP workload using AWS Elastic DisasterRecoveryService (DRS) in Technology Blogs by Members
- Part 2:- SAP Basis OS support on SUSE Linux for beginners in Technology Blogs by Members
| User | Count |
|---|---|
| 21 | |
| 14 | |
| 13 | |
| 11 | |
| 10 | |
| 10 | |
| 9 | |
| 9 | |
| 8 | |
| 7 |