
- SAP Community
- Products and Technology
- Technology
- Technology Blogs by SAP
- Analyzing performance degradations in the ABAP env...
Technology Blogs by SAP
Learn how to extend and personalize SAP applications. Follow the SAP technology blog for insights into SAP BTP, ABAP, SAP Analytics Cloud, SAP HANA, and more.
Turn on suggestions
Auto-suggest helps you quickly narrow down your search results by suggesting possible matches as you type.
Showing results for
Advisor
Options
- Subscribe to RSS Feed
- Mark as New
- Mark as Read
- Bookmark
- Subscribe
- Printer Friendly Page
- Report Inappropriate Content
04-24-2023
9:36 AM
As an administrator or developer, you need to keep track of the performance of your own applications in the ABAP environment of SAP BTP. Ideally, you have an app that not only shows you when performance deteriorates, but that also allows you to drill down to the relevant requests and the associated code.
In this blog post, I would like to show you a real-life example of how you can use the System Workload app to analyze a performance degradation. The following scenario was captured during a normal performance regression review of a change in the SQL statement processing for one of my development projects. I had changed a sequence of SQL statements and later checked its impact on performance using this app.
On the SAP Fiori launchpad of the ABAP environment in SAP BTP, I went to the Technical Monitoring area and chose the System Workload app. This app is available for administrator and developer roles. By default, the framework behind the System Workload app collects statistics for expensive requests as well as samples of requests for a wide range of major workloads in the system. So, the app is ready for checking any outliers or increases in system workload.
I wanted to know more, of course, about the top consumer displayed in the details list and therefore chose the little arrow at the end of the row. This led me to a new screen with more details for this workload.
On this screen, the chart gives me an idea of how the chosen workload develops over time, based on aggregated values. In addition, there’s a list of sampled ABAP statistics records, which are the data basis of what is shown in the System Workload app.
Now, what are ABAP statistics records? They provide you with important information about activities that were running on an ABAP system. These statistics are generated by the work processes of the ABAP application server and processed by the framework behind the System Workload app. As a result, you get aggregate values as shown in the chart. In addition, expensive requests and requests based on a sampling rate are collected to cover a wide range of major workloads in the system.
The workload sampling already identified my workload as very frequently executed and calculated the median execution time and classified normal samples and outliers. The sampling is implemented in a way to always capture good and bad samples for comparison.
Thanks to the color-coding, you can conveniently compare single records: Red is for a very high server response time, yellow for higher than normal, and green for a response time within normal range compared to the average server response time for this workload.
Now I drilled down even further and selected first a “good” and then a “bad” sample (as indicated by the color coding) from the list. Choosing an entry from the list led me to another screen with all the details of a single ABAP statistics record.
The following figure shows the ABAP statistics record for the good sample on the left and the bad one on the right:
I already knew I had to focus on the HANA database processing time. It’s the dominant time slice that already showed a regression in the initial screen. So I wasn’t surprised that both pie charts also showed a high database processing time. But it’s much more dominant in the bad sample on the right.
Now on to the SQL statements: For a database workload, the ABAP statistics collector captures the most important SQL statements, so there’s no need for you to enable additional tracing. It’s a very light-weight SQL capturing mechanism that is always on. (For more information, see How Are ABAP Statistics Records Collected?.)
To get to the SQL statements, I simply scroll down on the ABAP Statistics Record Screen to the SQL Statements section.
When I analyzed the two samples, I found similar SQL statements. But the first INSERT SQL statement - see the following figure - had a database processing time of only 8.90 ms in the good sample on the left. In the bad sample, the same SQL statement had a processing time of 480.70 ms.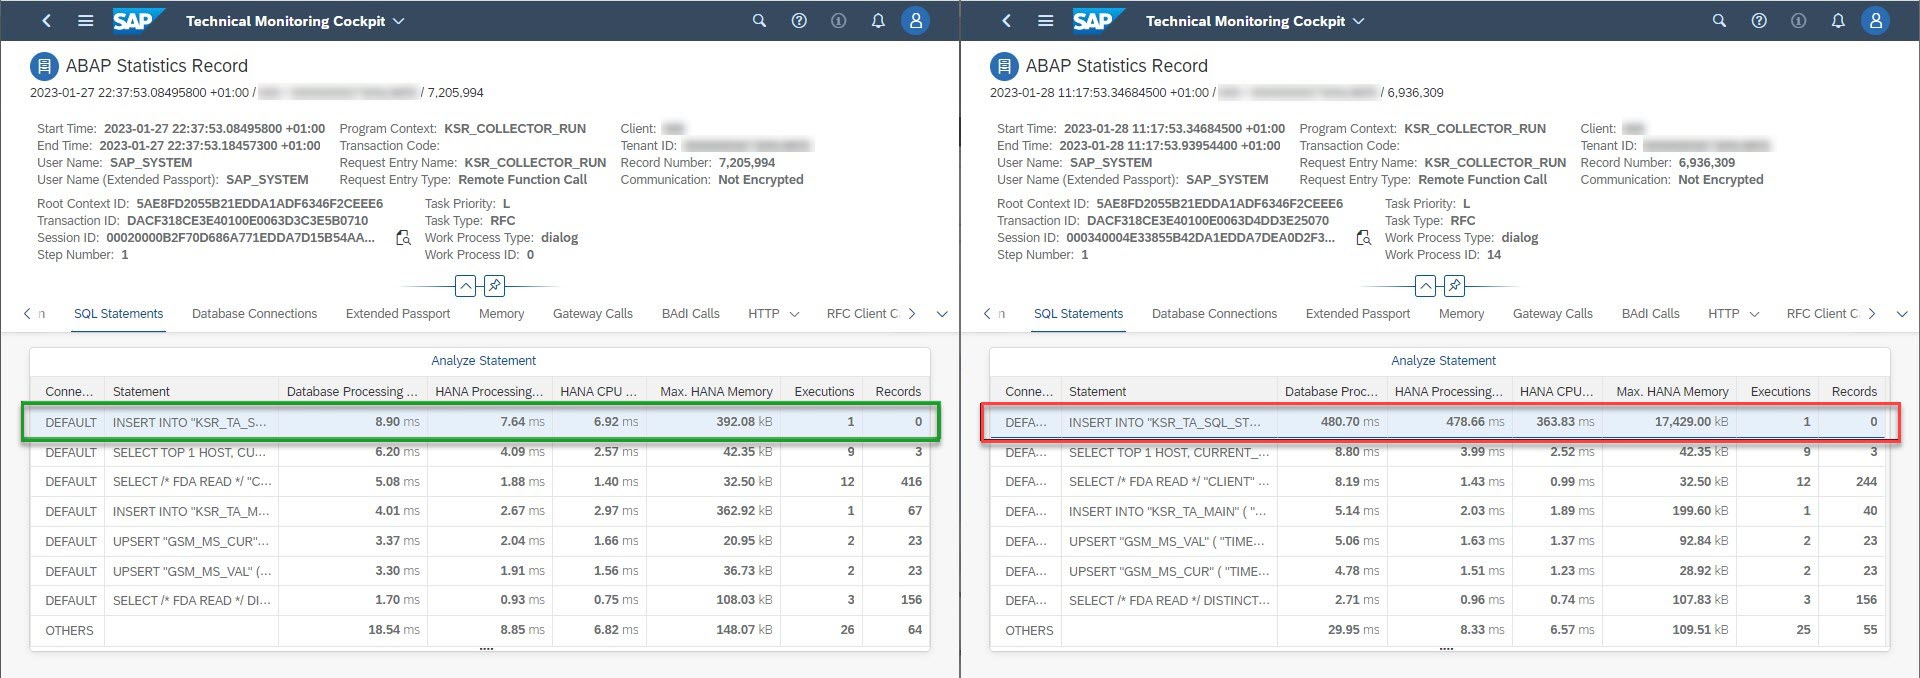
So again, I drilled further down for more details by choosing the details arrow at the end of the row. This led me to the Single SQL Statement Analysis screen.
The SQL statement was already shown on the previous screen in the list of SQL statements, but in most cases, it’ll be truncated. To see the complete SQL statement, I chose the Analyze Statement button that lets you navigate to the SQL Statement Analysis screen. In my scenario, I went directly to the source code in ABAP Development Tools (ADT) by choosing the Show ABAP Source Code in ADT button: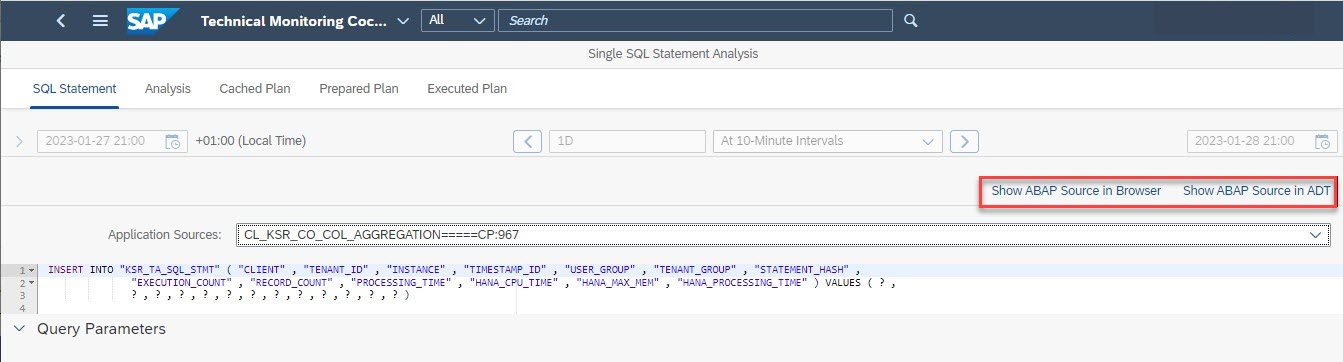
The following figure already shows the fix that I did in ADT. The original SQL statement sent all data to HANA and ignored the duplicate keys. My new code filters duplicate entries in advance in a dedicated SQL statement and performs the INSERT with new values only: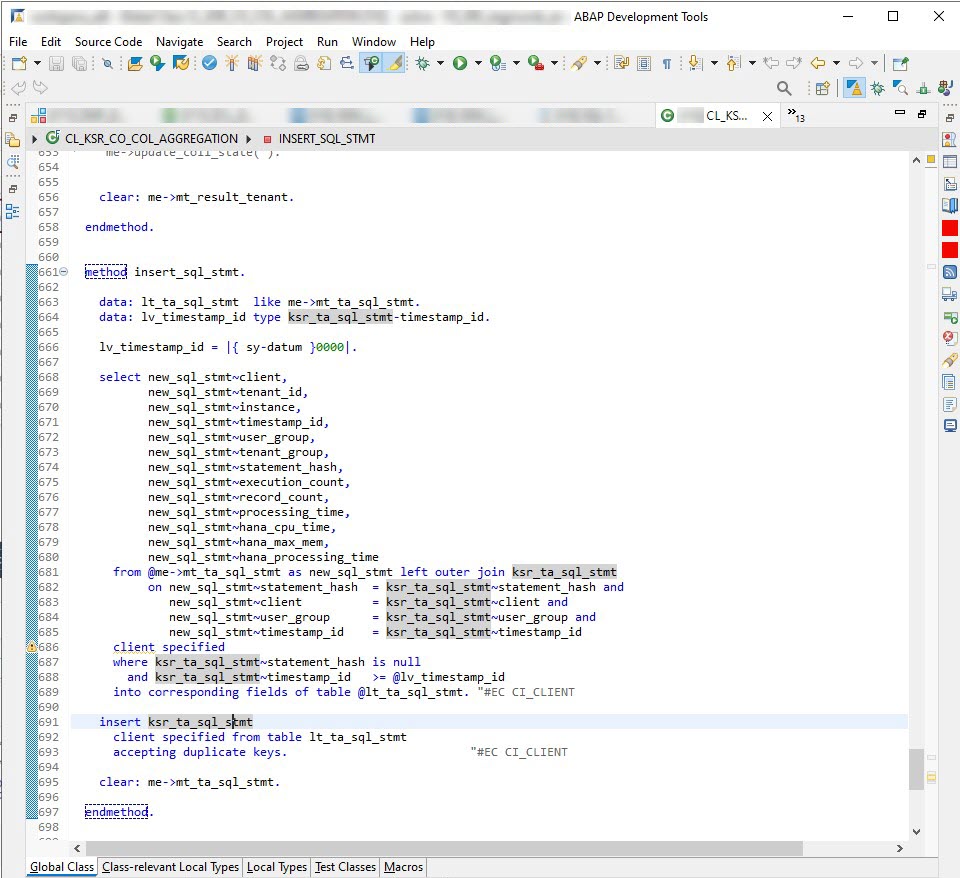
After the fix in my code, I returned to the System Workload app and chose my KSR workload again. The optimized coding now dropped the HANA processing time to a similar value range as before the regression. You can also see here the tiny load generation when the patch was imported to the system:
The System Workload app always shows the complete workload based on aggregated data. The app comes ready with predefined profiling and sampling rates that provide you with sampled ABAP statistics records from expensive and random workloads. This preconfiguration works fine in many cases.
However, the ABAP statistics records that you are interested in might not be among the details shown in the System Workload app because they did not qualify for the default sampling criteria. This is where the Capture Request Statistics app comes into play.
With the Capture Request Statistics app, you can define your own filter criteria for ABAP statistics records that should be captured by the system. For example, you might be interested in requests with a specific request type and name and the related ABAP statistics records.
Just like the samples that have been captured by default for the System Workload app, you can then analyze the captured ABAP statistics records that you have defined and take action in the case of performance issues, for example.
Thanks to the convenient analyzing and drilldown options in the System Workload app, I was able to monitor, analyze, fix, and verify my issue pretty quickly. Try for yourself and let me know in the comments if you like the System Workload app.
I’d like to thank everyone who contributed to this blogpost, especially my colleagues christiancop, anke.griesbaum, Karen.Kuck, and sabine.reich.
For more information about monitoring the system workload for ABAP systems in the cloud, check out the following:
Navigating from System Workload to Individual ABAP Statistics Records
Analyzing the System Workload
For more information about the Capture Request Statistics app, refer to the following documentation on SAP Help Portal: Capturing Request Statistics.
In this blog post, I would like to show you a real-life example of how you can use the System Workload app to analyze a performance degradation. The following scenario was captured during a normal performance regression review of a change in the SQL statement processing for one of my development projects. I had changed a sequence of SQL statements and later checked its impact on performance using this app.
Get an aggregated view of the top consumers in the system
On the SAP Fiori launchpad of the ABAP environment in SAP BTP, I went to the Technical Monitoring area and chose the System Workload app. This app is available for administrator and developer roles. By default, the framework behind the System Workload app collects statistics for expensive requests as well as samples of requests for a wide range of major workloads in the system. So, the app is ready for checking any outliers or increases in system workload.
On the entry screen of the app, I get an aggregated view of the top consumers in the system and how they change over time. You can easily adapt the System Workload screen and filter for a specific scenario using the quick filter fields (circled in red in the screenshot). I filtered for *KSR* in the Request Entry Name field because I knew that the workload associated with my own code contains the string KSR in its request entry names. The chart immediately showed that my "new" algorithm did not optimize things. The HANA processing time was increased by factors. The other time metrics stayed on the same level:
System Workload
I wanted to know more, of course, about the top consumer displayed in the details list and therefore chose the little arrow at the end of the row. This led me to a new screen with more details for this workload.
Check single ABAP statistics records

Expensive ABAP statistics records
On this screen, the chart gives me an idea of how the chosen workload develops over time, based on aggregated values. In addition, there’s a list of sampled ABAP statistics records, which are the data basis of what is shown in the System Workload app.
Now, what are ABAP statistics records? They provide you with important information about activities that were running on an ABAP system. These statistics are generated by the work processes of the ABAP application server and processed by the framework behind the System Workload app. As a result, you get aggregate values as shown in the chart. In addition, expensive requests and requests based on a sampling rate are collected to cover a wide range of major workloads in the system.
The workload sampling already identified my workload as very frequently executed and calculated the median execution time and classified normal samples and outliers. The sampling is implemented in a way to always capture good and bad samples for comparison.
Thanks to the color-coding, you can conveniently compare single records: Red is for a very high server response time, yellow for higher than normal, and green for a response time within normal range compared to the average server response time for this workload.
Compare single ABAP statistics records
Now I drilled down even further and selected first a “good” and then a “bad” sample (as indicated by the color coding) from the list. Choosing an entry from the list led me to another screen with all the details of a single ABAP statistics record.
The following figure shows the ABAP statistics record for the good sample on the left and the bad one on the right:
Comparing good and bad ABAP statistics records
I already knew I had to focus on the HANA database processing time. It’s the dominant time slice that already showed a regression in the initial screen. So I wasn’t surprised that both pie charts also showed a high database processing time. But it’s much more dominant in the bad sample on the right.
Now on to the SQL statements: For a database workload, the ABAP statistics collector captures the most important SQL statements, so there’s no need for you to enable additional tracing. It’s a very light-weight SQL capturing mechanism that is always on. (For more information, see How Are ABAP Statistics Records Collected?.)
To get to the SQL statements, I simply scroll down on the ABAP Statistics Record Screen to the SQL Statements section.
When I analyzed the two samples, I found similar SQL statements. But the first INSERT SQL statement - see the following figure - had a database processing time of only 8.90 ms in the good sample on the left. In the bad sample, the same SQL statement had a processing time of 480.70 ms.
Comparing good and bad SQL Statements
So again, I drilled further down for more details by choosing the details arrow at the end of the row. This led me to the Single SQL Statement Analysis screen.
Analyze SQL statements
The SQL statement was already shown on the previous screen in the list of SQL statements, but in most cases, it’ll be truncated. To see the complete SQL statement, I chose the Analyze Statement button that lets you navigate to the SQL Statement Analysis screen. In my scenario, I went directly to the source code in ABAP Development Tools (ADT) by choosing the Show ABAP Source Code in ADT button:
Analyzing the SQL Statement
Fixed it
The following figure already shows the fix that I did in ADT. The original SQL statement sent all data to HANA and ignored the duplicate keys. My new code filters duplicate entries in advance in a dedicated SQL statement and performs the INSERT with new values only:
Performance Optimization
Solution Verification
After the fix in my code, I returned to the System Workload app and chose my KSR workload again. The optimized coding now dropped the HANA processing time to a similar value range as before the regression. You can also see here the tiny load generation when the patch was imported to the system:
Solution Verification
Capturing and Analyzing Your Workload Based on Your Own Filter Criteria
The System Workload app always shows the complete workload based on aggregated data. The app comes ready with predefined profiling and sampling rates that provide you with sampled ABAP statistics records from expensive and random workloads. This preconfiguration works fine in many cases.
However, the ABAP statistics records that you are interested in might not be among the details shown in the System Workload app because they did not qualify for the default sampling criteria. This is where the Capture Request Statistics app comes into play.
With the Capture Request Statistics app, you can define your own filter criteria for ABAP statistics records that should be captured by the system. For example, you might be interested in requests with a specific request type and name and the related ABAP statistics records.
Just like the samples that have been captured by default for the System Workload app, you can then analyze the captured ABAP statistics records that you have defined and take action in the case of performance issues, for example.
Conclusion
Thanks to the convenient analyzing and drilldown options in the System Workload app, I was able to monitor, analyze, fix, and verify my issue pretty quickly. Try for yourself and let me know in the comments if you like the System Workload app.
I’d like to thank everyone who contributed to this blogpost, especially my colleagues christiancop, anke.griesbaum, Karen.Kuck, and sabine.reich.
For more information about monitoring the system workload for ABAP systems in the cloud, check out the following:
Navigating from System Workload to Individual ABAP Statistics Records
Analyzing the System Workload
For more information about the Capture Request Statistics app, refer to the following documentation on SAP Help Portal: Capturing Request Statistics.
- SAP Managed Tags:
- SAP BTP, ABAP environment,
- ABAP Development,
- Cloud Operations
Labels:
You must be a registered user to add a comment. If you've already registered, sign in. Otherwise, register and sign in.
Labels in this area
-
ABAP CDS Views - CDC (Change Data Capture)
2 -
AI
1 -
Analyze Workload Data
1 -
BTP
1 -
Business and IT Integration
2 -
Business application stu
1 -
Business Technology Platform
1 -
Business Trends
1,661 -
Business Trends
86 -
CAP
1 -
cf
1 -
Cloud Foundry
1 -
Confluent
1 -
Customer COE Basics and Fundamentals
1 -
Customer COE Latest and Greatest
3 -
Customer Data Browser app
1 -
Data Analysis Tool
1 -
data migration
1 -
data transfer
1 -
Datasphere
2 -
Event Information
1,400 -
Event Information
64 -
Expert
1 -
Expert Insights
178 -
Expert Insights
270 -
General
1 -
Google cloud
1 -
Google Next'24
1 -
Kafka
1 -
Life at SAP
784 -
Life at SAP
11 -
Migrate your Data App
1 -
MTA
1 -
Network Performance Analysis
1 -
NodeJS
1 -
PDF
1 -
POC
1 -
Product Updates
4,578 -
Product Updates
323 -
Replication Flow
1 -
RisewithSAP
1 -
SAP BTP
1 -
SAP BTP Cloud Foundry
1 -
SAP Cloud ALM
1 -
SAP Cloud Application Programming Model
1 -
SAP Datasphere
2 -
SAP S4HANA Cloud
1 -
SAP S4HANA Migration Cockpit
1 -
Technology Updates
6,886 -
Technology Updates
395 -
Workload Fluctuations
1
Related Content
- Harnessing the Power of SAP HANA Cloud Vector Engine for Context-Aware LLM Architecture in Technology Blogs by SAP
- CAP LLM Plugin – Empowering Developers for rapid Gen AI-CAP App Development in Technology Blogs by SAP
- Recap - SAP ALM at SAP Insider Las Vegas 2024 in Technology Blogs by SAP
- Benchmarking in the data-driven era in Technology Blogs by SAP
- Workload Analysis for HANA Platform Series - 3. Identify the Memory Consumption in Technology Blogs by SAP
Top kudoed authors
| User | Count |
|---|---|
| 11 | |
| 10 | |
| 10 | |
| 9 | |
| 8 | |
| 7 | |
| 7 | |
| 7 | |
| 7 | |
| 6 |