
- SAP Community
- Products and Technology
- Technology
- Technology Blogs by SAP
- AI-powered Pipeline Corrosion Analysis: Implementa...
Technology Blogs by SAP
Learn how to extend and personalize SAP applications. Follow the SAP technology blog for insights into SAP BTP, ABAP, SAP Analytics Cloud, SAP HANA, and more.
Turn on suggestions
Auto-suggest helps you quickly narrow down your search results by suggesting possible matches as you type.
Showing results for
Product and Topic Expert
Options
- Subscribe to RSS Feed
- Mark as New
- Mark as Read
- Bookmark
- Subscribe
- Printer Friendly Page
- Report Inappropriate Content
11-27-2023
10:39 AM
This blog post is intended to be an in-depth look at the implementation of the proof of concept related to the “AI-powered pipeline corrosion analysis” use case introduced in this blog post. Before starting to delve into the implementation, I will briefly summarize the highlights of the use case, but for all the details I invite you to refer to the introductory blog post.
Please, note that this blog post is part of a series of technical enablement sessions on SAP BTP for Industries. Check the full calendar here to watch the recordings of past sessions and register for the upcoming ones! The replay of the session related to this blog post and all the other sessions is available here.
Authors: cesare.calabria, yatsea.li and kristian.papai
Pipelines are among the cheapest and most efficient means of transporting dangerous and flammable substances. For this reason, pipelines represent a fundamental asset in the Oil & Gas sector. Naturally, pipes are subject to a continuous process of internal corrosion which can compromise their correct functioning. This process can potentially lead to operational disruptions, economic losses, severe environmental damage and safety issues. Therefore, it is essential to be able to assess the depth of pipeline corrosion with high precision. There are several direct techniques for measuring corrosion depth, but they are expensive, time-consuming, risky for technicians, and sometimes not even possible on old pipes.
To solve this challenge in the Oil & Gas sector it is possible to exploit Artificial Intelligence and develop an algorithm capable of predicting the corrosion depth of the pipeline at each point of the grid based on the values of some correlated quantities to be measured directly. The ability to predict corrosion depth opens up the possibility to optimally plan pipeline maintenance and move from reactive to predictive maintenance. This results in substantial cost savings by reducing downtime, minimizing unnecessary maintenance, and extending pipeline life.
What I will show below is how you can develop and train a simple predictive pipeline corrosion model and how to implement the MLOps infrastructure needed to maintain it in production with SAP BTP products and services.
We can start from the data sources and the data we can get from them. What are the main data sources we are imagining dealing with in our use case? First, the IoT devices used to measure several quantities that are correlated to the corrosion process, then the corrosion depth measurements executed time by time by the field technicians. We can have also additional information, for instance, about the technical specifications of the pipeline that can come from a database or S4/HANA Cloud.
What type of information can we get? We can mention a few of them: the type of flowing fluid, the geo coordinates of measured points along the pipeline, the pressure flow rate and so on and so forth.
All this information can be used to feed some artificial intelligence algorithms for predicting the pipeline corrosion. There are several options, for example it is possible to use support vector machines or artificial neural networks, or it's possible also to conduct some regression analysis. You will see in the following that this is the approach we will follow in our use case.
The data that we are using in this use case are inspired to a real measurement campaign that was executed in Namibia and that lasted ten years starting from 2013. The table in Fig. 1 describes the quantities that have been measured for ten years and summarizes their statistical properties.
All these quantities are considered relevant for the corrosion process of the pipelines. From the table you can see the statistical properties and the range of variability of these quantities.
Let me now spend some words to explain how we generated our historical dataset starting from the table above, the historical dataset we have used to train our predictive AI model. For this use case we have imagined to measure several points along a pipeline in Germany and we imagined also that these points are affected by different corrosion rates. So we imagined our points belong to the corrosion rate classes defined in the table in Fig. 2 and that is the reference standard provided by the National Association of Corrosion Engineers.
We have assumed also that our pipeline was installed in 2013 and that in the beginning it didn't show any corrosion. Moreover, we assumed that the corrosion rates were constant in time.
This is evident from the plot of the corrosion depth taken from our dataset versus time: as you can see we get straight lines with a constant slope (see Fig. 3). Now let's move on and let's let's talk about the model.
As anticipated, what we would like to perform is a regression analysis and in order to do that we need to choose a regression algorithm. In particular we have decided to use a Gradient Boosting Regressor from the SciKit Learn library. It's a very popular algorithm that is used for this kind of analyses. It is also used in real use cases in conjunction with other advanced techniques. If you want to learn more about the Gradient Boosting Regressor, you can follow the links at the end of this blog post.
One important thing to mention here is that a model in general can face a performance degradation in time due to suboptimal coding or, for example, due to constantly evolving data profiles. So it's crucial to monitor the performance looking at some case specific metrics.
In our use case we rely on the so-called mean squared error. It's a common choice for this kind of regression analyses. The mean squared error in statistics provides an estimation of the mean deviation of the predictions from the actual values. There can be many other possibilities, but this is the reference metric in our use case. As an additional detail, we used it also as a loss function in the training of the Gradient Boosting Regressor.
Before proceeding further, let's have a look at the phases that a typical machine learning process is made of. We can recognize at least two main phases (see Fig. 4): the training phase is the first one. This is an offline phase where you prepare your data, you build and train your model.
The output of this phase is a new artefact model that you can consume in the prediction phase by exposing it to any client through a REST API. In order to expose the model the prediction phase requires to start a serving application, basically a micro service that will serve the model and that will manage all the inference requests that will come through the REST API.
Let’s refer to Fig. 5 and see how we can implement both these phases in AI Core for our predictive model for the pipeline corrosion.
Everything starts with the code where you define all the steps needed for the training of the pipeline corrosion predictive model. This code can be written in any programming language because it will be executed within AI Core in the form of a container. For the development of our prototype we decided to use Python that is very popular among data scientists.
This piece of code needs to be transformed into a Docker image that will be then loaded into a Docker registry so that it is available on the cloud for consumption by AI Core.
Then we need to provide a training dataset. I have already introduced the historical dataset we have generated and that we will use for the training. This training dataset needs to be hosted in a storage element accessible to AI Core. One option is to use a hyperscaler object store like an S3 bucket or to leverage the HANA Cloud Data Lake Files.
Then we need to compile a so-called “workflow template”, a declarative configuration file that basically instructs AI Core about the resources to use, the containers to run and all the other configurations needed for executing the training. Once AI Core is aligned to the configuration described in the declarative configuration file, everything is ready to execute the training.
The training execution can be checked from AI Launchpad and there it is possible also to check the metrics if they have been defined and registered in the training code. Once the training is completed then the output is a trained model, the predictive model, that is immediatly saved within the storage element that we have decided to use. In order to consume this model online, we need to write another piece of code for the serving application.
Again we need to transform this code into a Docker container and then we need to provide another template, a serving template this time, that is a bit different from the previous one. A serving template will instruct AI Core about how to run your container and it will define an inference platform for your model. So once AI Core is aligned to the prescriptions of the serving template, then it's possible to start the deployment. The outcome of this operation is basically a deployment URL that is exposed for consumption from any client.
Let's see in the following video how it is possible to consume the pipeline corrosion predictive model, for instance, from Postman.
We now know the workflow to follow in order to train and deploy our model in AI Core. And we've learned also how to consume our predictive model through Postman. But it's worth to stop for a moment and clarify what actually allows us to execute all the operations that we have seen.
In the ML workflow, all the operations are possible because we have a standardized AI API that provides several endpoints to manage the lifecycle of a ML solution in AI Core. And these endpoints can be consumed from many clients (see Fig. 6). For example, it's possible to consume them from a Python code in a Jupiter notebook thanks to the to the SAP AI Core SDK or for instance from AI Launchpad. And thanks to an extension that was released recently, you can manage AI Core also from Visual Studio or you can also choose the classic options like cURL or Postman, as we have seen.
This is very important for the following because to develop the MLOps automations we will make extensive use of these endpoints. From the business accelerator hub and you can access the specifications of this AI API and you can find the relative documentation and check all the endpoints available.
So far we have talked about how to implement the artificial intelligence part of our solution (see the introductory blog post for the details), but as already mentioned in the introduction, once you have in place a solution based on an artificial intelligence model, then you have also to think about how to maintain efficiently this solution in production. In order to do that, you need to build an MLOps infrastructure that will be used by a specific MLOps team. Let's see what MLOps is.
MLOps is a methodology combining machine learning and DevOps practices to streamline developing, deploying and maintaining machine learning models. MLOps shares several key characteristics with DevOps, let’s check them one by one.
First of all, the first key principle is automation. It's really important to automate every aspect of the machine learning life cycle. Automating critical steps in the machine learning workflow can result in a more efficient and reliable workflow. In order to achieve automation, we will see that the development of pipelines is strictly required.
MLOps also encourages collaboration and transparency, that is the culture of sharing knowledge and expertise across the teams developing and deploying machine learning models. These helps to ensure a streamlined deployment process.
Very important is also the next key principle, the Infrastructure as a Code (IaC). Both DevOps and MLOps encourage to treat every aspect of the ML solution as it was code. This means that every aspect can be managed through a version control system like GitHub. You can think about, for example, the templates we use to configure AI Core, that is an example of IaC. This approach allows teams to manage infrastructure changes more efficiently and reproducibly.
Then another important point is testing and monitoring: it is mandatory to test and monitor every aspect of the machine learning solution. Automatize this operation as much as possible when there is a continuous cycle of development helps to ensure consistent and reliable results.
MLOps methodology is also conceived to ensure flexibility and agility in response to changing business needs and requirements. This means being able to rapidly deploy and iterate on machine learning models to keep up with evolving business demand.
But what are the differences with the classic DevOps? What are the specific features of MLOps?
First of all, we can mention the team skills, because the team working on a machine learning solution should include personas like data scientists or machine learning researchers.
The development of a machine learning solution is a bit different from the development of a classic solution because machine learning proceeds in nature through experiments.
The testing phase is different because it's not only made of unit and integration tests, but it includes also data validation, trained model quality evaluation and model validation.
Also, the deployment of a machine learning solution is different because it might require another specific system, a pipeline, to deploy an entire service in production.
Another particular aspect of MLOps concerns the solution in production: the deployed machine learning models can decay in time. So as depicted in Fig. 7, you can expect the accuracy of a model can decrease in time. And once the accuracy goes below a certain threshold, you need to refresh and retrain your model.
From what we have said so far, automation is the most important key feature of MLOps and in order to achieve it we need to create some automatisms. Below you can see list of the main automatisms that cannot be missed in a MLOps infrastructure:
We will see how to implement them all and how to execute them in AI Core in the following sections of this blog post.
Let’s go back to the architecture we proposed for the MLOps infrastructure in our first blog post. In this architecture (see Fig. 😎 AI Core is the run-time we can use to run also the MLOps automatisms.
So the idea is to run the code developed for implementing CM, CT+CD and CI+CD in a specific AI Core instance or a dedicated resource group. But what are the benefits to use the AI Core as a runtime also for the MLOps pipelines?
This approach avoids to introduce additional products in your landscape and allows to manage the ML solution and the MLOps infrastructure from AI Core, so that your assets are not scattered here and there. Moreover, this choice allows to monitor everything from AI Launchpad, this means you don't need to spend time to develop a UI (see Fig. 9).
For example, if you have only one AI Core instance in your subaccount you can see the ML solution and the MLOps infrastructure scenarios side by side both accessible from the same AI Launchpad window. Moreover the logs of the pipeline executions can be checked by means of AI Launchpad (see Fig. 10).
Now let's see how we can execute these pipelines in AI Core. Let’s refer to the animation below (Fig. 11).
Also in this case everything starts with having a piece of code for every pipeline, for example written in Python.
Let’s start discussing the CM pipeline first. We need to "dockerize" the relative code and put it into Docker registry. Then we need to create a template for the Continuous Monitoring pipeline that will instruct AI Core about how to run it. Then AI Core aligns to the configuration described in the template and the CM is ready to be executed. So implicitly here we are saying that the Continuous Monitoring pipeline can be treated as an execution within a AI Core.
For this execution we need to provide the new data that we would like to score. This data can be stored in the storage element that we've decided to use for the solution. In our prototype it is an S3 bucket, but it can be any other object store or HANA Data Lake Files. Please, note that from AI Launchpad we can start an execution manually, or we can also schedule it by means of the available scheduler. In both the cases we can easily follow the execution from the logs.
We can do something similar also for the Continuous Training and Continuous Deployment pipeline. So we write the code in Python, we create a Docker image and then we create another template specific to this pipeline. Also the CT/CD pipeline is treated like an execution in AI Core. For this execution we need to provide a dataset for the retraining of the model and another one for testing it once the training is completed. The output of this execution is a new predictive model for our pipeline corrosion that the Continuous Deployment will take care of deploying into the production environment.
The situation is slighlty different for the Continuous Integration and Continuous Deployment pipeline. Why? Because the CI part needs to be implemented so that it is able to listen constantly to the notifications of changes applied to the ML solution components in the GitHub repository. This means we need to write the code not only for the pipeline, but also for a microservice that will serve it, similarly to what we have done for deploying the pipeline corrosion model.
We need to create another template for the CI/CD pipeline, this time this template will be a serving template for the reasons I have explained few seconds ago. And once AI Core is aligned to the specifications of the template, everything is ready to start our server that will catch any change applied to the ML solution in the GitHub repository.
Let's now take a closer look at individual pipelines and the types of events that can trigger them. Let's start with Continuous Monitoring (see Fig. 12 and 13).
We have seen that in our storyline the new data can come from the IoT devices and also from the measurements of the field technicians. This data is stored in a storage element, for example an S3 bucket. Our Continuous Monitoring pipeline will check this bucket regularly looking for new data, for instance in the form of csv files. Once it finds new files, it will proceed with scoring these data by consuming the pipeline corrosion model deployed in production.
Since the ground truth is available, it is possible to make a comparison with the predictions and if a performance degradation is identified, then a notification is sent by email to the MLOps team and then automatically or manually, the Continuous Training pipeline is activated.
Before proceeding to the Continuous Training part, let’s see in the following video how the CM pipeline works.
What happens when a degradation is identified by the CM pipeline? The MLOps team can manually require a retraining of the pipeline corrosion model by triggering the Continuous Training pipeline (see Fig. 14).
This continuous training will execute a new re-training of the model with an input dataset that now includes also the new data.
You can have a look at the main operations the CT/CD pipeline will execute in the AI Core test instance in the animation below (Fig. 15).
If the CT pipeline is completed without errors, then the continuous deployment pipeline is activated and then this pipeline will basically bring the new trained model in production, updating the existing deployment.
You can take a more in-depth look at the code developed for the CT/CD pipeline and the initial steps needed to run it in AI Core by watching the following video.
In the next video you can see how you can follow the steps of a CT/CD pipeline run from AI Launchpad. Note that for simplicity, we only used one AI Core instance in this video, and the pipeline corrosion predictive model is deployed in a resource group called “dev”. Additionally, CT/CD pipeline operations run within the same resource group. In real life projects it is good practice to have a separation into different resource groups or AI Core instances as explained above.
Let’s see now how the CI/CD pipeline works and the events that can trigger it.
Let’s imagine that data scientists and machine learning engineers commit changes into the GitHub repository touching the components of the pipeline corrosion solution, for instance the training part or the serving application or both.
This operation triggers the Continuous Integration pipeline that will build new Docker images for the training and serving parts and it will execute several tests and operations in the AI Core test environment (see Fig. 16).
If everything goes well, then again the Continuous Deployment pipeline is triggered and then all the changes are brought in production where, for example, a new deployment is started.
But what do we need to develop also the CI/CD pipeline?If you have already developed the Continuous Training and Continuous Deployment pipeline, you probably have almost all that you need. What is missing is the part concerning the build and load of the new Docker images (see Fig. 17).
As we said before, the CI part needs to be implemented so that it is able to listen constantly to the notifications of changes applied to the ML solution components in the GitHub repository. This means we need to write the code not only for the pipeline, but also for a microservice that will serve it and that will manage the notifications coming from GitHub through an exposed endpoint (see Fig. 18).
Once we have developed the server, we need to work also on the GitHub side where we need to setup a webhook. We need to provide the URL where the POST requests will be sent and we need to specify which kind of events we want to be notified about. Once we have done this, we can receive the notifications we need and they will trigger the CI/CD pipeline under the hood.
To complete the discussion on CI/CD, it is worth saying a few words about the interaction between the versioning system, for example GitHub, the developers, and AI Core that you might need to implement in a real-world scenario.
Let's refer to Fig. 19. In general, we can imagine that developers work with Jupyter or an IDE like Visual Studio and do their experiments in an AI Core development instance. We can also expect them to push their new developments into a GitHub dev branch from time to time. Once the developers are done, from this branch they can send a pull request (PR) with the new developments to the GitHub branch that hosts al. According to MLOps requirements, this PR cannot be accepted immediately, but should trigger the Continuous Integration pipeline in an AI Core test instance (as described in the previous paragraph).
If the CI pipeline completes without errors, there are two possible scenarios that will take on two different names and meanings:
In this blog post we learned how critical it is to maintain the integrity of pipelines for the Oil & Gas industry and how difficult it can be to assess the corrosion depth at any point in the grid. So difficult, expensive, time-consuming and sometimes so dangerous for the field technicians that the only way to address this challenge is to leverage artificial intelligence. But we have seen how we can help with SAP BTP that provides all the needed tools to develop an intelligent business solution to predict corrosion depth and perform many other tasks such as optimizing a maintenance program. Furthermore, we have also seen how SAP BTP can be used to build and execute the automation required by MLOps requirements to keep the solution in production. What we have explained here with this specific and real-world use case can be inspiring and reusable for many other scenarios, especially when you need to setup an MLOps infrastructure for an AI-based solution. What we have developed for this proof-of-concept can be find at this link.
Please, note that this blog post is part of a series of technical enablement sessions on SAP BTP for Industries. Check the full calendar here to watch the recordings of past sessions and register for the upcoming ones! The replay of the session related to this blog post and all the other sessions is available here.
Authors: cesare.calabria, yatsea.li and kristian.papai
Introduction
Pipelines are among the cheapest and most efficient means of transporting dangerous and flammable substances. For this reason, pipelines represent a fundamental asset in the Oil & Gas sector. Naturally, pipes are subject to a continuous process of internal corrosion which can compromise their correct functioning. This process can potentially lead to operational disruptions, economic losses, severe environmental damage and safety issues. Therefore, it is essential to be able to assess the depth of pipeline corrosion with high precision. There are several direct techniques for measuring corrosion depth, but they are expensive, time-consuming, risky for technicians, and sometimes not even possible on old pipes.
To solve this challenge in the Oil & Gas sector it is possible to exploit Artificial Intelligence and develop an algorithm capable of predicting the corrosion depth of the pipeline at each point of the grid based on the values of some correlated quantities to be measured directly. The ability to predict corrosion depth opens up the possibility to optimally plan pipeline maintenance and move from reactive to predictive maintenance. This results in substantial cost savings by reducing downtime, minimizing unnecessary maintenance, and extending pipeline life.
What I will show below is how you can develop and train a simple predictive pipeline corrosion model and how to implement the MLOps infrastructure needed to maintain it in production with SAP BTP products and services.
Implementing a simple pipeline corrosion predictive model in AI Core
Dataset, model and metrics
We can start from the data sources and the data we can get from them. What are the main data sources we are imagining dealing with in our use case? First, the IoT devices used to measure several quantities that are correlated to the corrosion process, then the corrosion depth measurements executed time by time by the field technicians. We can have also additional information, for instance, about the technical specifications of the pipeline that can come from a database or S4/HANA Cloud.
What type of information can we get? We can mention a few of them: the type of flowing fluid, the geo coordinates of measured points along the pipeline, the pressure flow rate and so on and so forth.
All this information can be used to feed some artificial intelligence algorithms for predicting the pipeline corrosion. There are several options, for example it is possible to use support vector machines or artificial neural networks, or it's possible also to conduct some regression analysis. You will see in the following that this is the approach we will follow in our use case.
The data that we are using in this use case are inspired to a real measurement campaign that was executed in Namibia and that lasted ten years starting from 2013. The table in Fig. 1 describes the quantities that have been measured for ten years and summarizes their statistical properties.

Fig. 1: Descriptive statistics of some relevant parameters for the pipeline corrosion (source).
All these quantities are considered relevant for the corrosion process of the pipelines. From the table you can see the statistical properties and the range of variability of these quantities.
Let me now spend some words to explain how we generated our historical dataset starting from the table above, the historical dataset we have used to train our predictive AI model. For this use case we have imagined to measure several points along a pipeline in Germany and we imagined also that these points are affected by different corrosion rates. So we imagined our points belong to the corrosion rate classes defined in the table in Fig. 2 and that is the reference standard provided by the National Association of Corrosion Engineers.

Fig. 2: Qualitative categorization of carbon steel corrosion rates for oil production systems (source: NACE Standard RP0775-2005).
We have assumed also that our pipeline was installed in 2013 and that in the beginning it didn't show any corrosion. Moreover, we assumed that the corrosion rates were constant in time.

Fig. 3: Corrosion depth in the simulated historical dataset.
This is evident from the plot of the corrosion depth taken from our dataset versus time: as you can see we get straight lines with a constant slope (see Fig. 3). Now let's move on and let's let's talk about the model.
As anticipated, what we would like to perform is a regression analysis and in order to do that we need to choose a regression algorithm. In particular we have decided to use a Gradient Boosting Regressor from the SciKit Learn library. It's a very popular algorithm that is used for this kind of analyses. It is also used in real use cases in conjunction with other advanced techniques. If you want to learn more about the Gradient Boosting Regressor, you can follow the links at the end of this blog post.
One important thing to mention here is that a model in general can face a performance degradation in time due to suboptimal coding or, for example, due to constantly evolving data profiles. So it's crucial to monitor the performance looking at some case specific metrics.
In our use case we rely on the so-called mean squared error. It's a common choice for this kind of regression analyses. The mean squared error in statistics provides an estimation of the mean deviation of the predictions from the actual values. There can be many other possibilities, but this is the reference metric in our use case. As an additional detail, we used it also as a loss function in the training of the Gradient Boosting Regressor.
How to train and deploy the pipeline corrosion predictive model in AI Core
Before proceeding further, let's have a look at the phases that a typical machine learning process is made of. We can recognize at least two main phases (see Fig. 4): the training phase is the first one. This is an offline phase where you prepare your data, you build and train your model.
The output of this phase is a new artefact model that you can consume in the prediction phase by exposing it to any client through a REST API. In order to expose the model the prediction phase requires to start a serving application, basically a micro service that will serve the model and that will manage all the inference requests that will come through the REST API.

Fig. 4: Typical ML process (source).
Let’s refer to Fig. 5 and see how we can implement both these phases in AI Core for our predictive model for the pipeline corrosion.
Everything starts with the code where you define all the steps needed for the training of the pipeline corrosion predictive model. This code can be written in any programming language because it will be executed within AI Core in the form of a container. For the development of our prototype we decided to use Python that is very popular among data scientists.

Fig. 5: Workflow for training and deploying a ML model in SAP AI Core.
This piece of code needs to be transformed into a Docker image that will be then loaded into a Docker registry so that it is available on the cloud for consumption by AI Core.
Then we need to provide a training dataset. I have already introduced the historical dataset we have generated and that we will use for the training. This training dataset needs to be hosted in a storage element accessible to AI Core. One option is to use a hyperscaler object store like an S3 bucket or to leverage the HANA Cloud Data Lake Files.
Then we need to compile a so-called “workflow template”, a declarative configuration file that basically instructs AI Core about the resources to use, the containers to run and all the other configurations needed for executing the training. Once AI Core is aligned to the configuration described in the declarative configuration file, everything is ready to execute the training.
The training execution can be checked from AI Launchpad and there it is possible also to check the metrics if they have been defined and registered in the training code. Once the training is completed then the output is a trained model, the predictive model, that is immediatly saved within the storage element that we have decided to use. In order to consume this model online, we need to write another piece of code for the serving application.
Again we need to transform this code into a Docker container and then we need to provide another template, a serving template this time, that is a bit different from the previous one. A serving template will instruct AI Core about how to run your container and it will define an inference platform for your model. So once AI Core is aligned to the prescriptions of the serving template, then it's possible to start the deployment. The outcome of this operation is basically a deployment URL that is exposed for consumption from any client.
Let's see in the following video how it is possible to consume the pipeline corrosion predictive model, for instance, from Postman.
Focus on the management of the AI Core operations
We now know the workflow to follow in order to train and deploy our model in AI Core. And we've learned also how to consume our predictive model through Postman. But it's worth to stop for a moment and clarify what actually allows us to execute all the operations that we have seen.
In the ML workflow, all the operations are possible because we have a standardized AI API that provides several endpoints to manage the lifecycle of a ML solution in AI Core. And these endpoints can be consumed from many clients (see Fig. 6). For example, it's possible to consume them from a Python code in a Jupiter notebook thanks to the to the SAP AI Core SDK or for instance from AI Launchpad. And thanks to an extension that was released recently, you can manage AI Core also from Visual Studio or you can also choose the classic options like cURL or Postman, as we have seen.

Fig. 6: Clients for the ML Operations in AI Core.
This is very important for the following because to develop the MLOps automations we will make extensive use of these endpoints. From the business accelerator hub and you can access the specifications of this AI API and you can find the relative documentation and check all the endpoints available.
Automating MLOps for the pipeline corrosion prediction model
So far we have talked about how to implement the artificial intelligence part of our solution (see the introductory blog post for the details), but as already mentioned in the introduction, once you have in place a solution based on an artificial intelligence model, then you have also to think about how to maintain efficiently this solution in production. In order to do that, you need to build an MLOps infrastructure that will be used by a specific MLOps team. Let's see what MLOps is.
Introduction to MLOps
MLOps is a methodology combining machine learning and DevOps practices to streamline developing, deploying and maintaining machine learning models. MLOps shares several key characteristics with DevOps, let’s check them one by one.
First of all, the first key principle is automation. It's really important to automate every aspect of the machine learning life cycle. Automating critical steps in the machine learning workflow can result in a more efficient and reliable workflow. In order to achieve automation, we will see that the development of pipelines is strictly required.
MLOps also encourages collaboration and transparency, that is the culture of sharing knowledge and expertise across the teams developing and deploying machine learning models. These helps to ensure a streamlined deployment process.
Very important is also the next key principle, the Infrastructure as a Code (IaC). Both DevOps and MLOps encourage to treat every aspect of the ML solution as it was code. This means that every aspect can be managed through a version control system like GitHub. You can think about, for example, the templates we use to configure AI Core, that is an example of IaC. This approach allows teams to manage infrastructure changes more efficiently and reproducibly.
Then another important point is testing and monitoring: it is mandatory to test and monitor every aspect of the machine learning solution. Automatize this operation as much as possible when there is a continuous cycle of development helps to ensure consistent and reliable results.
MLOps methodology is also conceived to ensure flexibility and agility in response to changing business needs and requirements. This means being able to rapidly deploy and iterate on machine learning models to keep up with evolving business demand.
But what are the differences with the classic DevOps? What are the specific features of MLOps?
First of all, we can mention the team skills, because the team working on a machine learning solution should include personas like data scientists or machine learning researchers.
The development of a machine learning solution is a bit different from the development of a classic solution because machine learning proceeds in nature through experiments.
The testing phase is different because it's not only made of unit and integration tests, but it includes also data validation, trained model quality evaluation and model validation.
Also, the deployment of a machine learning solution is different because it might require another specific system, a pipeline, to deploy an entire service in production.
Another particular aspect of MLOps concerns the solution in production: the deployed machine learning models can decay in time. So as depicted in Fig. 7, you can expect the accuracy of a model can decrease in time. And once the accuracy goes below a certain threshold, you need to refresh and retrain your model.

Fig. 7: ML model decay monitoring (revised version of the original image here).
From what we have said so far, automation is the most important key feature of MLOps and in order to achieve it we need to create some automatisms. Below you can see list of the main automatisms that cannot be missed in a MLOps infrastructure:
- Continuous Monitoring (CM): We have mentioned that the model performance can decay in time. So the first need is to create a pipeline to monitor continuously the performance of the model.
- Continuous Training (CT): And then you also need another pipeline to automatically retrain the model once a degradation is identified.
- Continuous Integration (CI): Since usually in any project there is always the need for a continuous development cycle, it's also best practice to implement a so-called continuous integration pipeline that is used to automate the test and validation of any new development before it is accepted.
- Continuous Deployment (CD): As already mentioned before, you need a continuous deployment pipeline to execute the automatic deployment in production of any new development.
We will see how to implement them all and how to execute them in AI Core in the following sections of this blog post.
Tailoring MLOps to AI Core
Let’s go back to the architecture we proposed for the MLOps infrastructure in our first blog post. In this architecture (see Fig. 😎 AI Core is the run-time we can use to run also the MLOps automatisms.
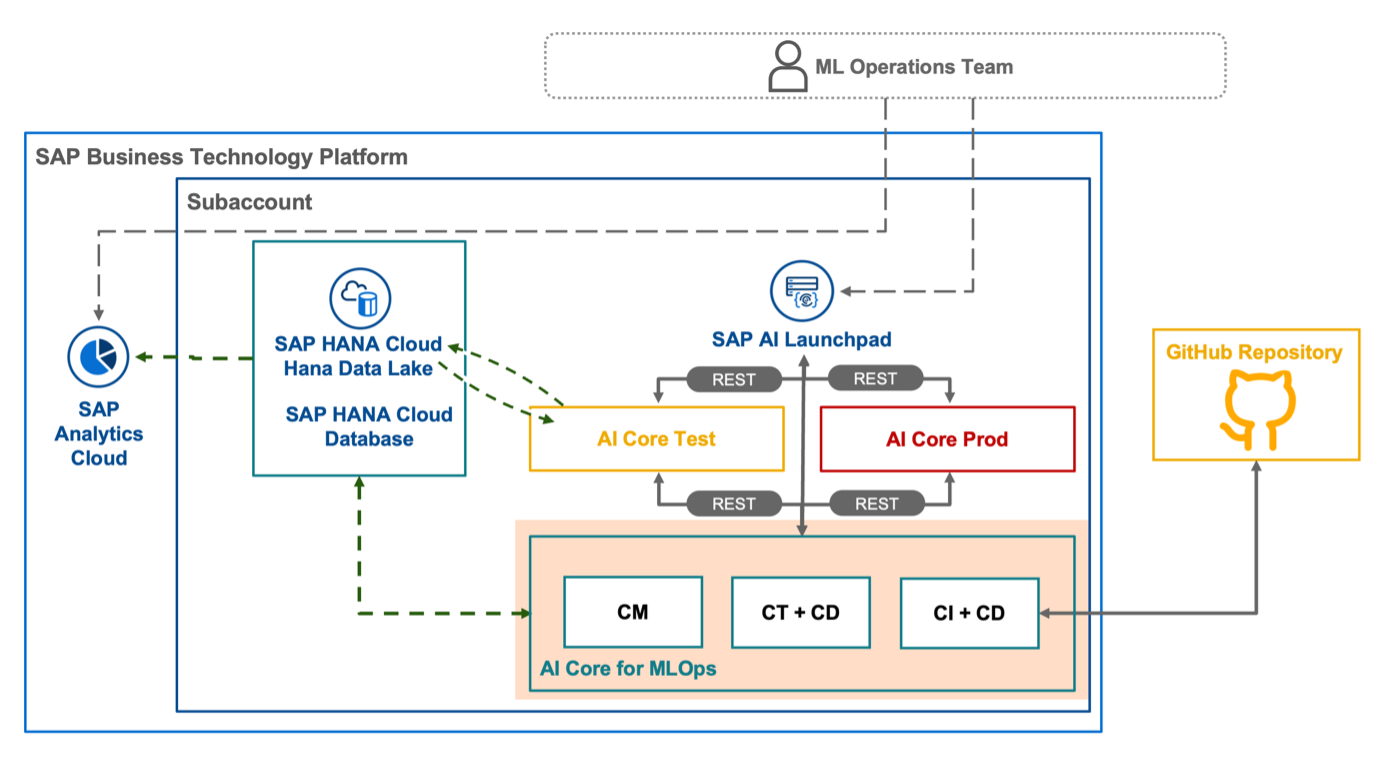
Fig. 8: Focus on the MLOps architecture.
So the idea is to run the code developed for implementing CM, CT+CD and CI+CD in a specific AI Core instance or a dedicated resource group. But what are the benefits to use the AI Core as a runtime also for the MLOps pipelines?
This approach avoids to introduce additional products in your landscape and allows to manage the ML solution and the MLOps infrastructure from AI Core, so that your assets are not scattered here and there. Moreover, this choice allows to monitor everything from AI Launchpad, this means you don't need to spend time to develop a UI (see Fig. 9).

Fig. 9: Scenarios created in AI Core for the ML solution and the MLOps infrastructure.
For example, if you have only one AI Core instance in your subaccount you can see the ML solution and the MLOps infrastructure scenarios side by side both accessible from the same AI Launchpad window. Moreover the logs of the pipeline executions can be checked by means of AI Launchpad (see Fig. 10).

Fig. 10: Logs related to an execution in AI Launchpad.
Now let's see how we can execute these pipelines in AI Core. Let’s refer to the animation below (Fig. 11).

Fig. 11: Workflow for executing the MLOps pipeline in AI Core.
Also in this case everything starts with having a piece of code for every pipeline, for example written in Python.
Let’s start discussing the CM pipeline first. We need to "dockerize" the relative code and put it into Docker registry. Then we need to create a template for the Continuous Monitoring pipeline that will instruct AI Core about how to run it. Then AI Core aligns to the configuration described in the template and the CM is ready to be executed. So implicitly here we are saying that the Continuous Monitoring pipeline can be treated as an execution within a AI Core.
For this execution we need to provide the new data that we would like to score. This data can be stored in the storage element that we've decided to use for the solution. In our prototype it is an S3 bucket, but it can be any other object store or HANA Data Lake Files. Please, note that from AI Launchpad we can start an execution manually, or we can also schedule it by means of the available scheduler. In both the cases we can easily follow the execution from the logs.
We can do something similar also for the Continuous Training and Continuous Deployment pipeline. So we write the code in Python, we create a Docker image and then we create another template specific to this pipeline. Also the CT/CD pipeline is treated like an execution in AI Core. For this execution we need to provide a dataset for the retraining of the model and another one for testing it once the training is completed. The output of this execution is a new predictive model for our pipeline corrosion that the Continuous Deployment will take care of deploying into the production environment.
The situation is slighlty different for the Continuous Integration and Continuous Deployment pipeline. Why? Because the CI part needs to be implemented so that it is able to listen constantly to the notifications of changes applied to the ML solution components in the GitHub repository. This means we need to write the code not only for the pipeline, but also for a microservice that will serve it, similarly to what we have done for deploying the pipeline corrosion model.
We need to create another template for the CI/CD pipeline, this time this template will be a serving template for the reasons I have explained few seconds ago. And once AI Core is aligned to the specifications of the template, everything is ready to start our server that will catch any change applied to the ML solution in the GitHub repository.
Continuous Monitoring: workflow and demo
Let's now take a closer look at individual pipelines and the types of events that can trigger them. Let's start with Continuous Monitoring (see Fig. 12 and 13).
We have seen that in our storyline the new data can come from the IoT devices and also from the measurements of the field technicians. This data is stored in a storage element, for example an S3 bucket. Our Continuous Monitoring pipeline will check this bucket regularly looking for new data, for instance in the form of csv files. Once it finds new files, it will proceed with scoring these data by consuming the pipeline corrosion model deployed in production.

Fig. 12: Workflow of the Continuous Monitoring pipeline.
Since the ground truth is available, it is possible to make a comparison with the predictions and if a performance degradation is identified, then a notification is sent by email to the MLOps team and then automatically or manually, the Continuous Training pipeline is activated.
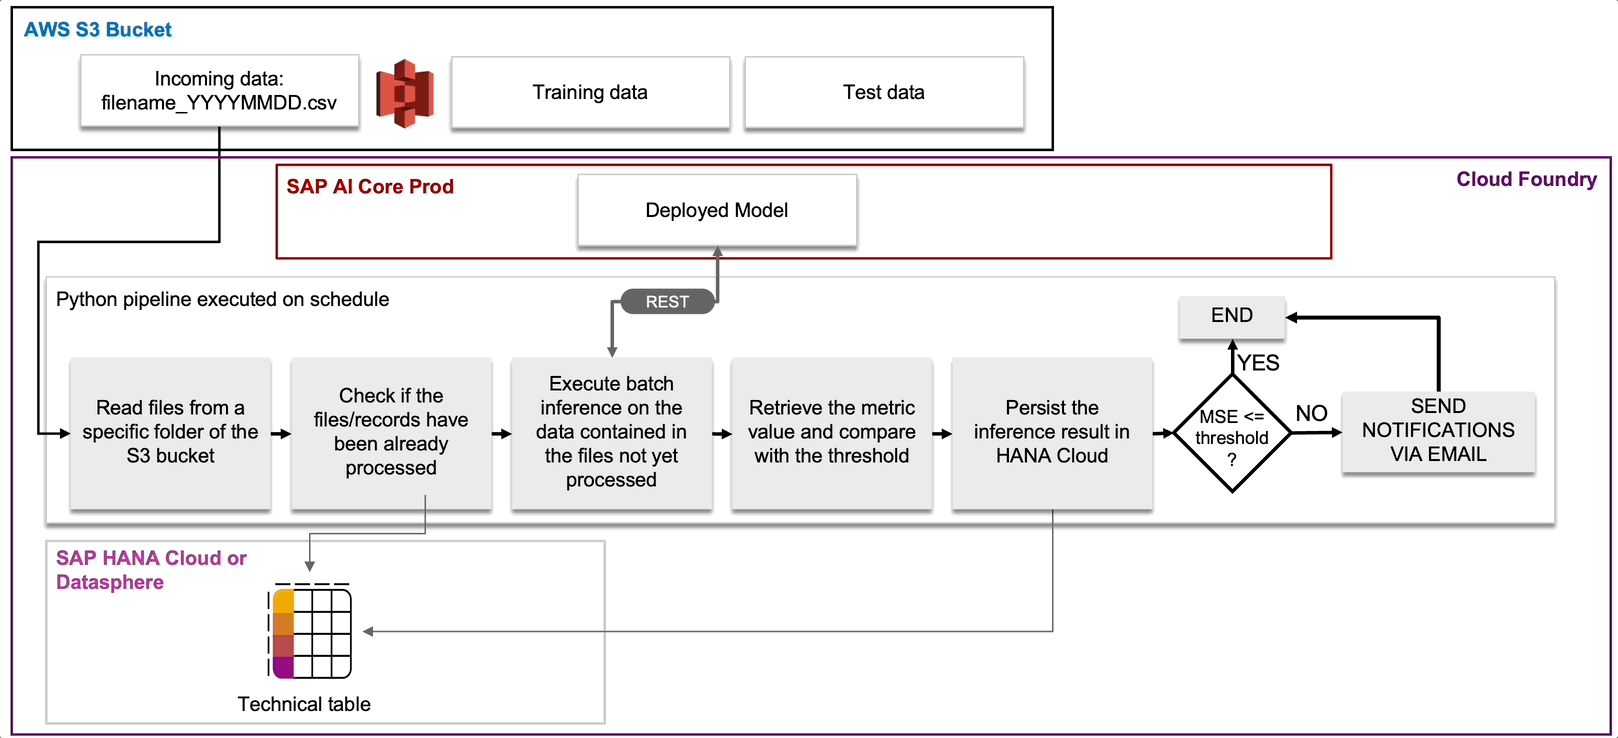
Fig. 13: Design of the Continuous Monitoring pipeline.
Before proceeding to the Continuous Training part, let’s see in the following video how the CM pipeline works.
Continuous Training and Continuous Deployment: workflow and demo
What happens when a degradation is identified by the CM pipeline? The MLOps team can manually require a retraining of the pipeline corrosion model by triggering the Continuous Training pipeline (see Fig. 14).
This continuous training will execute a new re-training of the model with an input dataset that now includes also the new data.

Fig. 14: Workflow of the CT/CD pipeline.
You can have a look at the main operations the CT/CD pipeline will execute in the AI Core test instance in the animation below (Fig. 15).

Fig. 15: Design of the CT/CD pipeline.
If the CT pipeline is completed without errors, then the continuous deployment pipeline is activated and then this pipeline will basically bring the new trained model in production, updating the existing deployment.
You can take a more in-depth look at the code developed for the CT/CD pipeline and the initial steps needed to run it in AI Core by watching the following video.
In the next video you can see how you can follow the steps of a CT/CD pipeline run from AI Launchpad. Note that for simplicity, we only used one AI Core instance in this video, and the pipeline corrosion predictive model is deployed in a resource group called “dev”. Additionally, CT/CD pipeline operations run within the same resource group. In real life projects it is good practice to have a separation into different resource groups or AI Core instances as explained above.
Continuous Integration and Continuous Deployment: workflow and hints on the implementation
Let’s see now how the CI/CD pipeline works and the events that can trigger it.
Let’s imagine that data scientists and machine learning engineers commit changes into the GitHub repository touching the components of the pipeline corrosion solution, for instance the training part or the serving application or both.
This operation triggers the Continuous Integration pipeline that will build new Docker images for the training and serving parts and it will execute several tests and operations in the AI Core test environment (see Fig. 16).

Fig. 16: Workflow of the CI/CD pipeline.
If everything goes well, then again the Continuous Deployment pipeline is triggered and then all the changes are brought in production where, for example, a new deployment is started.
But what do we need to develop also the CI/CD pipeline?If you have already developed the Continuous Training and Continuous Deployment pipeline, you probably have almost all that you need. What is missing is the part concerning the build and load of the new Docker images (see Fig. 17).
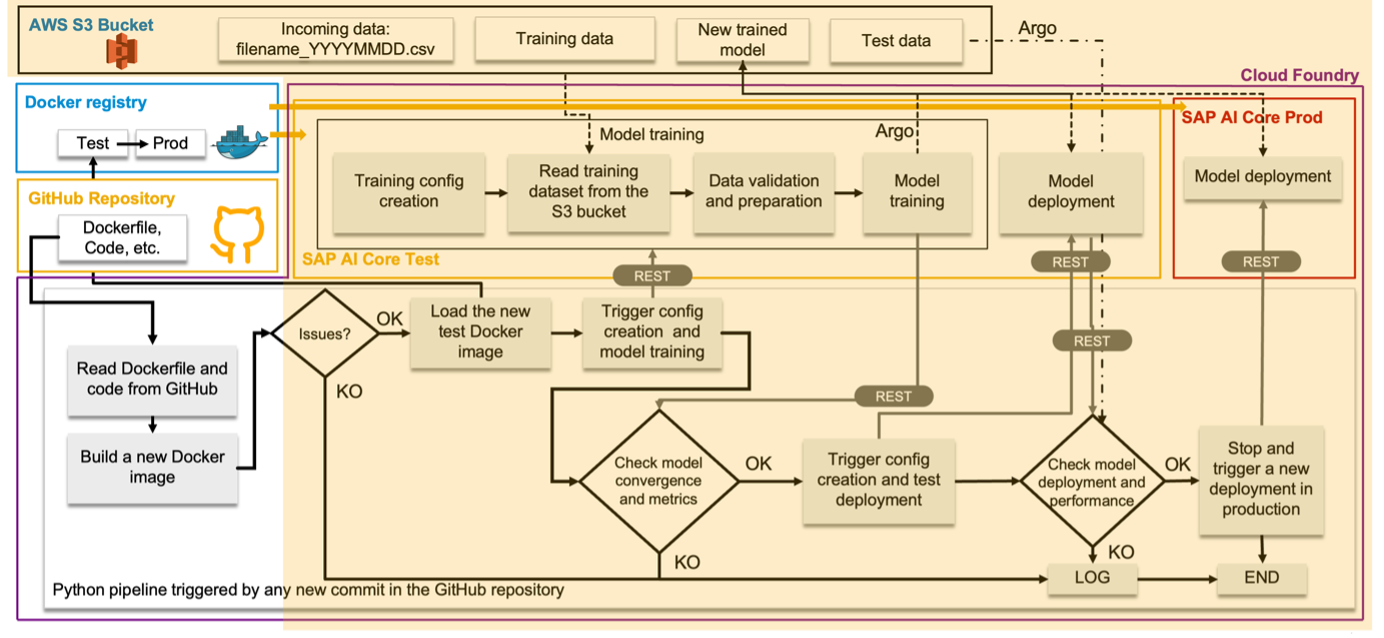
Fig. 17: Design of the CI/CD pipeline (in yellow the part that can be inherited from the CT/CD pipeline).
As we said before, the CI part needs to be implemented so that it is able to listen constantly to the notifications of changes applied to the ML solution components in the GitHub repository. This means we need to write the code not only for the pipeline, but also for a microservice that will serve it and that will manage the notifications coming from GitHub through an exposed endpoint (see Fig. 18).

Fig. 18: Webhook setup in GitHub (left) and code example for the CI/CD serving application (right).
Once we have developed the server, we need to work also on the GitHub side where we need to setup a webhook. We need to provide the URL where the POST requests will be sent and we need to specify which kind of events we want to be notified about. Once we have done this, we can receive the notifications we need and they will trigger the CI/CD pipeline under the hood.
Final considerations about CI/CD
To complete the discussion on CI/CD, it is worth saying a few words about the interaction between the versioning system, for example GitHub, the developers, and AI Core that you might need to implement in a real-world scenario.
Let's refer to Fig. 19. In general, we can imagine that developers work with Jupyter or an IDE like Visual Studio and do their experiments in an AI Core development instance. We can also expect them to push their new developments into a GitHub dev branch from time to time. Once the developers are done, from this branch they can send a pull request (PR) with the new developments to the GitHub branch that hosts al. According to MLOps requirements, this PR cannot be accepted immediately, but should trigger the Continuous Integration pipeline in an AI Core test instance (as described in the previous paragraph).
If the CI pipeline completes without errors, there are two possible scenarios that will take on two different names and meanings:
- Continuous Deployment: new developments are automatically brought into production and merged into the GitHub prod branch (this is the scenario we considered in the previous paragraph);
- Continuous Delivery: new developments are only merged into the GitHub prod branch, but nothing is deployed to the AI Core prod instance. Deployment will only occur at the end of the development cycle with all other changes.

Fig. 19: Interaction between the versioning system, the developers, and AI Core.
Conclusions
In this blog post we learned how critical it is to maintain the integrity of pipelines for the Oil & Gas industry and how difficult it can be to assess the corrosion depth at any point in the grid. So difficult, expensive, time-consuming and sometimes so dangerous for the field technicians that the only way to address this challenge is to leverage artificial intelligence. But we have seen how we can help with SAP BTP that provides all the needed tools to develop an intelligent business solution to predict corrosion depth and perform many other tasks such as optimizing a maintenance program. Furthermore, we have also seen how SAP BTP can be used to build and execute the automation required by MLOps requirements to keep the solution in production. What we have explained here with this specific and real-world use case can be inspiring and reusable for many other scenarios, especially when you need to setup an MLOps infrastructure for an AI-based solution. What we have developed for this proof-of-concept can be find at this link.
Links
Use case GitHub repository:
Oil & Gas industry
- Visualizing Future Pipeline Projects Around the World
- Corrosion monitoring in piping systems
- The Oil and Gas Industry in Energy Transitions
- Performance of European cross-country oil pipelines
Papers
- A Data-Driven Machine Learning Approach for Corrosion Risk Assessment—A Comparative Study
- A Review On Pipeline Condition Prediction Methods
- Data-Driven Models for Forecasting Failure Modes in Oil and Gas Pipes
- Predictive Modelling of Internal Pitting Corrosion of Aged Non-Piggable Pipelines
- Applications of machine learning in pipeline integrity management: A state-of-the-art review
- Reviewing machine learning of corrosion prediction in a data-oriented perspective
MLOps
- How to build a CI/CD pipeline with GitHub Actions in four simple steps
- MLOps: Continuous delivery and automation pipelines in machine learning
- CRISP-ML(Q). The ML Lifecycle Process.
- A Gentle Introduction to MLOps
- MLOps Principles
- CI/CD: The what, why and how
Data Science
- Gradient Boosting regression
- How XGBoost Works
- How to Listen for Webhooks with Python
- Complete Machine Learning Guide to Parameter Tuning in Gradient Boosting (GBM) in Python
- MAE, MSE, RMSE, Coefficient of Determination, Adjusted R Squared — Which Metric is Better?
SAP Asset Process Management
- SAP Asset Performance Management
- Comprehensive View of SAP Asset Performance Management Integration
- Introducing SAP Asset Performance Management
- Converge Asset Strategy and Maintenance Execution with SAP Asset Performance Management
SAP Datasphere
SAP AI Core and AI Launchpad
SAP Analytics Cloud
- SAP Managed Tags:
- SAP Analytics Cloud,
- SAP Datasphere,
- Artificial Intelligence,
- SAP AI Core,
- SAP AI Launchpad,
- Sustainability
Labels:
You must be a registered user to add a comment. If you've already registered, sign in. Otherwise, register and sign in.
Labels in this area
-
ABAP CDS Views - CDC (Change Data Capture)
2 -
AI
1 -
Analyze Workload Data
1 -
BTP
1 -
Business and IT Integration
2 -
Business application stu
1 -
Business Technology Platform
1 -
Business Trends
1,658 -
Business Trends
112 -
CAP
1 -
cf
1 -
Cloud Foundry
1 -
Confluent
1 -
Customer COE Basics and Fundamentals
1 -
Customer COE Latest and Greatest
3 -
Customer Data Browser app
1 -
Data Analysis Tool
1 -
data migration
1 -
data transfer
1 -
Datasphere
2 -
Event Information
1,400 -
Event Information
74 -
Expert
1 -
Expert Insights
177 -
Expert Insights
348 -
General
1 -
Google cloud
1 -
Google Next'24
1 -
GraphQL
1 -
Kafka
1 -
Life at SAP
780 -
Life at SAP
14 -
Migrate your Data App
1 -
MTA
1 -
Network Performance Analysis
1 -
NodeJS
1 -
PDF
1 -
POC
1 -
Product Updates
4,575 -
Product Updates
392 -
Replication Flow
1 -
REST API
1 -
RisewithSAP
1 -
SAP BTP
1 -
SAP BTP Cloud Foundry
1 -
SAP Cloud ALM
1 -
SAP Cloud Application Programming Model
1 -
SAP Datasphere
2 -
SAP S4HANA Cloud
1 -
SAP S4HANA Migration Cockpit
1 -
Technology Updates
6,871 -
Technology Updates
484 -
Workload Fluctuations
1
Related Content
- Unlocking the Potential of Business AI: Engineering Best Practices in Technology Blogs by SAP
- UI5 10 year anniversary - what's my story? in Technology Blogs by Members
- RingFencing & DeCoupling S/4HANA with Enterprise Blockchain and SAP BTP - Ultimate Cyber Security 🚀 in Technology Blogs by Members
- Adding Custom Fields to Standard Fiori App of S/4HANA in Technology Blogs by Members
- How to Implement a Dropdown Menu with Buttons in Object Page Using Fiori Elements and CDS Annotation in Technology Q&A
Top kudoed authors
| User | Count |
|---|---|
| 14 | |
| 11 | |
| 10 | |
| 10 | |
| 9 | |
| 8 | |
| 8 | |
| 8 | |
| 7 | |
| 7 |