In the previous articles we configured the setup for being able to use the blending capabilities of SAP Analytics Cloud. So now, lets put this to work.
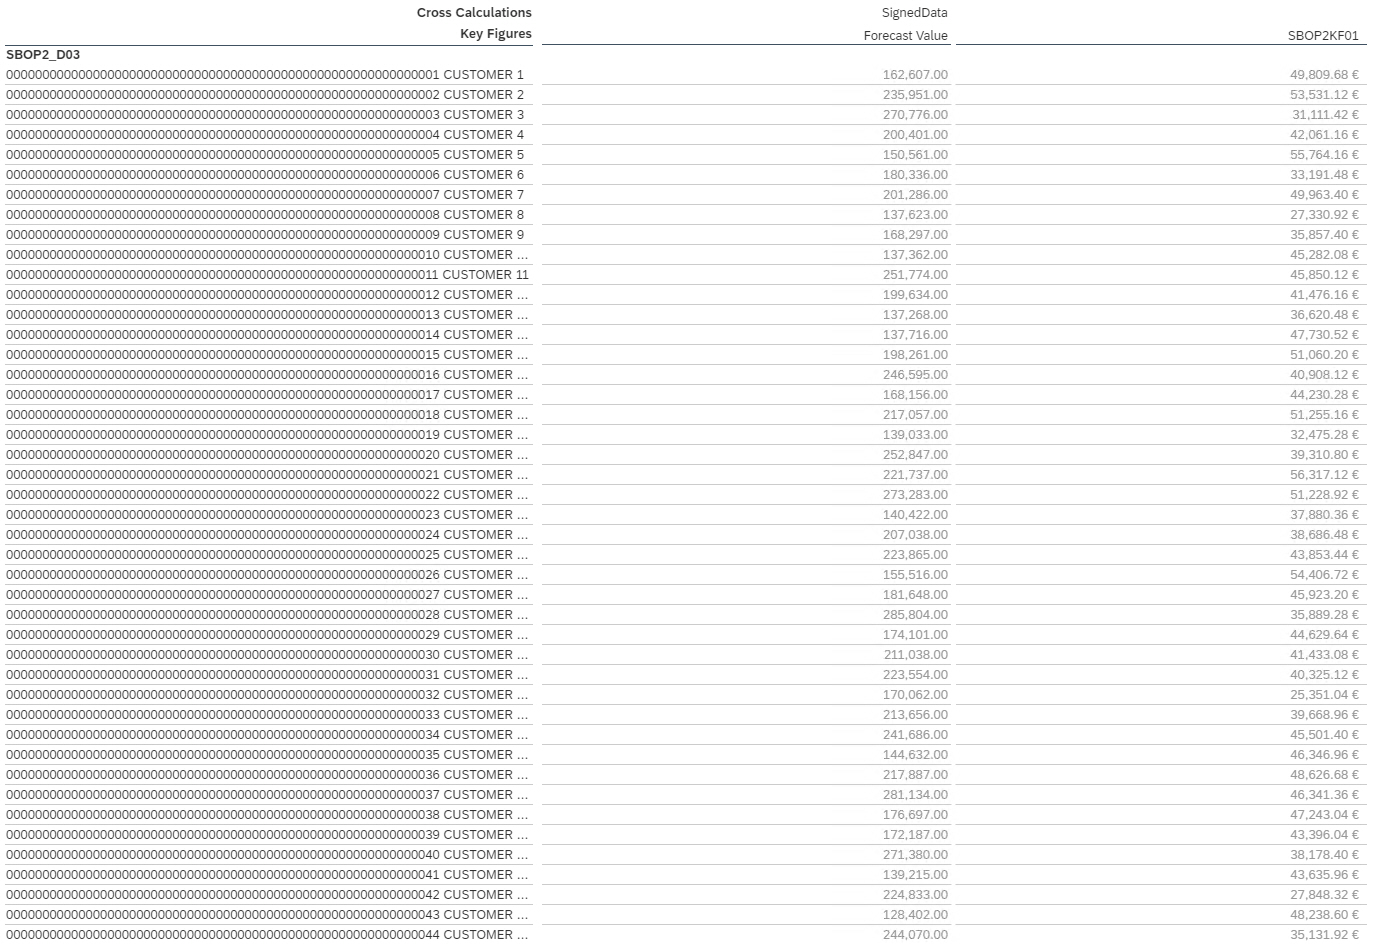
In our Example, we have a BW Query, which will return a set of measures by Customer or Product as shown below.

We also have a Excel spreadsheet with values by customer ID

In SAP Analytics Cloud we do have the model based on the SAP BW Query, so we can start building our Story with the first table showing the results from our BW Query as shown above.
We then use the "Data" option in the toolbar...

... and we list the data sources and we can then use the option to add a new data set to our story.

We then have the option to upload our Excel spreadsheet.

After the data is loaded we are presented with the raw information and we can configure our Dimensions and measures and then navigate back to our Story.
Now we have two data sets in our story and we need to setup the Linked Dimensions.

In the Linked Dimension configuration we can now define, how our two data sources are going to be joined.

In our example we see the dimensions from the BW Query on the left hand side and the columns from the Excel spreadsheet on the right hand side.
We select dimension Sold-to-Party from the BW Query and then we make sure that the linking will be done using the ID.

We then select the Customer ID from the Excel spreadsheet. You can also look at some sample data for each of the data sources, which comes in very helpful.

In our example we are using the dimension Sold-to-Party, which is a dimension type CHAR with a conversion routine in SAP BW. When looking at the sample data....

... we can see that SAP Analytics Cloud is not using the Key value for the linking, but instead uses the internal key value - which in this example comes with leading zeros for the full length of the dimension definition.
Please note, that the linking of the values is done on the internal key values in case of the BW Live connection, not the key value that you are seeing displayed in the table.
As of now (November 2019) you don't have the option to choose between the different key values, nor do you have the option to create a formula on top of the value (for example to remove the zeros), so in our example we have to add the leading zeros to the customer number in our Excel spreadsheet.
In our example I included a second column with the adjusted Customer ID value, so I will use that for the linking.
After the linking has been defined I am navigating back to the table and open the builder panel.

Click on the option "Add Linked Models" and select the model based on the Excel spreadsheet.
After doing so, I can navigate to the columns part of the table in the Builder Panel and I am offered both models for selecting measures.

.. and my table then shows measures from both data sources.
Another important configuration as part of the blending, is the ability to choose the join type. When you navigate back to the Builder Panel, you can navigate to your linked model and configure the Link Type and the active linked dimensions.

Happy Blending ...
SAP Analytics Cloud – Blending information (Part 1)
SAP Analytics Cloud – Blending information (Part 2)
SAP Analytics Cloud – Blending information (Part 3)
SAP Analytics Cloud - Blending Example
