- SAP Community
- Products and Technology
- Technology
- Technology Blogs by SAP
- Workload Analysis for HANA Platform Series - 3. Id...
- Subscribe to RSS Feed
- Mark as New
- Mark as Read
- Bookmark
- Subscribe
- Printer Friendly Page
- Report Inappropriate Content
Grasping the SAP HANA Memory Components
Effective memory consumption analysis in SAP HANA begins with a thorough understanding of its memory components. SAP HANA's memory architecture comprises various elements, each with distinct functions or usage patterns, as detailed in SAP Note 1999997 - FAQ: SAP HANA Memory. In this article, we concentrate specifically on memory utilized by HANA services.
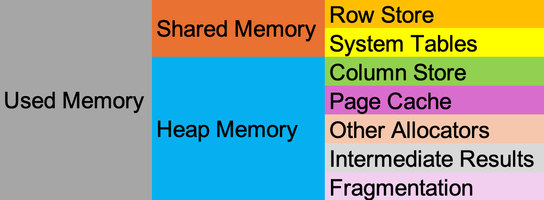
SAP HANA's used memory is primarily categorized into shared memory and heap memory. Shared memory stores system information and row store tables. Typically, shared memory poses minimal performance risks. However, exceptions occur, such as in BW on HANA systems with extensive row store tables, where excessive shared memory usage might trigger frequent out-of-memory dumps.
Heap memory, on the other hand, is an exclusive domain accessible only by a process's threads. This segment is our primary focus, as significant fluctuations in heap memory often correlate with performance issues and system instability. Identifying workload patterns here is crucial, particularly when a single costly statement or an impractical parameter (e.g., inefficient memory garbage collection) exists without appropriate workload management strategies (like workload classes). Understanding heap memory intricacies is thus imperative.
Within heap memory, our primary concerns include, but are not limited to:
- Column Store
- Page Cache
- Other Heap Allocators
- Intermediate Results
- Fragmentation
Initiating Memory Consumption Analysis in SAP HANA
Having familiarized ourselves with SAP HANA's memory components, the next step is to pinpoint potential causes of high memory usage across these components, aligning this investigation with workload patterns, particularly in heap memory. Let's delve deeper into each sub-component:
- In optimally configured systems, the column store often occupies about half of the heap memory. Implementing a sensible data retention policy helps maintain stability in this area. However, challenges like uncontrolled table logs, redundant data, and inadequate partitions leading to excessive memory loads often inflate the column store's size.
- A disproportionately large page allocator typically signals an overextended child allocator, such as page caches. Identifying and optimizing the underlying child allocator is crucial. For instance, size of page allocator "Pool/PersistenceManager/PersistentSpace/DefaultLPA" significantly impacted by page caches, including data, LOB, or shadow pages. Proper table sizing and specific settings (like file or hybrid LOBs) are key to managing this memory consumption.
- Analyzing other heap allocators and intermediate results is complex, as these areas are closely tied to costly statements and execution engines. SAP Note 1999997 - FAQ: SAP HANA Memory details frequent allocators, each providing unique insights. Some allocators point to potential performance issues, which are vital in workload analysis. However, linking high-memory allocators to specific expensive statements can be challenging, as their behavior often results from multiple combined statements.
- Memory fragmentation is a common occurrence in HANA systems, but its extent requires careful monitoring. Long-running jobs or increased MVCC versions can hinder garbage collection, leading to continuous memory increase without proper reclamation.
- Row stores play a pivotal role in BW on HANA systems. While converting some BW tables from column store to row store might be advantageous, this needs to be judiciously executed. Excessive or oversized row store tables can severely impact heap memory, potentially triggering out-of-memory dumps during job execution. This is because row store tables require full memory loading, unlike column store tables, which load selectively based on pages, columns, or partitions.
Tools for Identifying SAP HANA Memory Patterns
To effectively diagnose memory-related issues in SAP HANA, a variety of tools are at our disposal. While not every situation may be straightforwardly deciphered through these tools, their usage is a critical first step in understanding and addressing potential problems.
Begin with memory-related system views for an initial assessment. These views provide a snapshot of the current memory status:
- HANA_Memory_Caches_Overview: Offers an overview of memory caches.
- HANA_Memory_ContextMemory: Details memory within specific contexts.
- HANA_Memory_Components: Breaks down memory by individual components.
- HANA_Memory_MemoryObjects: Lists various memory objects.
- HANA_Memory_Overview: Gives a comprehensive view of memory usage.
For analyzing workload over a specific period, the following system monitoring views are invaluable for capturing historical data:
- HANA_Memory_Heap_Allocations: Tracks heap memory allocations.
- HANA_Memory_Reclaims: Details memory reclamation events.
- HANA_Memory_TopConsumers: Identifies the top memory consumers.
- HANA_Memory_OutOfMemoryEvents: Records out-of-memory events.
- HANA_SQL_SQLCache: Monitors SQL cache usage.
- HANA_SQL_ExpensiveStatements: Lists costly SQL statements.
Some monitoring views may not provide direct insights into memory components but are crucial for uncovering underlying memory consumption and related issues:
- HOST_SERVICE_THREAD_SAMPLES: Analyzes thread samples on the host.
- HOST_LONG_RUNNING_STATEMENTS: Identifies long-running SQL statements.
- TABLE_PARTITIONS: Reviews table partition details.
- HOST_SERVICE_THREAD_CALLSTACKS: Examines call stacks of service threads.
In the following section, I will present two case studies demonstrating how these tools can be used to identify memory patterns, along with root causes and solutions for common scenarios in SAP HANA.
Analyzing Memory Consumption Issues: Two Practical Examples
Example 1: Analyzing Memory Component Patterns
In SAP HANA memory analysis, the initial step often involves examining the top memory consumers. This is crucial when addressing memory issues or analyzing memory patterns. Let's explore this process with an example, focusing on high-level and detailed components.
Level 1 Memory Usage Analysis
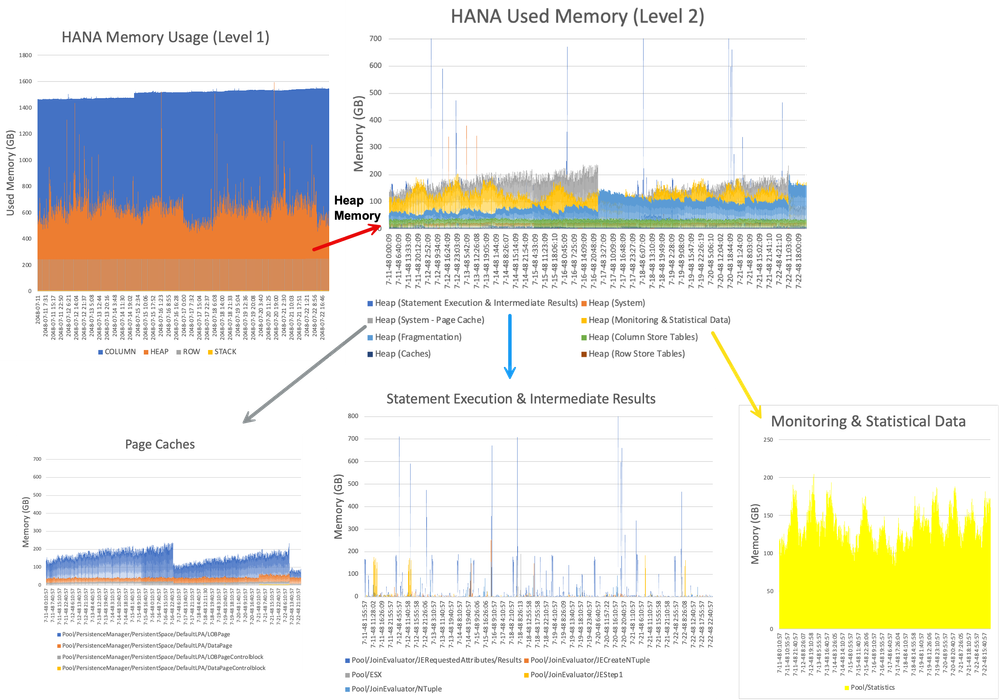
First, we assess the highest level of memory usage. In our demo system, we observed that the column store is a primary memory consumer, reaching approximately 1,500 GB with a continuous growth over a month. The next significant component is heap memory, fluctuating between 500 GB and 1,600 GB. Although heap memory is smaller than the column store in the above example, it demands close attention due to its potential for large consumption variations and complex underlying causes. In this system, row store also holds a significant size (around 200 GB), which, while not critical, should be monitored for growth.
Diving into Level 2 Components
Upon delving into heap memory, we identify sub-components that contribute notably to memory consumption or exhibit significant fluctuations. In this instance, the sub-components 'Heap (Statement Execution & Intermediate Results)', 'Heap (System - Page Cache)', and 'Heap (Monitoring & Statistical data)' are of particular interest. They showed substantial growth or wide-ranging memory consumption over the observed month, signalling potential areas for deeper analysis.
Zooming in on Specific Sub-Components
Further dissecting these level 2 components, we find that 'Heap (System - Page Cache)', for example, is composed of various page caches like:
- Pool/PersistenceManager/PersistentSpace/DefaultLPA/LOBPage
- Pool/PersistenceManager/PersistentSpace/DefaultLPA/DataPage
- Pool/PersistenceManager/PersistentSpace/DefaultLPA/LOBPageControlblock
- Pool/PersistenceManager/PersistentSpace/DefaultLPA/DataPageControlblock
Understanding these detailed components is vital for pinpointing specific issues and guiding thorough analysis. In this case, a potential reason for high memory consumption might be tables with a large number of LOBs. Considering alternatives like hybrid LOBs or converting single file LOBs to packed LOBs could be effective strategies.
Compared to CPU utilization analysis, memory consumption analysis can be more challenging due to its complexity and the need to correlate memory components with specific queries. In our next example, we will explore techniques for capturing statement information and integrating it with memory consumption patterns.
Example 2: Identifying Memory Contributors in SAP HANA
Understanding the root causes of memory consumption is critical in SAP HANA. Often, expensive SQL statements are major contributors, influenced by factors like workload management methods, HANA engine usage, or logical design leading to substantial intermediate results. This analysis aims to pinpoint these contributors and their impact on memory.
When a statement is executed in HANA, it can be processed by different engines, such as the Join, OLAP, or HEX engines. This selection is based on various factors, including table size, partitions, and replicas. Each engine choice affects the behavior of the statement, including execution time, thread involvement, and heap memory consumption. While we won't delve deeply into engine selection, this information is key in tracing the source of high heap memory usage.
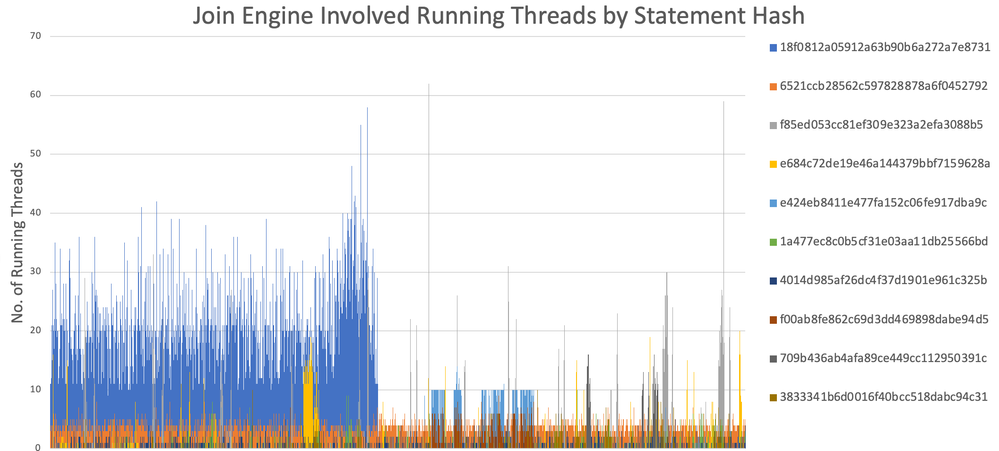
Data captured from HANA Service Thread Samples (Please refer to Define and Understand the Workload Pattern), filtered to include thread details with keywords like "JE(", reveals the HANA JOIN engine involved in specific statement executions. By cross-referencing this with top memory consumer data, we can sometimes identify if an expensive statement significantly contributes to heap memory allocation. Typical memory allocators to monitor include:
- Pool/JoinEvaluator/JERequestedAttributes/Results
- Pool/JoinEvaluator/JECreateNTuple
- Pool/JoinEvaluator/JEStep1
- Pool/JoinEvaluator/NTuple
- etc.
If these allocators show increased activity alongside expensive statement execution, they become potential candidates as major memory contributors. To confirm our findings, we should cross-check with other data sources as well, such as:
- HANA SQL CACHE
- HANA Expensive Statement Trace
- HANA Executed Statement Trace
It's important to note that a high number of running threads does not necessarily equate to significant memory usage. The focus should be on the statement itself and its actual memory impact.
While thread sample analysis is insightful, it’s just one method among many for memory pattern analysis in SAP HANA. We must remember that memory analysis within workload analysis is a vast and complex field.
Workload Analysis for HANA Platform Series
This blog post is part of the 'Workload Analysis for HANA Platform Series'. In upcoming posts, we will demonstrate how to analyze the issue related to CPU, threads and NUMA Node . Here's what you can look forward to in this series:
- 0. HANA Workload Analysis Overview
- 1. Define and Understand the Workload Pattern
- 2. Analyze the CPU, Threads and Numa Utilizations
- 3. Identify the Memory Consumption (This blog)
- 4. How the Network, I/O and locks influent the workload
- 5. Performance Impact by HANA Internal Functions
- 6. HANA Workload Management Methodology
Stay tuned as we explore these aspects in detail, providing insights and strategies to optimize your HANA environment.
You must be a registered user to add a comment. If you've already registered, sign in. Otherwise, register and sign in.
-
ABAP CDS Views - CDC (Change Data Capture)
2 -
AI
1 -
Analyze Workload Data
1 -
BTP
1 -
Business and IT Integration
2 -
Business application stu
1 -
Business Technology Platform
1 -
Business Trends
1,658 -
Business Trends
94 -
CAP
1 -
cf
1 -
Cloud Foundry
1 -
Confluent
1 -
Customer COE Basics and Fundamentals
1 -
Customer COE Latest and Greatest
3 -
Customer Data Browser app
1 -
Data Analysis Tool
1 -
data migration
1 -
data transfer
1 -
Datasphere
2 -
Event Information
1,400 -
Event Information
67 -
Expert
1 -
Expert Insights
177 -
Expert Insights
307 -
General
1 -
Google cloud
1 -
Google Next'24
1 -
GraphQL
1 -
Kafka
1 -
Life at SAP
780 -
Life at SAP
13 -
Migrate your Data App
1 -
MTA
1 -
Network Performance Analysis
1 -
NodeJS
1 -
PDF
1 -
POC
1 -
Product Updates
4,576 -
Product Updates
349 -
Replication Flow
1 -
REST API
1 -
RisewithSAP
1 -
SAP BTP
1 -
SAP BTP Cloud Foundry
1 -
SAP Cloud ALM
1 -
SAP Cloud Application Programming Model
1 -
SAP Datasphere
2 -
SAP S4HANA Cloud
1 -
SAP S4HANA Migration Cockpit
1 -
Technology Updates
6,873 -
Technology Updates
435 -
Workload Fluctuations
1
- SAP BTP Innobytes – April 2024 in Technology Blogs by SAP
- The 2024 Developer Insights Survey: The Report in Technology Blogs by SAP
- SAP Datasphere + SAP S/4HANA: Your Guide to Seamless Data Integration in Technology Blogs by SAP
- Introducing the New E-learning ‘Clean Core with SAP Business Technology Platform’ in Technology Blogs by SAP
- Onboarding Users in SAP Quality Issue Resolution in Technology Blogs by SAP
| User | Count |
|---|---|
| 26 | |
| 20 | |
| 12 | |
| 11 | |
| 9 | |
| 9 | |
| 8 | |
| 8 | |
| 7 | |
| 7 |


