- SAP Community
- Products and Technology
- Technology
- Technology Blogs by SAP
- Workload Analysis for HANA Platform Series - 2. An...
- Subscribe to RSS Feed
- Mark as New
- Mark as Read
- Bookmark
- Subscribe
- Printer Friendly Page
- Report Inappropriate Content
In the previous blog, we had discussed the workload pattern. This blog dissects how the CPU, threads and NUMA related topic will influence the workload, and how to figure out the most useful information through the workload analysis. The conclusion can be used for further tuning the HANA system into a good shape on CPU resources consumption.
How to Begin with CPU Utilization Analysis
The analysis of CPU utilization stands as a key element within the broader scope of workload analysis. Determining the right approach to analyze CPU usage is crucial. It's essential to first identify the type of CPU utilization that may be problematic—be it user CPU utilization within the HANA instance, system CPU utilization governed by the OS, or a combination of both. A clear understanding of this distinction is necessary to properly address the issue.
Should the user CPU utilization be significant, it would be prudent to delve into thread information to gain insights into ongoing processes. Conversely, if the focus is on system CPU utilization from the OS, gathering thread data alongside call stack histories is advisable. Collaboration with the OS Administrator might also be necessary to investigate any scheduled jobs or activities that coincide with peak usage times.
In this blog, our primary focus is on user CPU utilization, which is directly impacted by the workload within the HANA instance. A valuable starting point for gaining deeper insights is to analyze thread samples. The monitoring views pertinent to this are:
- HOST_SERVICE_THREAD_SAMPLES View (Embedded Statistics Service) | SAP Help Portal
- M_SERVICE_THREAD_SAMPLES System View | SAP Help Portal
Although both views contain very similar data, for the purpose of workload analysis, we particularly concentrate on specific columns within these views:
HOST | VARCHAR(64) | Displays the host name. |
TIMESTAMP | TIMESTAMP | Displays the timestamp of the record. |
THREAD_TYPE | VARCHAR(128) | Displays the thread type. |
THREAD_METHOD | VARCHAR(256) | Displays the thread method. |
THREAD_DETAIL | NVARCHAR(256) | Displays the thread detail (truncated). |
THREAD_STATE | VARCHAR(32) | Displays the thread state. |
STATEMENT_HASH | VARCHAR(32) | Displays the unique identifier for an SQL string. |
ROOT_STATEMENT_HASH | VARCHAR(32) | Displays the MD5 hash value for the root statement string. |
USER_NAME | NVARCHAR(256) | Displays the SQL user name. |
APPLICATION_NAME | NVARCHAR(256) | Displays the name of the application. |
APPLICATION_USER_NAME | NVARCHAR(256) | Displays the application user name. |
APPLICATION_SOURCE | NVARCHAR(256) | Displays that the application can define which source file SAP HANA is called from. The usage is up to the application. This value is also displayed in M_PREPARED_STATEMENTS.APPLICATION_SOURCE. |
STATEMENT_THREAD_LIMIT | INTEGER | Displays the effective statement thread limit. |
STATEMENT_MEMORY_LIMIT | INTEGER | Displays the effective statement memory limit. |
PASSPORT_COMPONENT_NAME | NVARCHAR(32) | Displays the passport component name. |
PASSPORT_ACTION | NVARCHAR(40) | Displays the passport action. |
NUMA_NODE_INDEX | SMALLINT | Displays the last known NUMA node that the thread was executed on. |
WORKLOAD_CLASS_NAME | NVARCHAR(256) | Displays the name of the workload class. |
Considerations for CPU Utilization in HANA Workload Analysis
Now that we have the tools at our disposal, where should we initiate our analysis of CPU utilization? Addressing CPU usage within SAP HANA is multifaceted. A high CPU usage, peaking at 90% of total capacity—for instance, with 8 sockets, 208 CPU cores, and hyper-threading—suggests that approximately 374 threads (90% of 208 x 2 logical CPU cores) are active. This scenario often leads to system hang-ups and prevents new user connections. However, this is not the sole concern.
We also face perplexing situations where a mere 50% CPU utilization can cause similar system hang-ups, or times when the system appears idle yet experiences high system CPU utilization. Moreover, there are instances where a single statement monopolizes all threads despite workload classifications and global concurrency limits being in place.
To unravel these complexities, a thorough review of thread samples, supplemented by other monitoring views, is necessary for deeper insight into the system's behaviour.
Typically, the following factors can lead to CPU-related issues in a HANA system:
- OS configurations
- Expensive SQL statements alongside impractical concurrency settings
- Absence of secondary indexes on column tables
- NUMA node contentions
- System CPU utilization at the OS level
- Concurrency controls implemented by applications
- Conflicting schedules of background jobs
- Activities of the statistics server
- Admission control setting
- And more.
It's worth noting that high CPU usage doesn't inherently indicate a problem. At times, it may signify that the HANA system is effectively utilizing its capacity to handle the workload, which is not a concern. Our goal is to identify workload contributors to minimize CPU consumption and safeguard the system against potential future issues.
Analyzing CPU Utilization Issues: Two Practical Examples
In this section, we simulate two real-world scenarios to provide deeper insights into CPU utilization analysis in SAP HANA environments.
Before diving into the analysis of expensive statements, it's crucial to establish an understanding of the system's configuration that affects workload management. In the examples that we will explore, the system is equipped with :
- 8 sockets, and each socket houses 52 logical CPU cores.
- global.ini -> [execution] -> default_statement_concurrency_limit set to 12
- Admission control set to default (indexserver.ini -> [admission_control] -> queue_cpu_threshold = 90)
Example 1 - CPU Spikes Caused by Expensive Statements
Expensive statements in a database context typically refer to queries that run longer than anticipated or consume a significant amount of memory during execution. In the realm of workload analysis, especially concerning CPU consumption, we focus on those statements that utilize a large number of running threads. In our example, various types of statements have been identified that could potentially cause extremely high CPU utilization. These could be so intensive as to lead to system hang-ups.
This situation might involve complex join operations, extensive data aggregation, or poorly optimized queries that put a heavy load on the CPU. Identifying and optimizing these expensive statements is crucial to prevent CPU spikes and maintain system stability. This process involves analyzing query execution plans, reviewing indexing strategies, and possibly restructuring or simplifying the queries themselves to reduce their resource demands.
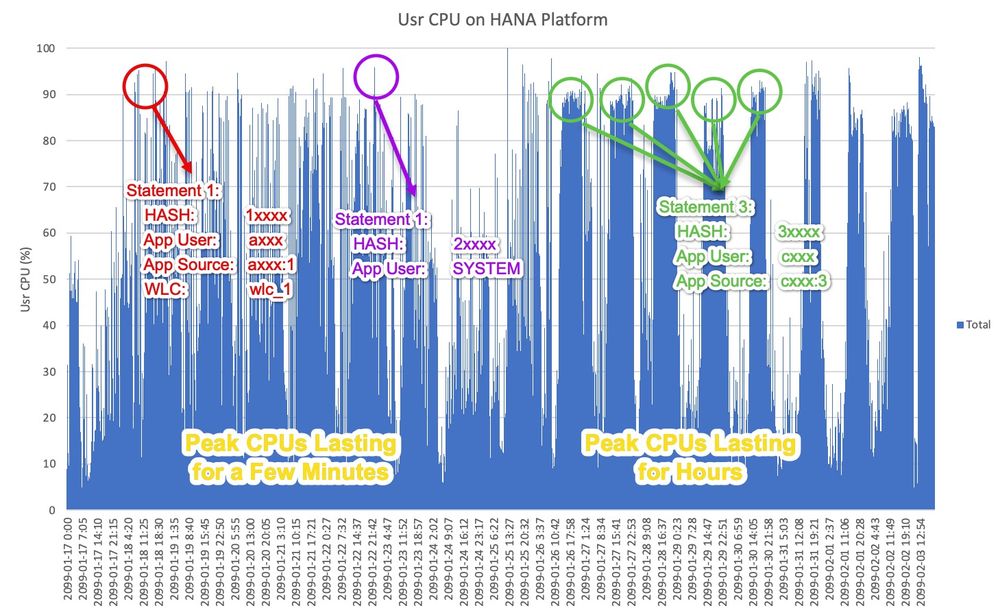
In the given example, we observe distinct CPU utilization patterns over a span of two weeks on the HANA platform, with utilization nearing 100%. The first week’s pattern is characterized by abrupt spikes in CPU usage, quickly rising and falling, whereas the second week displays more frequent and enduring peaks.
- Peak CPUs Lasting for a Few Minutes: Such short-term CPU spikes are not unusual in database environments. They typically arise from intensive data loading, execution of complex queries, or during routine operations like backups or batch processing. However, the spikes observed here warrant close examination due to their extreme frequency and high utilization rates, which could indicate underlying issues needing immediate attention.
- Peak CPUs Lasting for Hours: The prolonged CPU peaks, extending over several hours, present a more critical challenge. They could be symptomatic of deeper issues such as inefficient query design, absence of necessary secondary indexes, or even physical hardware constraints. Persistent high CPU utilization of this nature demands a comprehensive analysis to pinpoint the fundamental causes and to devise appropriate strategies for optimization and adjustment to prevent potential system degradation or failure.
- Statement 1: Executed by user axxx from application source axxx:1, this statement has been stable in production for years. Following a logical adjustment on the application side intended to enhance capacity during request processing, the number of connections initiated by this statement increased. Despite the implementation of a global statement concurrency parameter and a designated workload class, this statement alone occupied 90% of CPU resources when activated. The immediate solution is to curb the number of concurrent connections either at the application level or by refining the HANA workload class parameters. Specifically, adjusting the workload class "wlc_1" to impose a stricter statement concurrency limit is recommended, especially by employing the Hierarchies of Workload Classes feature available in HANA 2.0 SPS 6 and above.
- Statement 2: Run by the application user SYSTEM, this activity is associated with HANA's internal optimize compression function, which is automatically calculated and optimized as part of the delta merge operation. Historically, it has been challenging to restrict the CPU consumption of this process. However, with the introduction in HANA 2.0 SPS03, the parameter indexserver.ini -> [optimize_compression] -> row_order_optimizer_threads can now be set to a specific value to moderate the concurrency of this activity effectively.
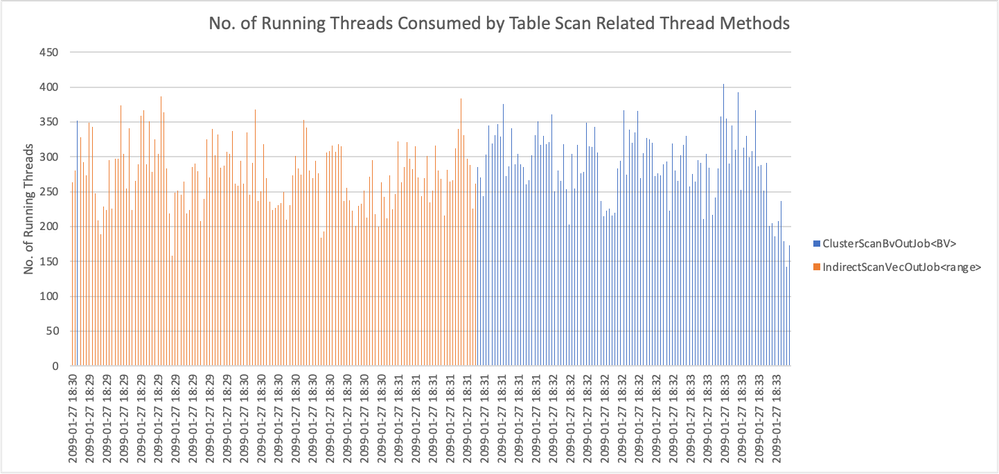
- Statement 3: A select statement executed by user cxxx and application source axxx:3, it has been noted for its prolonged execution time and exceptionally high CPU usage. Thread sampling revealed that most threads were engaged in "IndirectScanVecOutJob<range>" or "ClusterScanBvOutJob<BV>", indicative of extensive table scans. More information on thread methods related to table scans can be found in SAP Note 2114710 - FAQ: SAP HANA Threads and Thread Samples
- When look into the detail, we found that table MATDOC and MATDOC_EXTRACT, had lack of secondary index on the key column "MATNR" or "WERKS". Per seconds, the number of column scan can reach to 10 billions+, which is quite significant. Creating a secondary index on this key column should alleviate the CPU strain by optimizing the data retrieval process.
| TABLE_NAME | COLUMN_NAME | SCANNED_RECORDS | SCR_PER_S |
| MATDOC | MATNR | 828290874021485 | 19304757728 |
| MATDOC_EXTRACT | WERKS | 109487724317894 | 10032855641 |

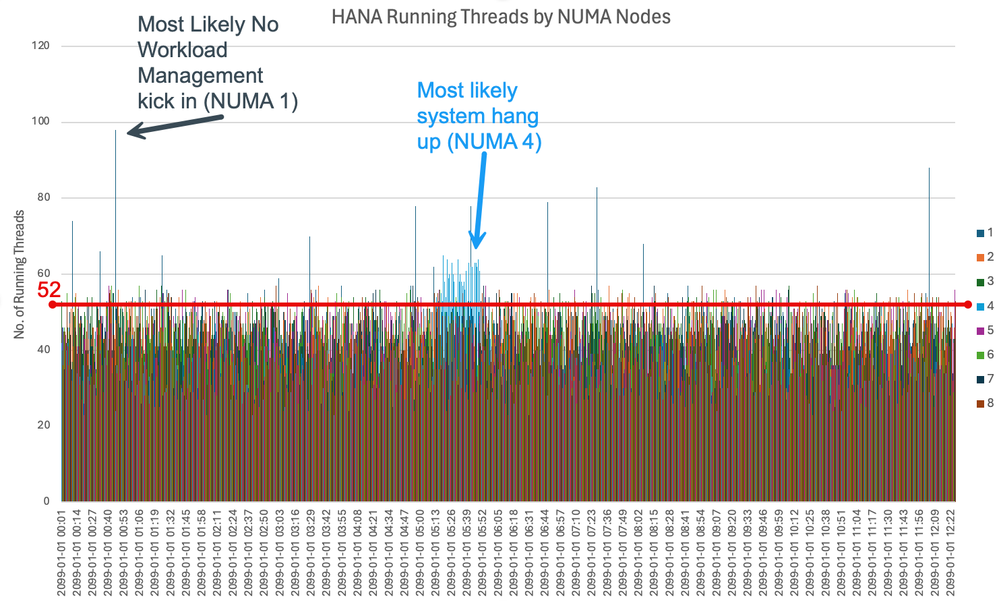
The chart offers a detailed view of the running threads across NUMA nodes in a HANA system equipped with 8 sockets, each hosting 52 logical CPUs. Here’s a refined analysis of the patterns observed and their potential implications:
- NUMA Node 4: The count of running threads frequently exceeds the threshold of 52, occasionally spiking to over 95. This pattern suggests excessive parallelism from specific statements or multiple statements accessing the same table or partition. These occurrences appear to bypass the constraints set by global parameters or workload classes, which either lack a total concurrency limit or have a single statement concurrency limit set too high. Such scenarios necessitate a review of the implicated statements to understand the cause of the surge in connections. Repartitioning tables may be beneficial, distributing data across partitions aligned with different NUMA nodes to balance the load. Moreover, the surges in thread count may be attributed to specific thread types like JobWorkers or SQLExecutors. A detailed statement-level investigation is warranted to identify and implement appropriate solutions.
- NUMA Node 4: There’s a significant, consistent surge that extends for 30 minutes, signalling NUMA node contention. This is a critical observation as it suggests that the transactions competing for memory resources within this node are likely causing system performance degradation or even system hangs. This could be due to a variety of factors such as the lack of secondary indexes which forces full table scans, or database operations, e.g. optimize compression, that have not been sufficiently controlled. Implementing limitations on internal job concurrency, as prescribed by HANA's configuration settings, might serve as a remedial measure.
- Across the remaining NUMA nodes, exceeding the 52-thread limit occasionally doesn’t necessarily indicate a problem; it may reflect the system making full use of the resources at its disposal, which is typically a positive scenario. Nevertheless, it is crucial to ensure that the workload is evenly distributed to prevent any single NUMA node from being overloaded while others are underutilized. Vigilant monitoring for NUMA contention is essential, particularly when the overall CPU capacity is not fully leveraged, to mitigate any adverse effects on system behaviour.
Utilizing Active/Active Read-Enabled (AARE) in SAP HANA can swiftly reduce CPU and memory usage on the primary site. By rerouting read operations to a secondary site—through hints in SQL, ABAP, Procedure or CDS views—resource consumption can be balanced without altering existing job logic. Monitoring the secondary site is vital to ensure it doesn't affect system replication performance. For details on AARE, refer to the official SAP documentation.
- Active/Active (Read Enabled) | SAP Help Portal
- 2732012 - Using Active/Active read enabled feature of SAP HANA in SAP S/4HANA Collective Note
- 2737255 - Limitations and Fallback Conditions of Statement Routing to a Read Enabled Secondary Syste...
Workload Analysis for HANA Platform Series
This blog post is part of the 'Workload Analysis for HANA Platform Series'. In upcoming posts, we will demonstrate how to analyze the issue related to CPU, threads and NUMA Node . Here's what you can look forward to in this series:
- 0. HANA Workload Analysis Overview
- 1. Define and Understand the Workload Pattern
- 2. Analyze the CPU, Threads and Numa Utilizations (This blog)
- 3. Identify the Memory Consumption
- 4. How the Network, I/O and locks influent the workload
- 5. Performance Impact by HANA Internal Functions
- 6. HANA Workload Management Methodology
Stay tuned as we explore these aspects in detail, providing insights and strategies to optimize your HANA environment.
- SAP Managed Tags:
- SAP HANA Cloud,
- SAP HANA Cloud, SAP HANA database,
- SAP HANA Enterprise Cloud,
- SAP HANA
You must be a registered user to add a comment. If you've already registered, sign in. Otherwise, register and sign in.
-
ABAP CDS Views - CDC (Change Data Capture)
2 -
AI
1 -
Analyze Workload Data
1 -
BTP
1 -
Business and IT Integration
2 -
Business application stu
1 -
Business Technology Platform
1 -
Business Trends
1,658 -
Business Trends
95 -
CAP
1 -
cf
1 -
Cloud Foundry
1 -
Confluent
1 -
Customer COE Basics and Fundamentals
1 -
Customer COE Latest and Greatest
3 -
Customer Data Browser app
1 -
Data Analysis Tool
1 -
data migration
1 -
data transfer
1 -
Datasphere
2 -
Event Information
1,400 -
Event Information
67 -
Expert
1 -
Expert Insights
177 -
Expert Insights
308 -
General
1 -
Google cloud
1 -
Google Next'24
1 -
GraphQL
1 -
Kafka
1 -
Life at SAP
780 -
Life at SAP
13 -
Migrate your Data App
1 -
MTA
1 -
Network Performance Analysis
1 -
NodeJS
1 -
PDF
1 -
POC
1 -
Product Updates
4,576 -
Product Updates
351 -
Replication Flow
1 -
REST API
1 -
RisewithSAP
1 -
SAP BTP
1 -
SAP BTP Cloud Foundry
1 -
SAP Cloud ALM
1 -
SAP Cloud Application Programming Model
1 -
SAP Datasphere
2 -
SAP S4HANA Cloud
1 -
SAP S4HANA Migration Cockpit
1 -
Technology Updates
6,873 -
Technology Updates
438 -
Workload Fluctuations
1
- SAP Datasphere + SAP S/4HANA: Your Guide to Seamless Data Integration in Technology Blogs by SAP
- SAP Signavio is the highest ranked Leader in the SPARK Matrix™ Digital Twin of an Organization (DTO) in Technology Blogs by SAP
- ABAP Cloud Developer Trial 2022 Available Now in Technology Blogs by SAP
- Hack2Build on Business AI – Highlighted Use Cases in Technology Blogs by SAP
- SAP Partners unleash Business AI potential at global Hack2Build in Technology Blogs by SAP
| User | Count |
|---|---|
| 23 | |
| 14 | |
| 13 | |
| 13 | |
| 11 | |
| 10 | |
| 9 | |
| 9 | |
| 8 | |
| 8 |

