
- SAP Community
- Products and Technology
- Technology
- Technology Blogs by SAP
- Unifying Story and Analytic Application with the N...
Technology Blogs by SAP
Learn how to extend and personalize SAP applications. Follow the SAP technology blog for insights into SAP BTP, ABAP, SAP Analytics Cloud, SAP HANA, and more.
Turn on suggestions
Auto-suggest helps you quickly narrow down your search results by suggesting possible matches as you type.
Showing results for
Advisor
Options
- Subscribe to RSS Feed
- Mark as New
- Mark as Read
- Bookmark
- Subscribe
- Printer Friendly Page
- Report Inappropriate Content
02-15-2023
4:42 PM
Update: Here is the demo about the New Optimized Story Experience in SAP Analytics Cloud. Enjoy 🙂
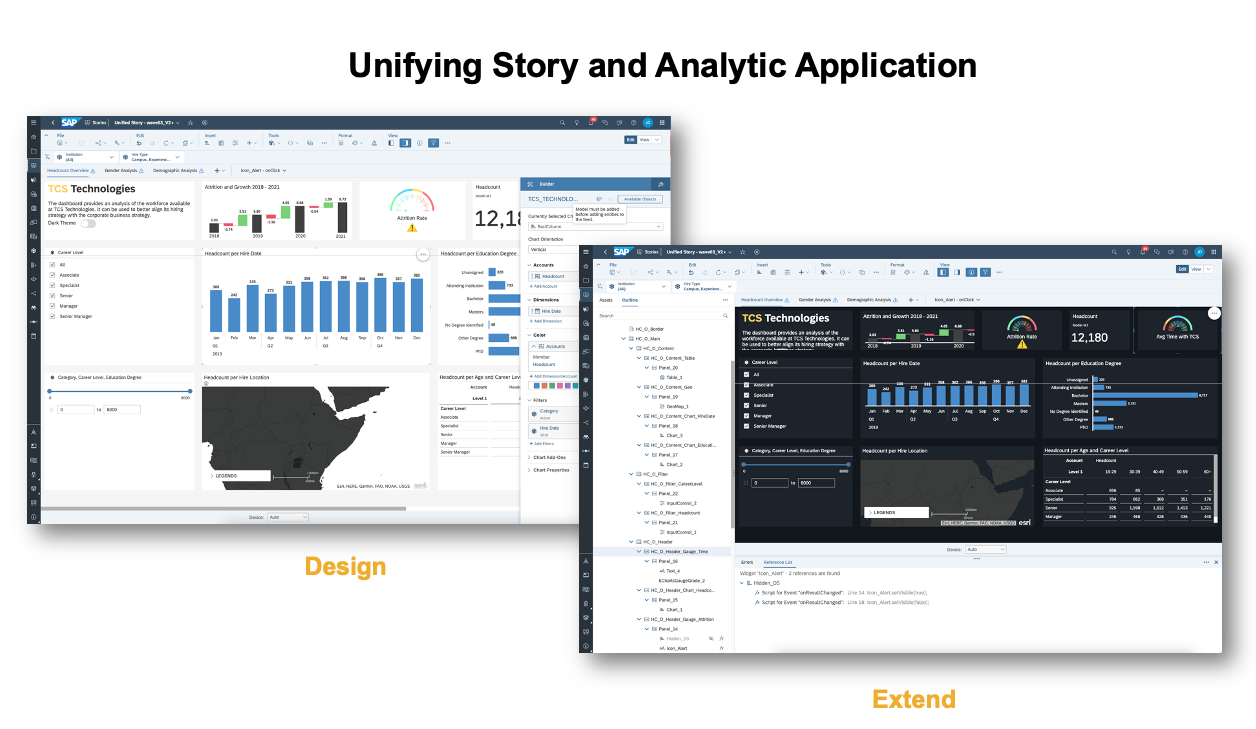
Traditionally we’ve used the Story as the self-service dashboard artefact and Analytic Applications for more sophisticated, guided dashboard and planning applications. With the evolution of these 2 artefacts and the customer requirements, we decided to unify these 2 artefacts into one optimized story experience. This is a big step going forward and we are very happy and proud to announce that the new Optimized Story Experience that unifies the story and analytic application is in General Availability with wave 2023.3 !
Now whether you were building stories or analytic applications, you can now use the new Optimized Story Experience, which integrates features in both stories and analytics designer. You can create customized interactions and add custom logic with a variety of widgets, functionality, and scripting capabilities.
Users no longer need to decide in advance between creating a new story or a new analytic application. They can simply start with a story and then extend it with scripting, custom widgets, and other developer capabilities. This provides a continuum, from simple self-service data visualization to more sophisticated analytic applications. These updates allow story designers to extend data visualizations with advanced capabilities, such as applying a customized theme or widget. Story developers can collaborate with story designers in one place and administrators can reduce the number of stories and analytical applications to manage.
Unified story is the further evolution of Optimized Story Experience, with the integration of Analytic Applications. It takes advantage of the optimized stack and can directly benefit from performance improvements and other valuable features like undo/redo. With this new experience, the Optimized Story is the central artefact that can cover self-service story building to sophisticated analytic application use cases.
Now let’s have a deep dive into the highlights:
Integrated Design Time for Both Designer and Developer
Story Designers and developers are working together in one environment, for seamless collaboration. Within this integrated design time they will be able to open widgets and the outline panel via the left panel icon:
- Assets panel - provides all the widgets that can be added to story canvas via drag & drop
- Outline panel - provides a structured view of all widgets that are currently available in the story
- In addition, story designers and story developers will be able to lock a widgets position and show/hide widgets in outline
- As story designer you can configure the context menu of a widget to flexibly adapting story individual needs

The integrated design time is based on the user privilege. Depending on the privileges/roles, users who have the privilege Application receive more advanced features:
- Advanced widgets: filter controls, containers , button
- Scripting and eventing
- Performance analysis for scripting execution
- Editing Cascading Style Sheet (CSS)
With this concept, story designer can keep the simple and clean design environment. Once the users are granted with Application privilege, they can leverage more advanced features.
Whatever you are working as story designer or developer, you are working within one integrated design environment and on one artefact, that is the Optimized Story.
Please be aware that the scripting is not yet supported for responsive page. We are planning to support it with advanced responsive page with QRC2/2023 Release.
Unified Story Module and Landing Page
We have evolved the existing story module into the unified story module. Creating new analytic applications with the optimized design experience is redirected to the Story module page.
The central landing page has been extended with bookmark list and custom widgets. Bookmarks can be launched directly from this bookmark list without first opening the story. Story developers, with the corresponding privilege, can see the custom widget list that is deployed on this tenant.

Enhanced Custom Widget with Data Binding
In addition to story developer, the story designer can now integrate custom widgets into story, to extend the varieties of visualizations and functionalities. With the data binding capability of custom widget, story designer can configure custom widgets like configure a standard SAC chart without any coding or scripting knowledge.

Unified Bookmark Concept
Here we combine the story bookmark and analytical application concept into a single, consistent, unified bookmark. Story consumers can bookmark the entire widget state - including the filter/variable/drilldown state etc. We have also introduced bookmark version which gives users the option to adjust the validity of bookmarks. Story developers can further define the widgets that can be included into the bookmark definition. Additionally, the bookmark dialog can be enabled for embedded mode on the story level through View Time Toolbar Settings.
Flexible Theme and CSS Capability
Now you as customers can define your corporate theme and save theme as an artefact in SAP Analytics Cloud repository. Story designers or developers can apply this theme to their stories, via one click in design time, without defining the color/font size etc. in each story. In the case of change management of cooperate theme, all assigned stories will be automatically adapted. In addition, Theme editor is provided with a preview to give the visual guidance for Theme designer. In case the standard theme configuration option is not sufficient, it can be enhanced with CSS capability, by developers who have the corresponding privilege.

Vertical Filter Panel
Story viewers can now switch the orientation of the filter panel between horizontal and vertical. A vertical filter panel provides more space to display and interaction with filters (in particular while navigating hierarchical value lists). Story designers can configure the default orientation that viewers see when opening the story.

Linked Widgets Diagram
A Linked Widgets Diagram provides a graphic overview of the defined linked analysis among widgets. Moreover, it is the central location for story designers or developers to maintain linked analysis definitions (edit, delete, and add linked analysis). This diagram will be especially beneficial if there are many defined linked analyses between charts, tables, input controls, and users want to understand the interactions between widgets.

Configurable View Time Toolbar
Now the story toolbar can be configured for view mode, presentation mode or embed mode. Story designer or developers can configure the tool bar to best match the needs to story viewers. E.g., if the story does not contain any variable value, then the prompt icon in toolbar can be removed and replaced by another icon via drag and drop.

Integration with Data Analyzer
As you may already know, the Data Analyzer will replace the Explorer in the optimized story experience. Therefore, integrating Data Analyzer as the data exploration tool in Story is a key workflow. Here story viewers can jump to Data Analyzer from a story table for further data exploration purpose and the entire table state (like filter, drill down etc.) can be completely taken over.

Conversion to the new Optimized Story
Finally, also very important, stories and analytic applications can be converted to the new Optimized Story Experience.
- For classic stories and analytic applications, story designer or developer can convert them to the new Optimized Story Experience via menu item Convert to Optimized Design Experience. It is the same workflow as before.
- For stories that are already created with or converted to the Optimized Design Experience, no manual triggering is required. Once story designer or developer opens the Story in the new Optimized Story Experience (Unified Story Experience), the Stories are automatically converted to the New optimized Story experience format.
- For stories and analytic applications that are already enabled for the Optimized View Mode, they are automatically opened with the new Optimized story runtime

In addition to all the above highlights, Story designers can leverage a variety of no-code features coming from analytical applications, like Popup, Panel, Context Menu customization, device-preview etc. Story developer can get the access of the convenient features like all type of input controls, pages, Bookmark/Export dialogs etc. With the unification approach, we see the huge benefit for both use cases.
We will further enhance the Optimized Story Experience with more powerful features, like Data Change insight, Composite, and Digital Boardroom capabilities etc. Please stay tuned, and you can find more details in SAP Analytics Cloud roadmap.
Dear customers and partners, thanks a lot for your valuable feedback via discussions, ideas on influence.sap.com, etc. Thanks for supporting us in making this step forward towards the new generation of Dashboarding in SAP Analytics Cloud. This Blog is the first blog to introduce the Unified Story Experience. We will further deliver more blogs for this topic with different focus area.
Feel free to leave your comments and thoughts in the comment area below.
The Optmized Story Experience Roadmap
Follow the SAP Roadmap Explorer here
Related Blogs
How to use Scripts to build cross-pages Interaction for the New Optimized Story Experience in SAP An...
Labels:
27 Comments
You must be a registered user to add a comment. If you've already registered, sign in. Otherwise, register and sign in.
Labels in this area
-
ABAP CDS Views - CDC (Change Data Capture)
2 -
AI
1 -
Analyze Workload Data
1 -
BTP
1 -
Business and IT Integration
2 -
Business application stu
1 -
Business Technology Platform
1 -
Business Trends
1,658 -
Business Trends
95 -
CAP
1 -
cf
1 -
Cloud Foundry
1 -
Confluent
1 -
Customer COE Basics and Fundamentals
1 -
Customer COE Latest and Greatest
3 -
Customer Data Browser app
1 -
Data Analysis Tool
1 -
data migration
1 -
data transfer
1 -
Datasphere
2 -
Event Information
1,400 -
Event Information
67 -
Expert
1 -
Expert Insights
177 -
Expert Insights
308 -
General
1 -
Google cloud
1 -
Google Next'24
1 -
GraphQL
1 -
Kafka
1 -
Life at SAP
780 -
Life at SAP
13 -
Migrate your Data App
1 -
MTA
1 -
Network Performance Analysis
1 -
NodeJS
1 -
PDF
1 -
POC
1 -
Product Updates
4,576 -
Product Updates
353 -
Replication Flow
1 -
REST API
1 -
RisewithSAP
1 -
SAP BTP
1 -
SAP BTP Cloud Foundry
1 -
SAP Cloud ALM
1 -
SAP Cloud Application Programming Model
1 -
SAP Datasphere
2 -
SAP S4HANA Cloud
1 -
SAP S4HANA Migration Cockpit
1 -
Technology Updates
6,873 -
Technology Updates
440 -
Workload Fluctuations
1
Related Content
- API Management: Unlocking OAuth Strategies in Technology Blogs by SAP
- SAP BTP Innobytes – April 2024 in Technology Blogs by SAP
- The 2024 Developer Insights Survey: The Report in Technology Blogs by SAP
- Sapphire 2024 user experience and application development sessions in Technology Blogs by SAP
- SAP BW/4 - revamp and true to the line 2024 in Technology Blogs by Members
Top kudoed authors
| User | Count |
|---|---|
| 22 | |
| 13 | |
| 13 | |
| 11 | |
| 10 | |
| 10 | |
| 9 | |
| 9 | |
| 9 | |
| 8 |