By Mico Yuk and Anita Gibbings
Ask yourself this question, “What’s the first step in building a successful business intelligence (BI) dashboard?”
If you’re like 95 percent of our readers, you said, “Scoping, of course!” But you’re wrong!
The starting point of any successful dashboard is identifying the who, what, and when. This planning phase is actually before scoping – and, unfortunately, it’s one of the most overlooked phases in the dashboard development process. Mico Yuk, Founder of the Xcelsius Gurus and SAP Mentor is offering a free download of her BI Dashboard Planning Guide, 1 of the 10 templates that she has designed to help you avoid some of the pitfalls at http://BIDashboardFormula.com.
·
Who: Who is the dashboard for, and who will pay for it?
· When: When is the dashboard due? Is there a major milestone attached to it?
· What: What problem will it solve, and what high-level key performance indications (KPIs) do you need to track to reach them?
In this article we will focus on “what.” As part of the planning process, “what” is the second most important part of the dashboard planning process after “who.” Why? Some companies spend tens of thousands of dollars, with good reason, to hire management consultants to help them identify and analyze KPIs and transform their business. The real problem? Most companies simply don’t put enough effort into determining their KPIs.
Often companies use generic KPIs, like revenue, costs, and margins, which are lagging indicators that don’t always result in business transformation. You might notice a drop in revenue, but unless you identified the right metric, you might not realize that you need to revolutionize the way your sales people handle their accounts. A dashboard with revenue by product would only indicate a pre-existing problem; whereas leading-indicator KPIs would likely track where sales people spent their time or how long accounts were spending in one stage of the sales cycle. This type of information would allow you to correct the issue before it had a major impact on revenue.
Depending on which KPIs are selected, a business can take an innovative path as individuals respond to what is being measured. This is similar to the company that wanted to grow sales and began tracking the number of net new customers. Without realizing that many of them were actually consuming more resources than revenue creation, the company’s margins dropped.
Successful Dashboard Stories
A successful dashboard should tell a four-part story for each of KPI:
1) Current State: Where you are today
2) Trend: How you got there
3) Forecast: Where you’ll end up over time at your current run rate
4) What-if: What you need to do to hit your targets
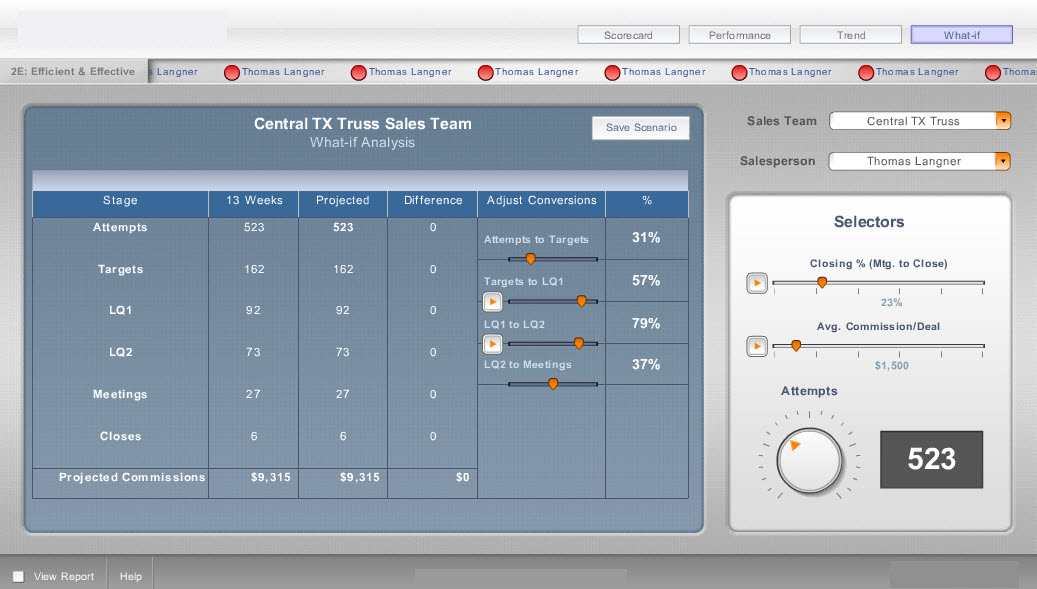
Sales Dashboard that “Tells a Story” – Credit: AnalysisFactory.com
Note the storyline at the top right: Scorecard, Performance, Trend, What If that allow you to first recognize that you have a problem, diagnose the issues and decide on the appropriate action.

Another thing to consider is that most KPIs are useless without the use of alerts or statistical functions such as probability. Successful dashboards contain KPIs that provide direct answers to questions like “Will I hit my target?” Instead of showing this in the form of a bar chart that displays actual vs. target, consider using a simple probability formula that displays a single percentage to target on a real-time basis throughout the month.
For instance, if it’s the middle of the month and the probability of you hitting your target isn’t at or above 50 percent, then a yellow alert should display on the dashboard for that KPI, indicating that unless you implement some changes to your business now, you’ll miss your targets at month end. This is way more efficient for running a business and measuring the appropriate targets as opposed to simply displaying data.
So before you bring in IT, business leaders need to spend significant time getting to the core business goals or challenges. This allows for a clear understanding of the purpose of each metric and how it will drive behavior in your organization once it’s published broadly.
Mico Yuk- Founder of the Xcelsius Gurus, SAP Mentor, and BI Influencer, will be teaching the above strategies and many more in her NEW online coaching series titled “The BI Dashboard Formula”. Early bird sign up specials include a free Blackberry RIM PlayBook. Click here to Register now – and watch for the next blog post in August, covering the second step of Mico’s seven-step formula.
