
- SAP Community
- Products and Technology
- Technology
- Technology Blogs by SAP
- SAP Retail POS Analysis : SAP Data Warehouse Cloud...
Technology Blogs by SAP
Learn how to extend and personalize SAP applications. Follow the SAP technology blog for insights into SAP BTP, ABAP, SAP Analytics Cloud, SAP HANA, and more.
Turn on suggestions
Auto-suggest helps you quickly narrow down your search results by suggesting possible matches as you type.
Showing results for
Product and Topic Expert
Options
- Subscribe to RSS Feed
- Mark as New
- Mark as Read
- Bookmark
- Subscribe
- Printer Friendly Page
- Report Inappropriate Content
06-24-2021
1:51 PM
This blog post has the intention to give some background information about the new released SAP Data Warehouse Cloud Content "SAP Retail: POS Analysis" and its related SAP Analytics Cloud Content "Retail: POS Analysis".
The idea of this content is, to support customers, partners and colleagues to start with SAP Data Warehouse Cloud projects. Since SAP Data Warehouse Cloud is quite new, we thought it would be good to have an end-to-end scenario available out of the box.
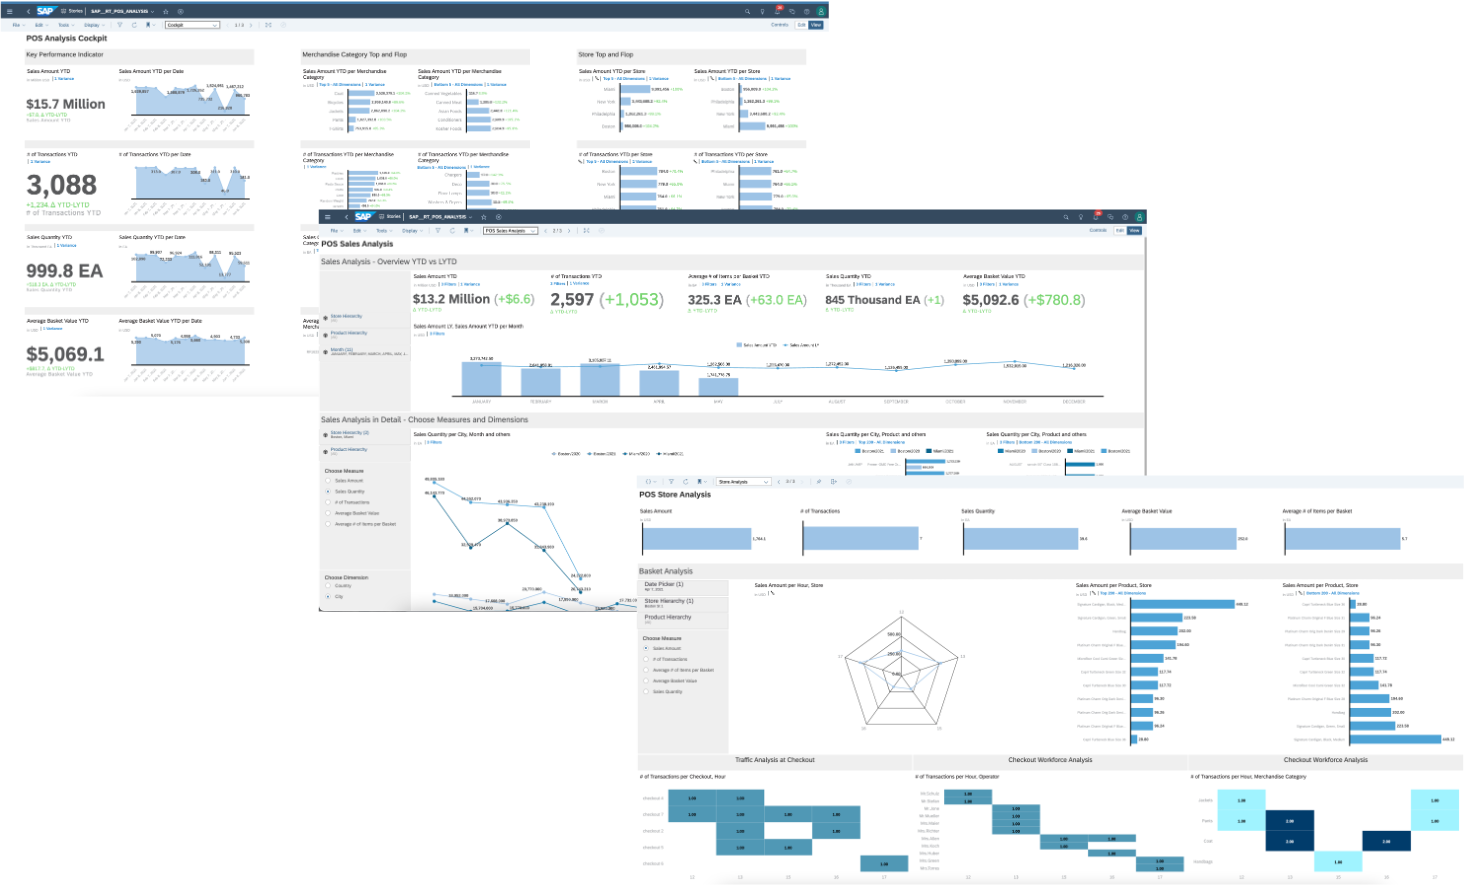
Let's get a short overview of what the story in SAP Analytics Cloud is offering:
The first page, called "POS Analysis Cockpit", gives an overview of some important KPI's as Sales Amount, Number of Transactions, Sales Quantity and Average Basket Value. The pattern for each KPI is always the same, and the idea is to get a first quick birds eye perspective.
On the next page of the story, "POS Sales Analysis", the user has much more possibilities to analyse the data in detail:
The third page "Store Analysis" allows to analyze POS transactions per hour. Again different KPI's, Location Hierarchy and Product Hierarchy can be filtered. Top values and Flop values will automatically calcualted. With a date picker the granularity of the data set can be chosen for daily, monthly, quarterly or yearly granularity.
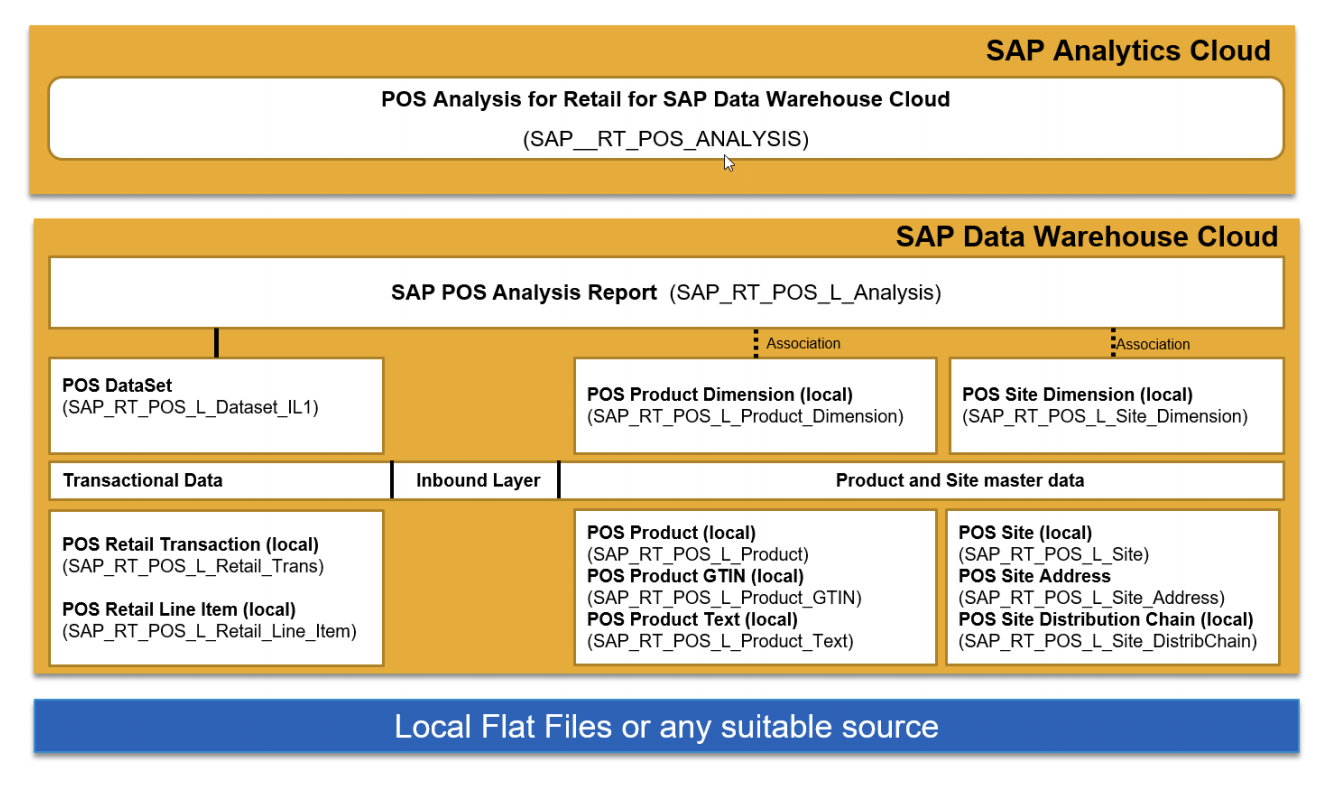
Now let's have a look on the over all achitecture:
SAP Data Warehouse Cloud is the foundation layer for all data consumed by SAP Analytics Cloud.
You will find usefull information in the latest version of SAP Data Warehouse Cloud Content Documentation.
Basically, this content consist of two different kind of data:
Let's get back to the idea of this content. When it comes to analytics, semantics are key. For this asset, the idea was to have something in place to get quickly familiar with the possibilities SAP Data Warehouse Cloud offers when it comes to semantics and how those semantics will enable SAP Analytics Cloud functionality.
Having meaningful master data is crucial for analytics. Let's have a closer look into the store master data. In our case, valuable information is spread over 3 different tables. Thats why we use the possibility to join those tables to get one common dataset for stores:
Semantically spoken, we created a common data set of type dimension for our store information:
There are two interesting possibilities SAP Datawarehouse Cloud offers:
For that we assign Semantic Type "Text" to the Store Name Attribute and for the Store Attribute, we assign Store Name as Label Column.
As a consequence, in SAP Analytcis Cloud, we can use ID and Description for the dimension Store:
Hierarchies bring structure in reports. SAP Data Warehouse Cloud does support two kinds of hierarchies, level based hierarchy and parent child hierarchy.
We used a level based hierarchy with the dimensions Country, City and Store:
Transactional data are the heart of every report. They contain the measure which are the foundation to calculate the KPIs to steer your business. Thus, let's have a short view whats possible here. The data set we used consist of two tables which has different information about a POS transaction. Thats why again, first step is a join:
Main difference to the master data view is the semantic usage of type "Relational Dataset".
Now, that transactional data and master data views are ready, we created the final "Analytical Dataset" (Semantic Usage) which will be used for consumption (Expose for Consumption = ON) and enriched by additional semantic features:
A crucial semantic feature is to be able to assign semantics to measures (the technical name for KPI's). Measures will have an aggreagtion behavior, a semantic type and if a unit is needed, the corresponding column in the data set can be assigned:
As a consequence, SAP Analytics Cloud can deal with those settings:
Et voilà:
In my next blog post, I will describe how easily it is to deploy this content.
https://blogs.sap.com/2021/06/24/deploy-sap-retail-pos-analysis-sap-data-warehouse-cloud-and-sap-ana...
Regards and stay curious,
Nicole
#build bridges, not silos
The idea of this content is, to support customers, partners and colleagues to start with SAP Data Warehouse Cloud projects. Since SAP Data Warehouse Cloud is quite new, we thought it would be good to have an end-to-end scenario available out of the box.
Let's get a short overview of what the story in SAP Analytics Cloud is offering:
The first page, called "POS Analysis Cockpit", gives an overview of some important KPI's as Sales Amount, Number of Transactions, Sales Quantity and Average Basket Value. The pattern for each KPI is always the same, and the idea is to get a first quick birds eye perspective.
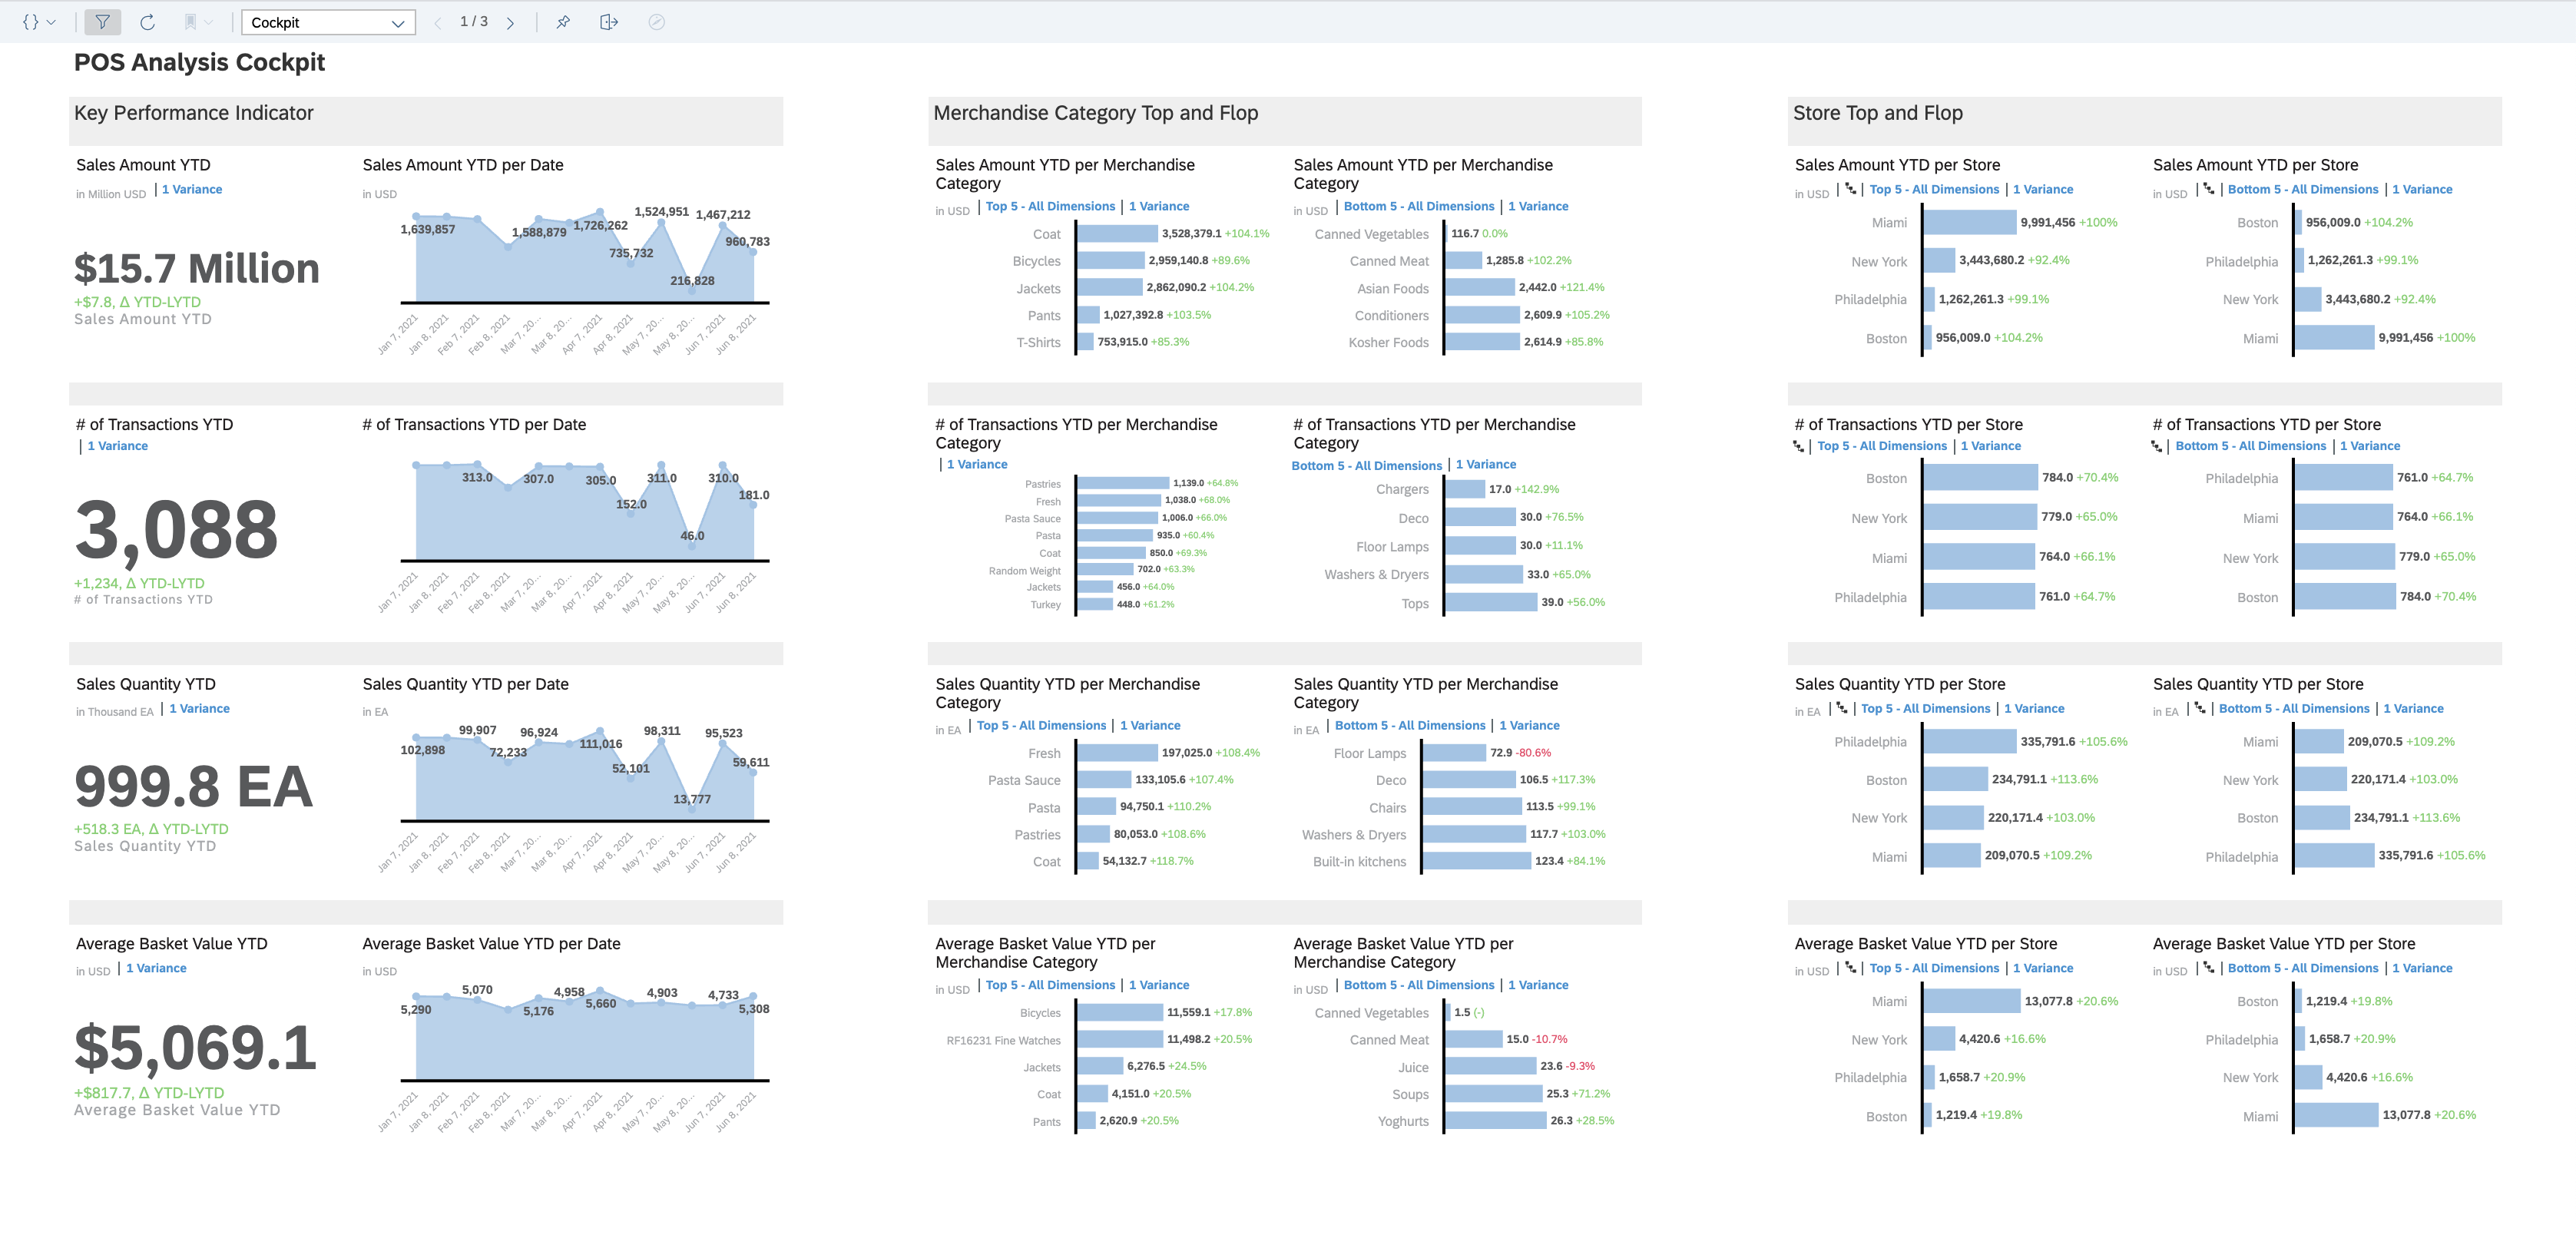 Every KPI has different Informations aligned horizontically. First you get the actual Year-to-Date (YTD) value compared to Last-Year-to-Date's (LYTD) value enriched with a chart showing the corresponding KPI per date over the actual year. In a next box, the same KPI is ranked for TOP 5 and Bottom 5 values per Merchandise Category and last but not least, ranked per Store.
On the next page of the story, "POS Sales Analysis", the user has much more possibilities to analyse the data in detail:

The third page "Store Analysis" allows to analyze POS transactions per hour. Again different KPI's, Location Hierarchy and Product Hierarchy can be filtered. Top values and Flop values will automatically calcualted. With a date picker the granularity of the data set can be chosen for daily, monthly, quarterly or yearly granularity.

Now let's have a look on the over all achitecture:
SAP Data Warehouse Cloud is the foundation layer for all data consumed by SAP Analytics Cloud.
You will find usefull information in the latest version of SAP Data Warehouse Cloud Content Documentation.
Basically, this content consist of two different kind of data:
- master data for products and sites
- transactional data for POS data
Let's get back to the idea of this content. When it comes to analytics, semantics are key. For this asset, the idea was to have something in place to get quickly familiar with the possibilities SAP Data Warehouse Cloud offers when it comes to semantics and how those semantics will enable SAP Analytics Cloud functionality.
Having meaningful master data is crucial for analytics. Let's have a closer look into the store master data. In our case, valuable information is spread over 3 different tables. Thats why we use the possibility to join those tables to get one common dataset for stores:
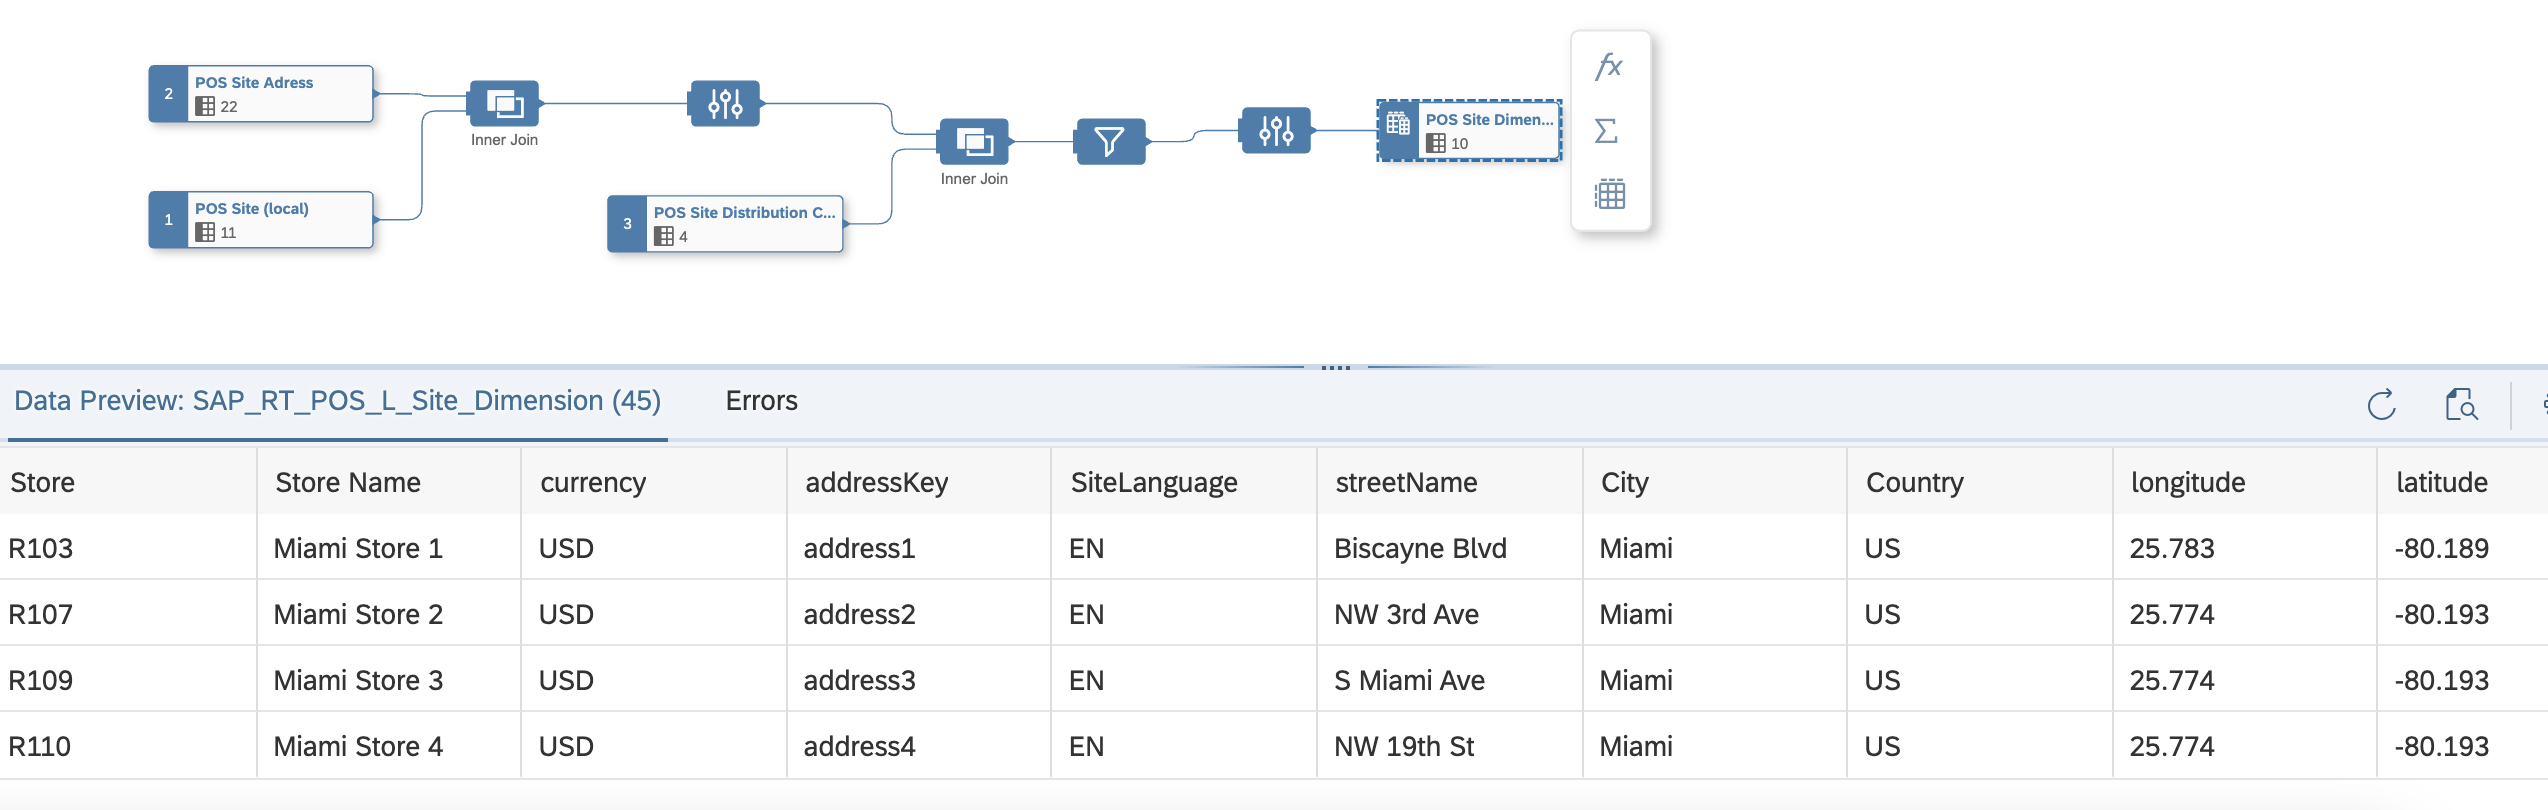
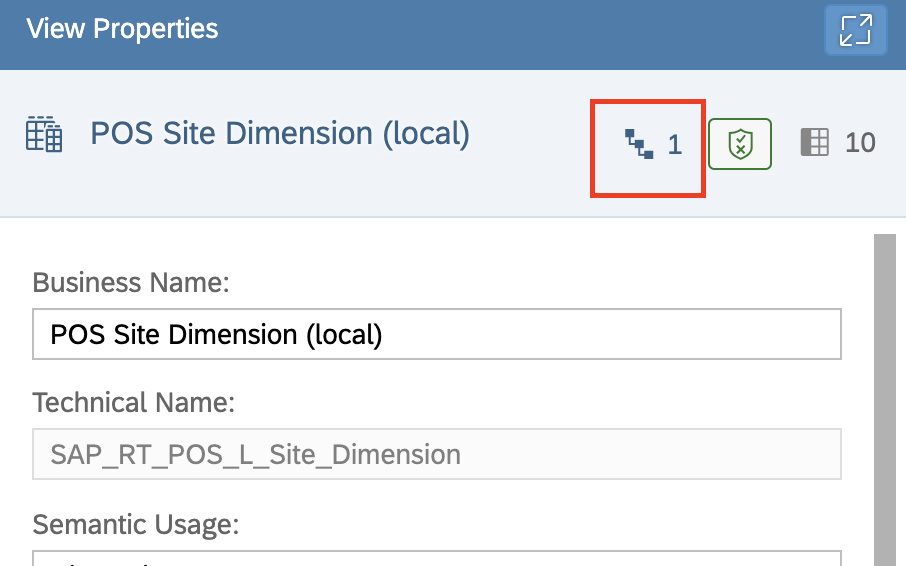
Semantically spoken, we created a common data set of type dimension for our store information:

Let's explore what further options we have to prepare the data for reporting.
There are two interesting possibilities SAP Datawarehouse Cloud offers:
- labeling data
- creating hierarchies
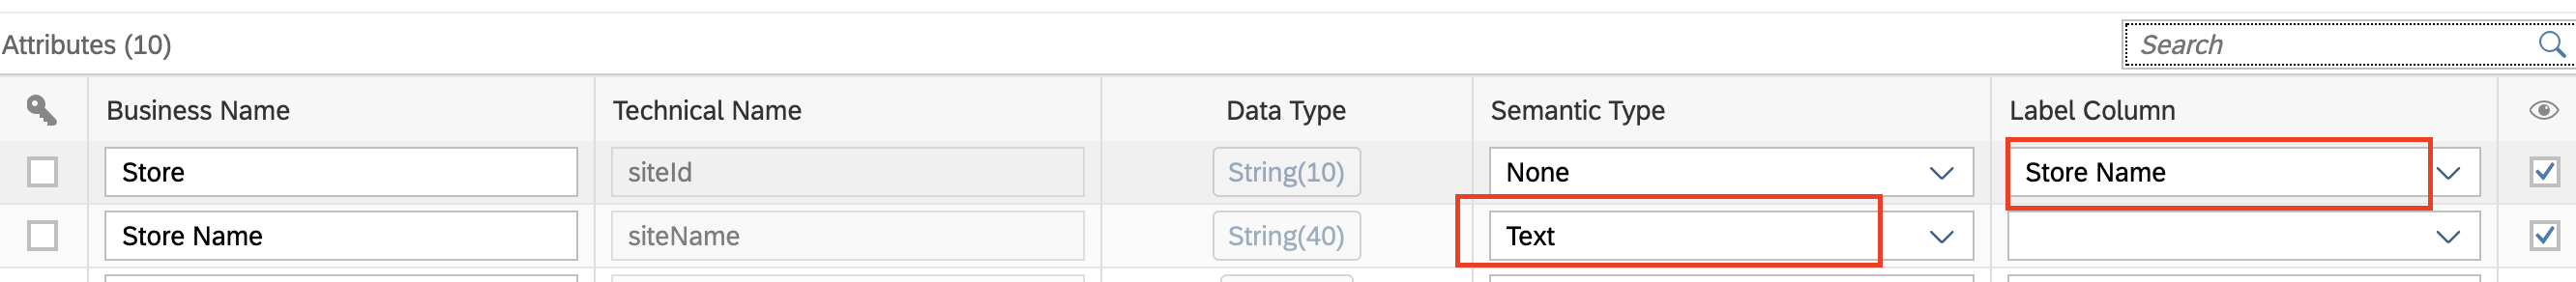
Labeling data means adding a label to a key value for connecting meaninful information in our example mapping a Store ID to a Store Name:
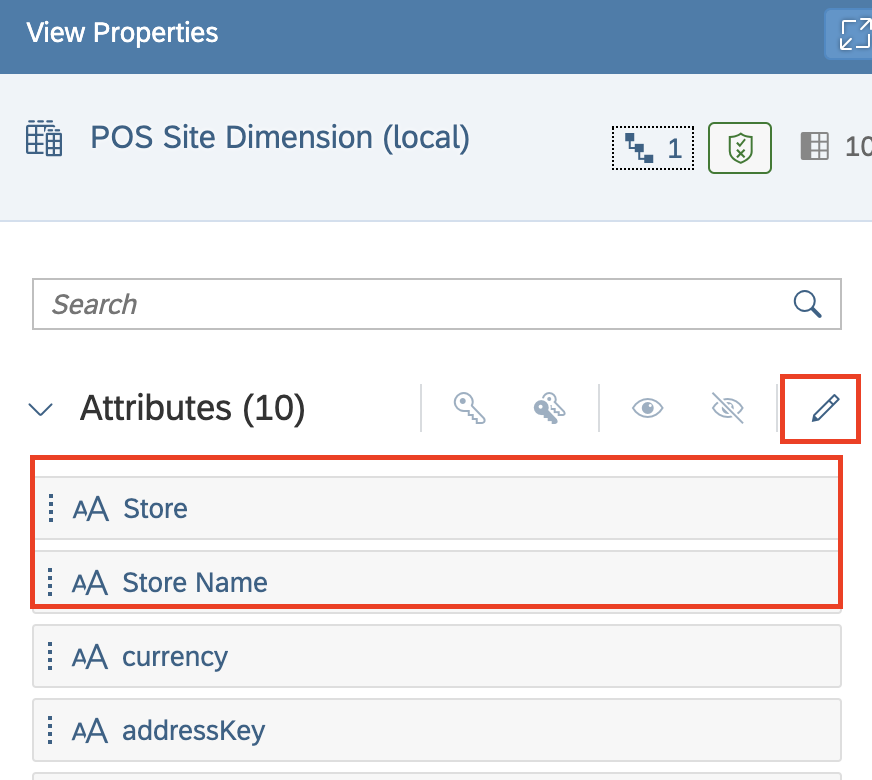
For that we assign Semantic Type "Text" to the Store Name Attribute and for the Store Attribute, we assign Store Name as Label Column.
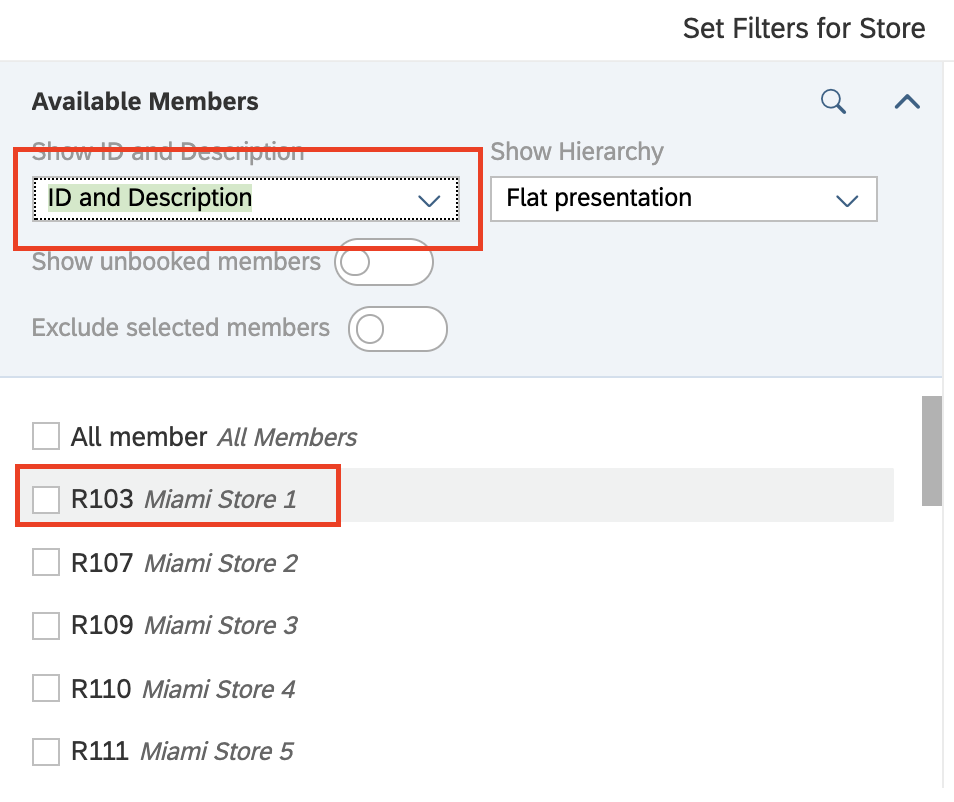
As a consequence, in SAP Analytcis Cloud, we can use ID and Description for the dimension Store:
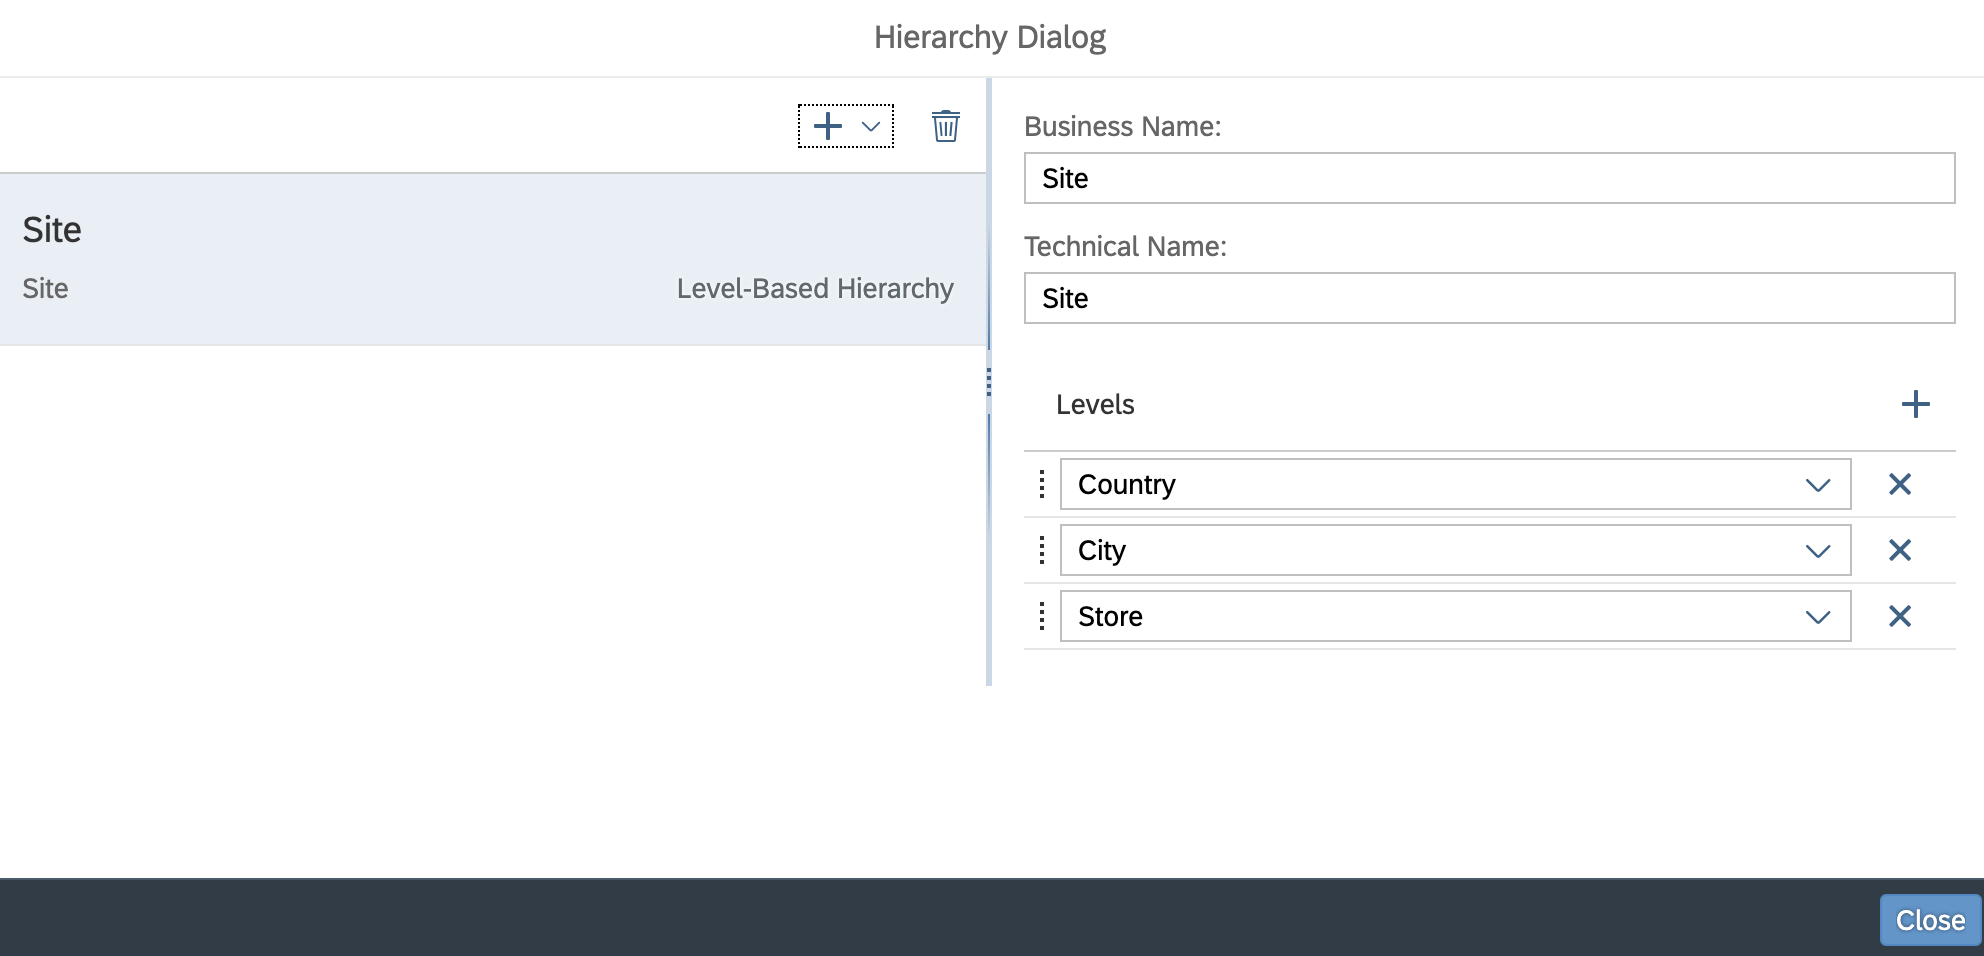
Hierarchies bring structure in reports. SAP Data Warehouse Cloud does support two kinds of hierarchies, level based hierarchy and parent child hierarchy.
We used a level based hierarchy with the dimensions Country, City and Store:
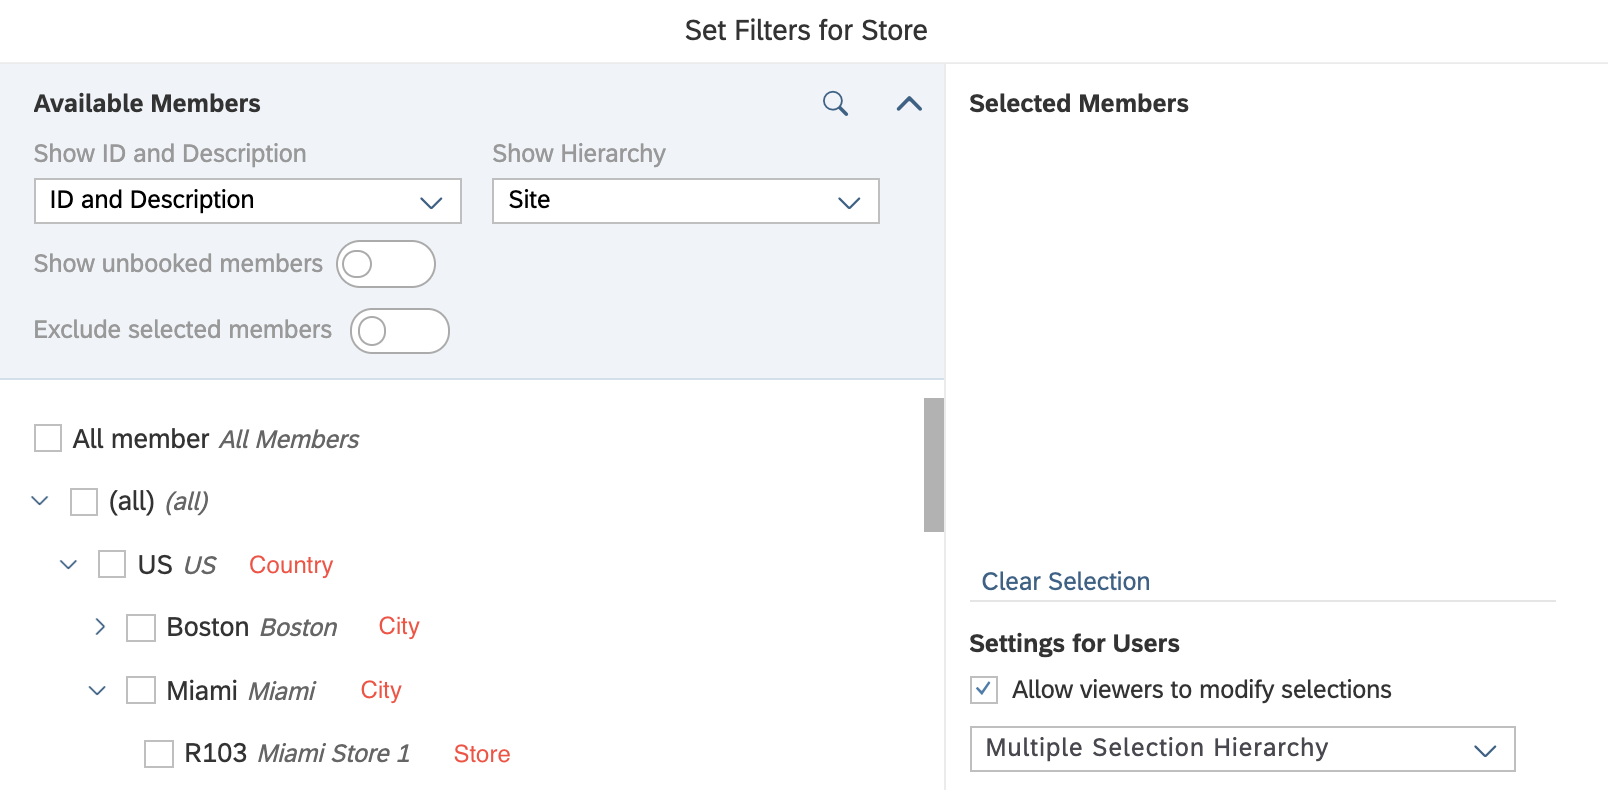
Let's see how SAP Analytics Cloud makes use of the hierarchies:
Transactional data are the heart of every report. They contain the measure which are the foundation to calculate the KPIs to steer your business. Thus, let's have a short view whats possible here. The data set we used consist of two tables which has different information about a POS transaction. Thats why again, first step is a join:
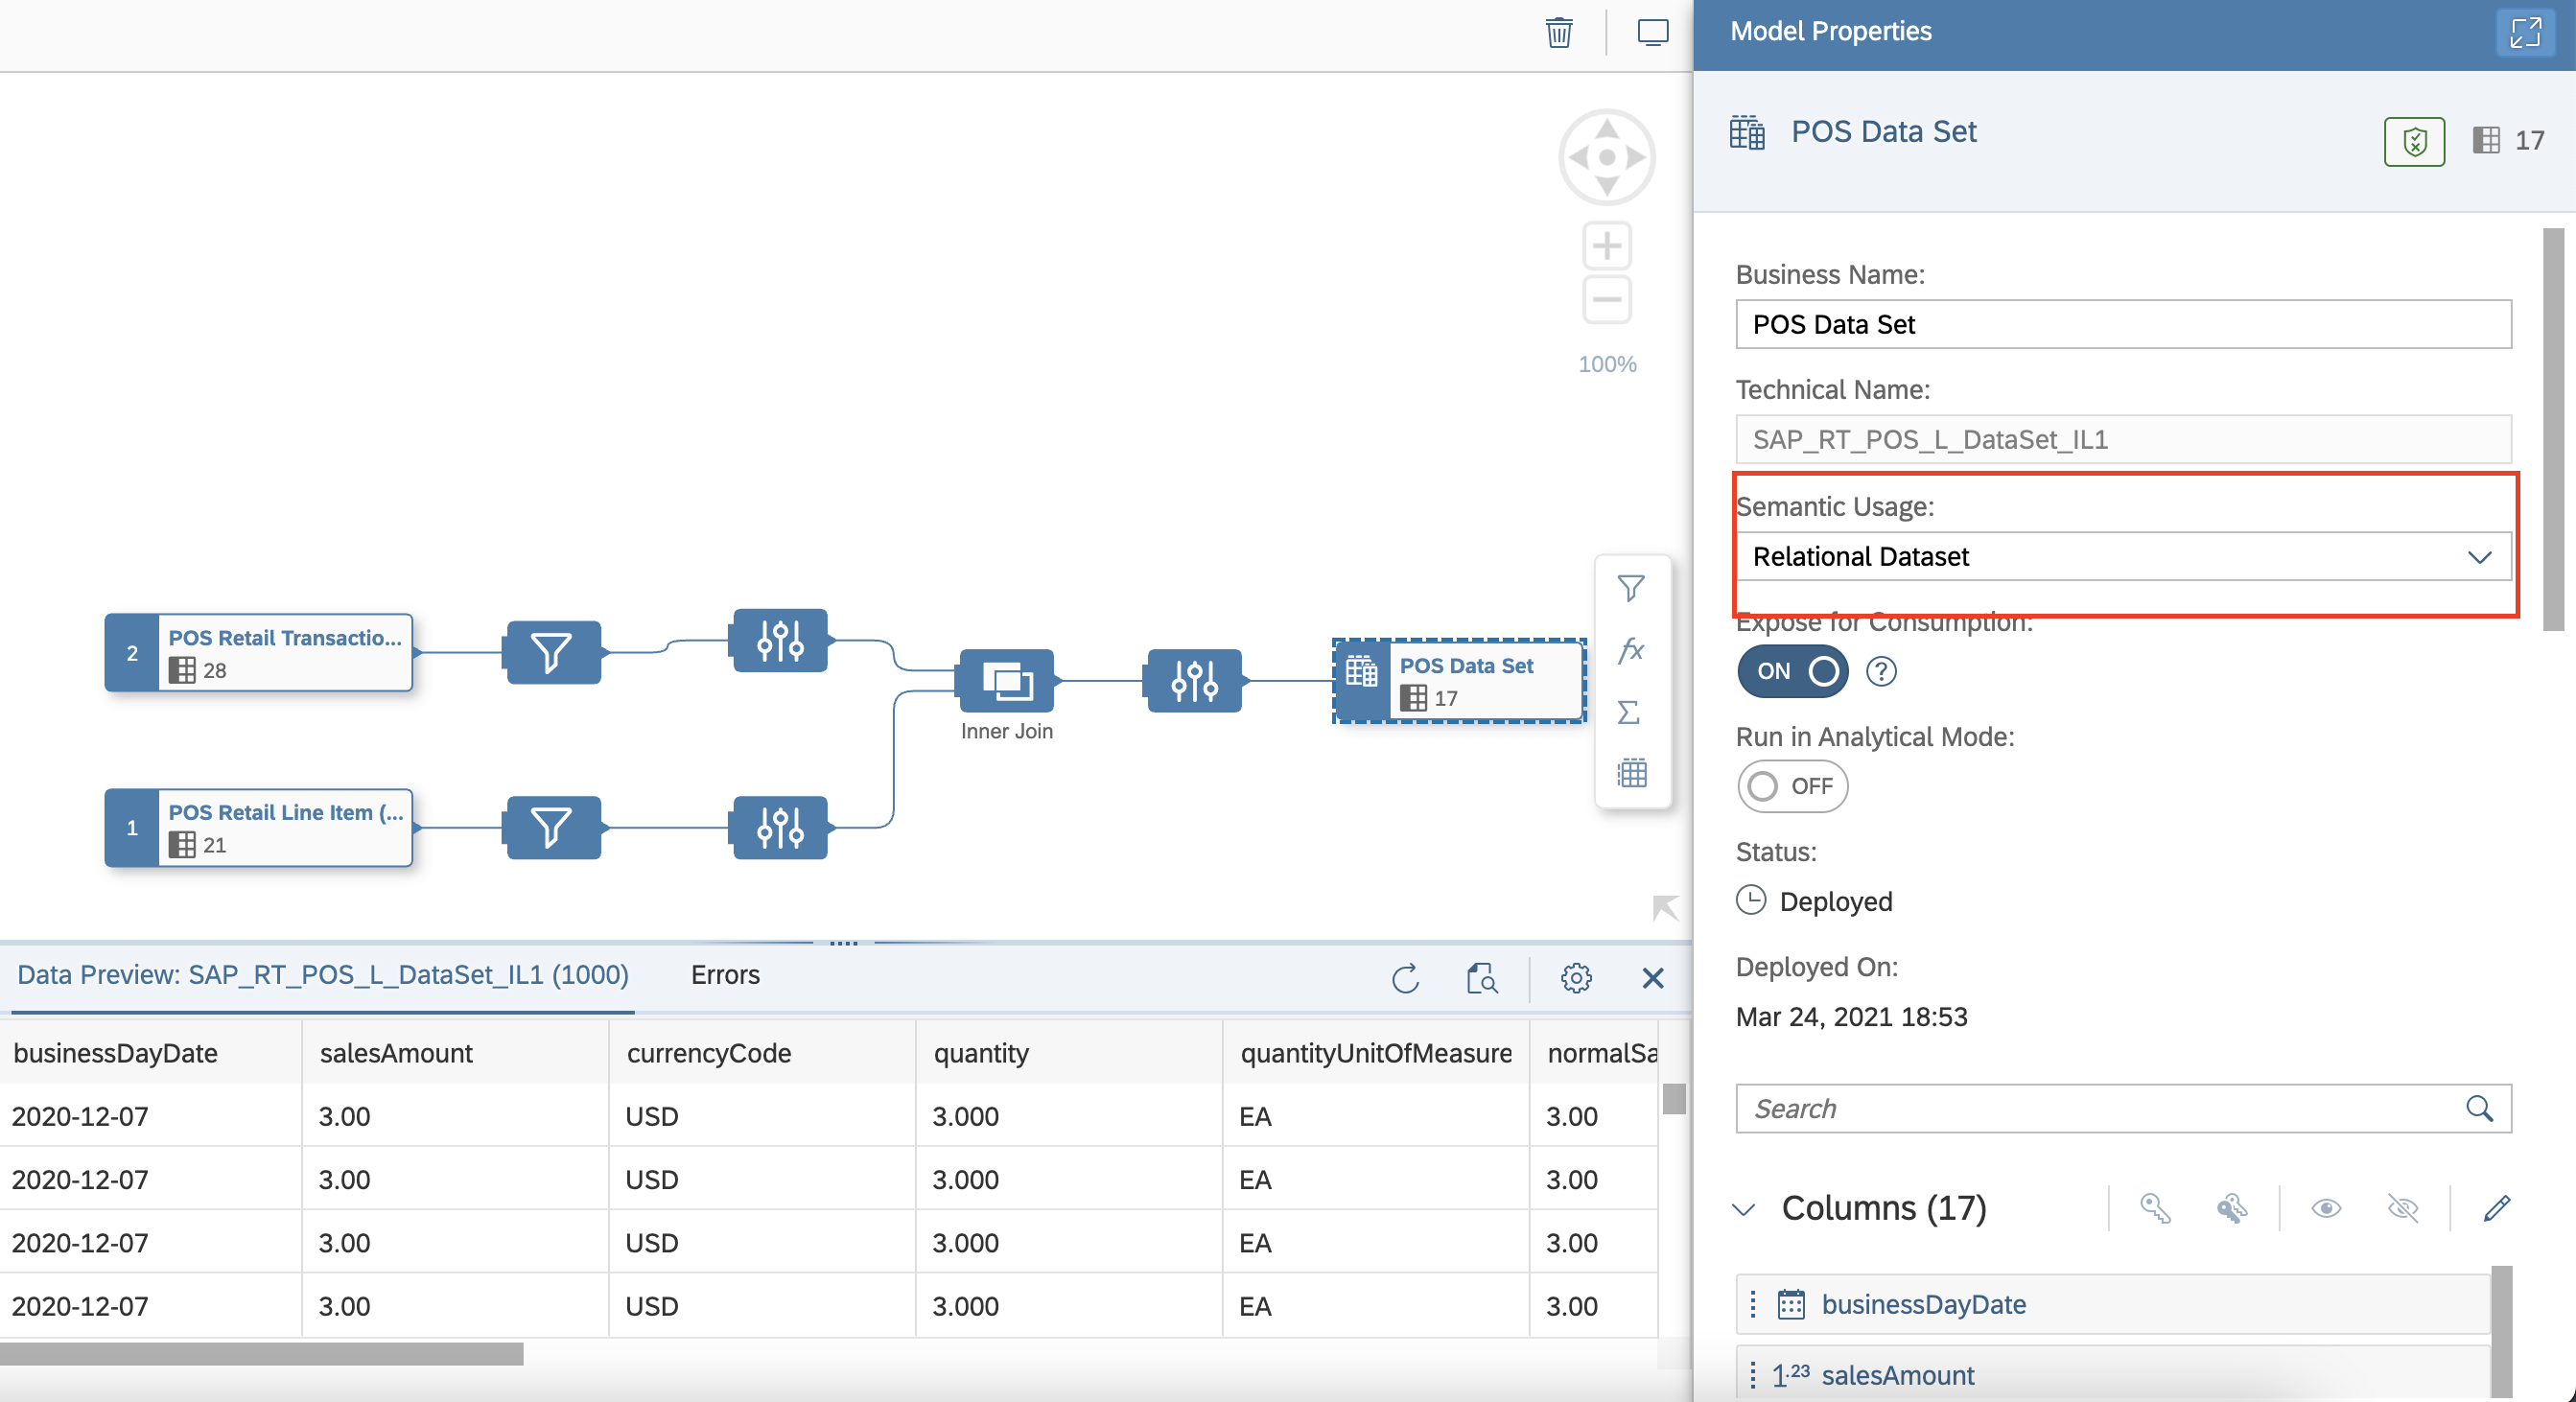
Main difference to the master data view is the semantic usage of type "Relational Dataset".
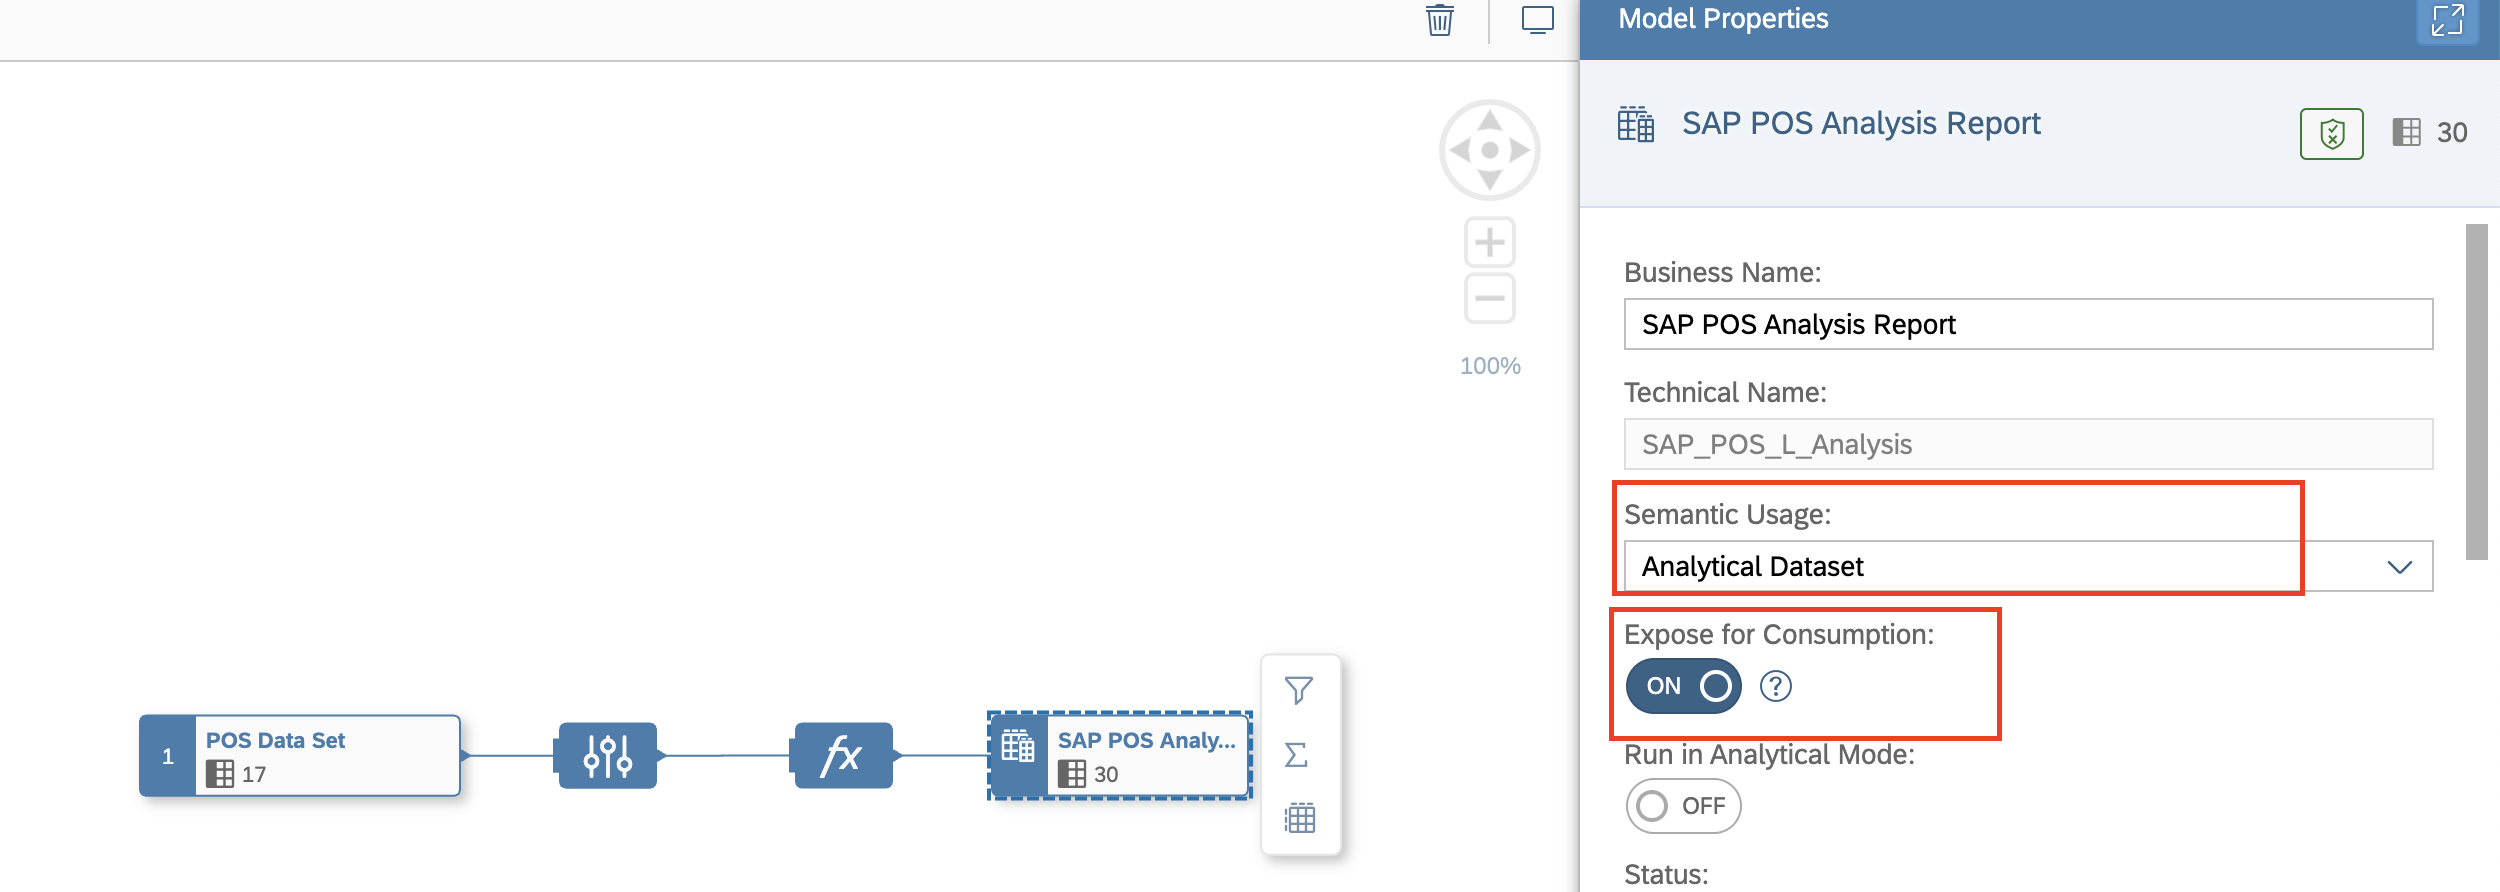
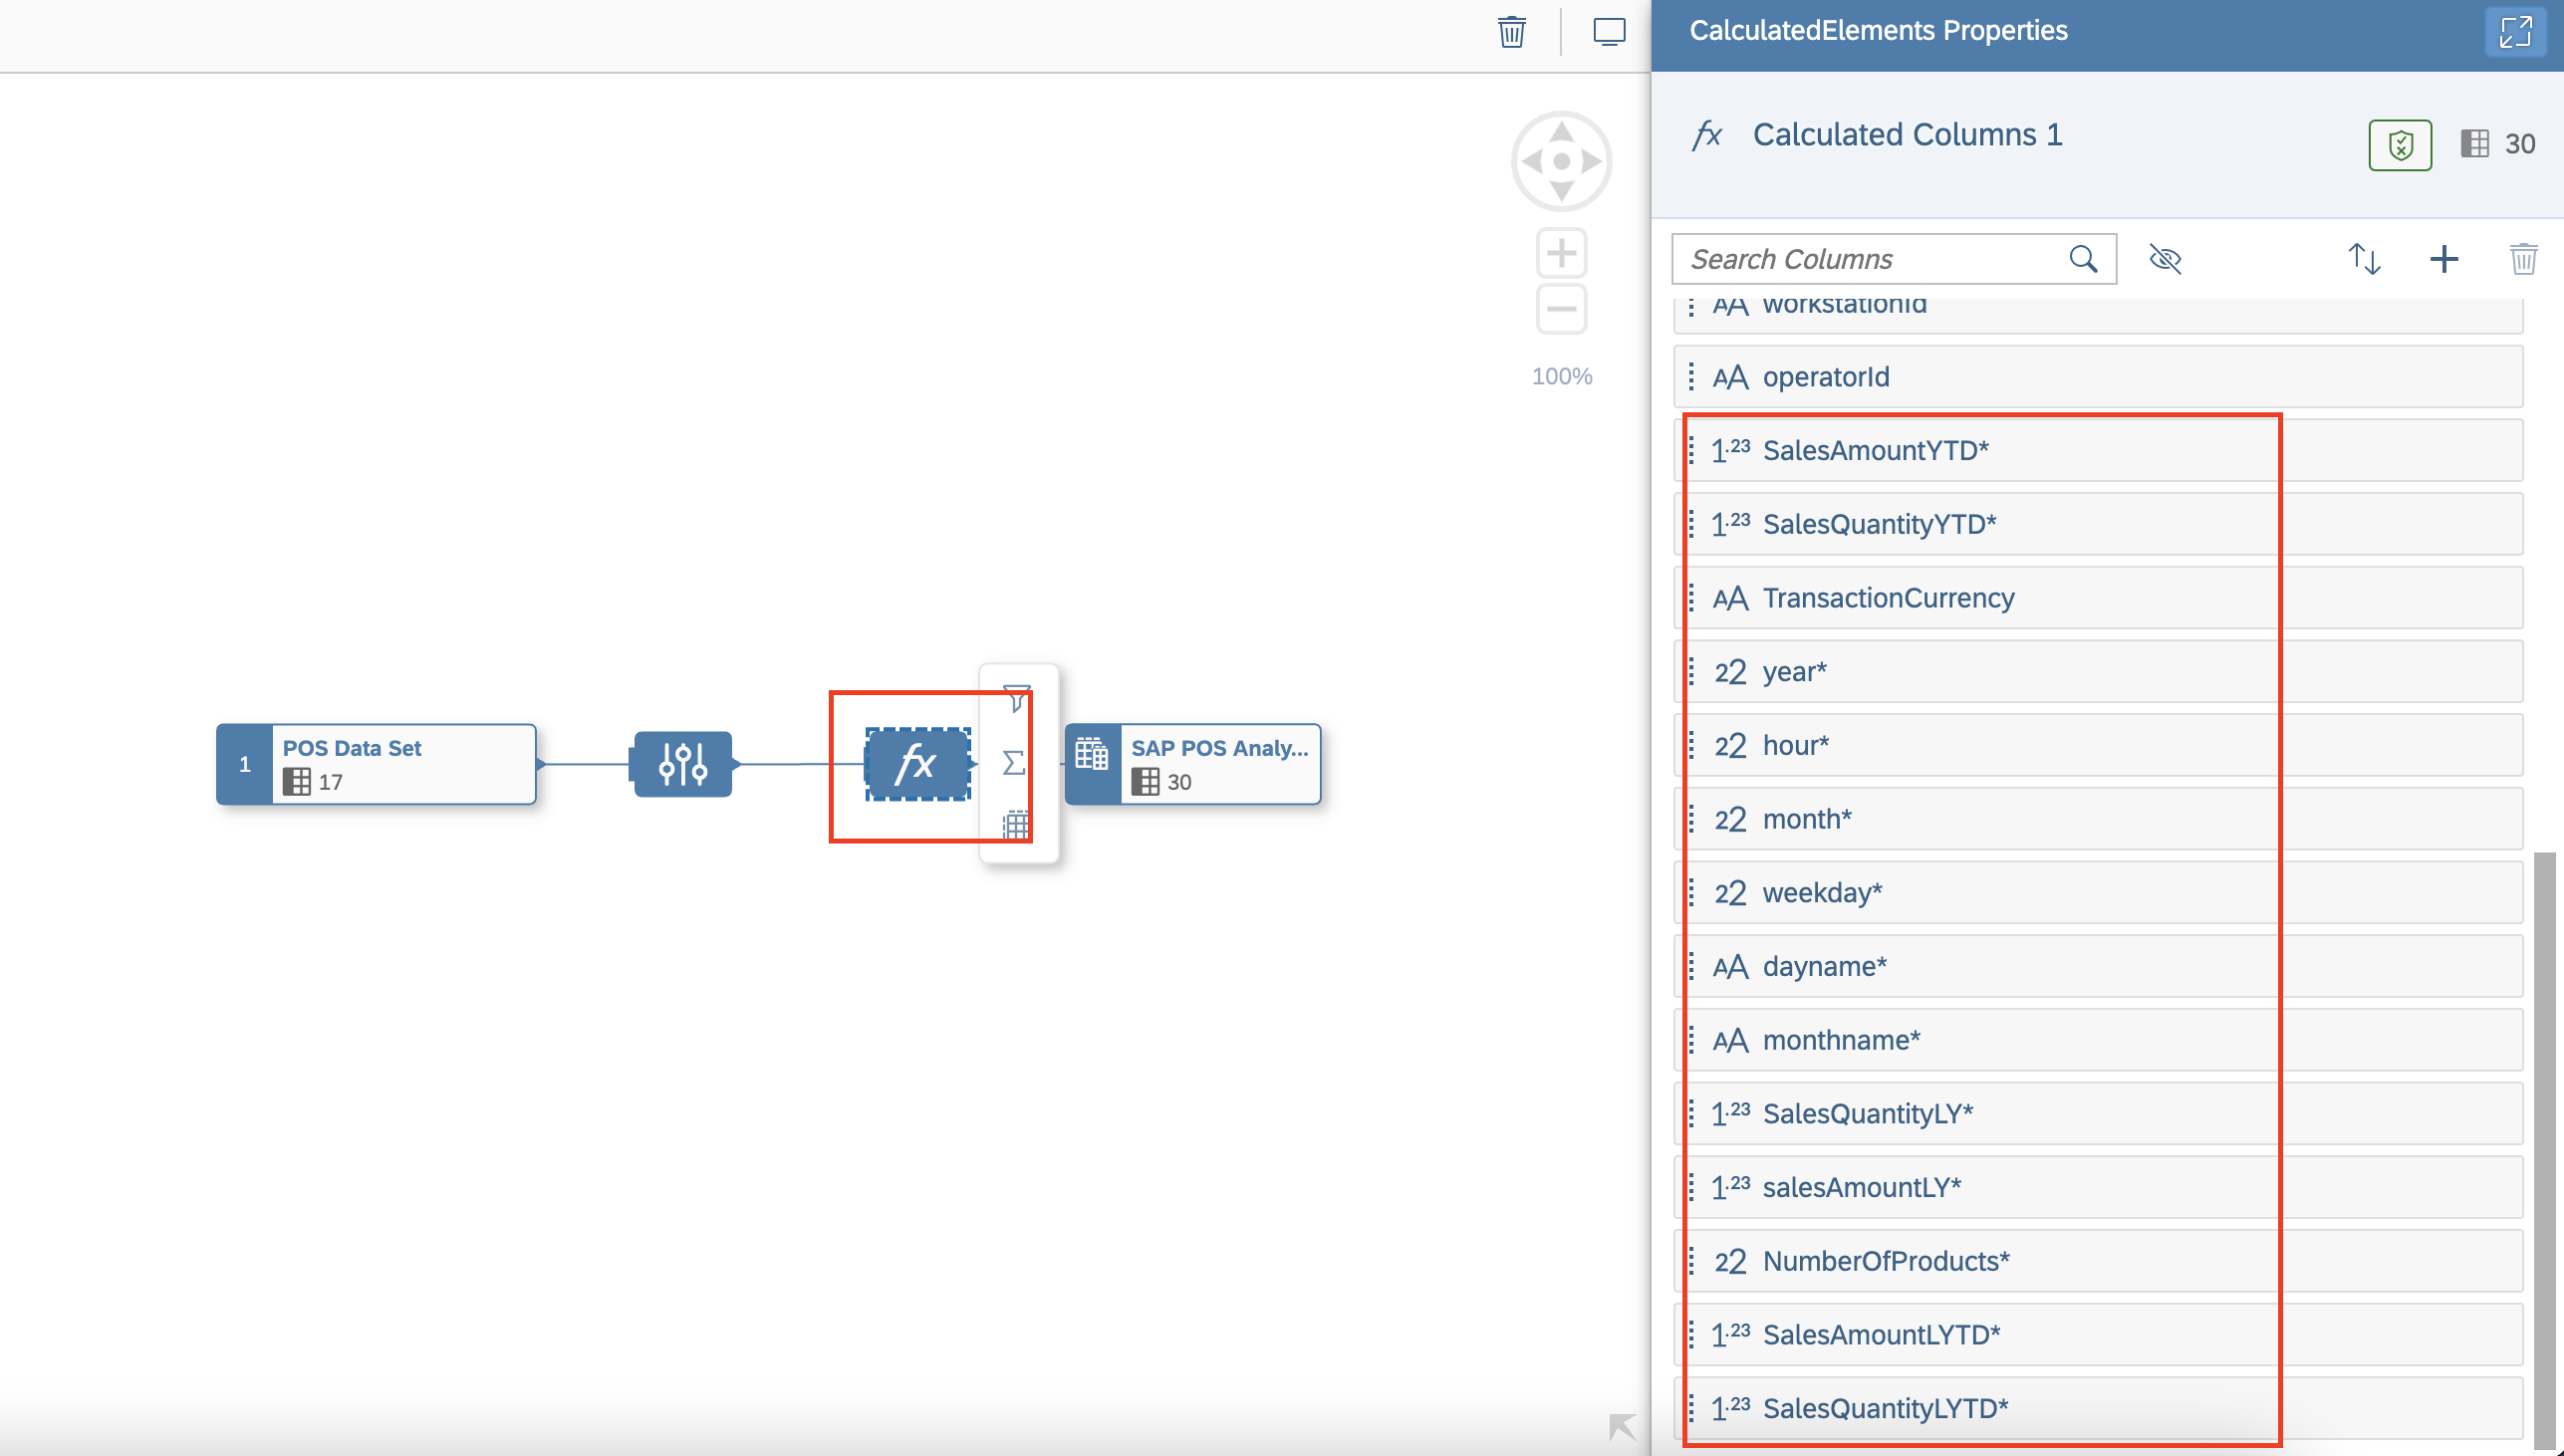
Now, that transactional data and master data views are ready, we created the final "Analytical Dataset" (Semantic Usage) which will be used for consumption (Expose for Consumption = ON) and enriched by additional semantic features:
First semantic feature is to calculate some KPI's and dimension we know, we could use for a better reporting purpose such as SalesAmountLYTD, daynames, weekdays, etc:
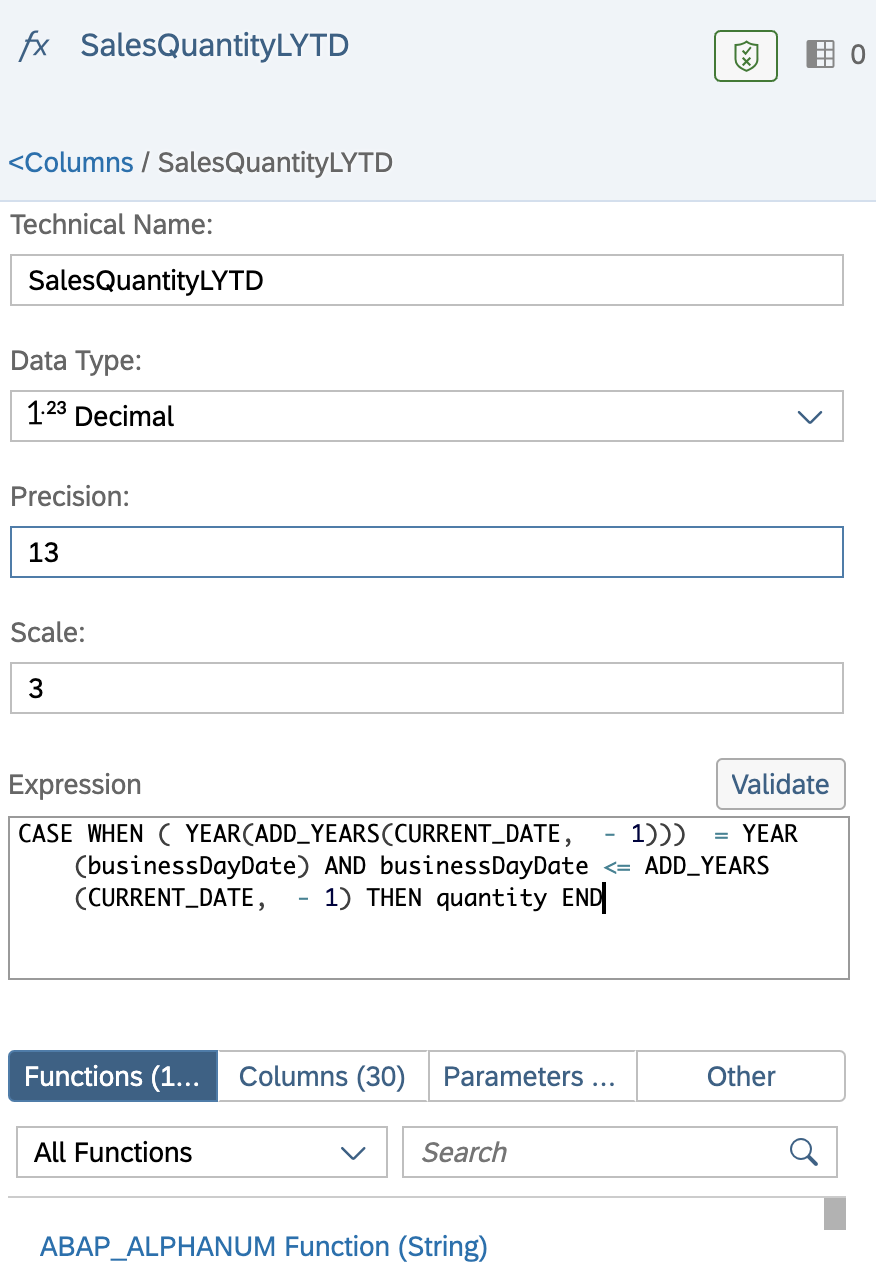
See the following definition and calculation for SalesQuantityLYTD (Last year to date) to understand the calculation logic:
:
A crucial semantic feature is to be able to assign semantics to measures (the technical name for KPI's). Measures will have an aggreagtion behavior, a semantic type and if a unit is needed, the corresponding column in the data set can be assigned:
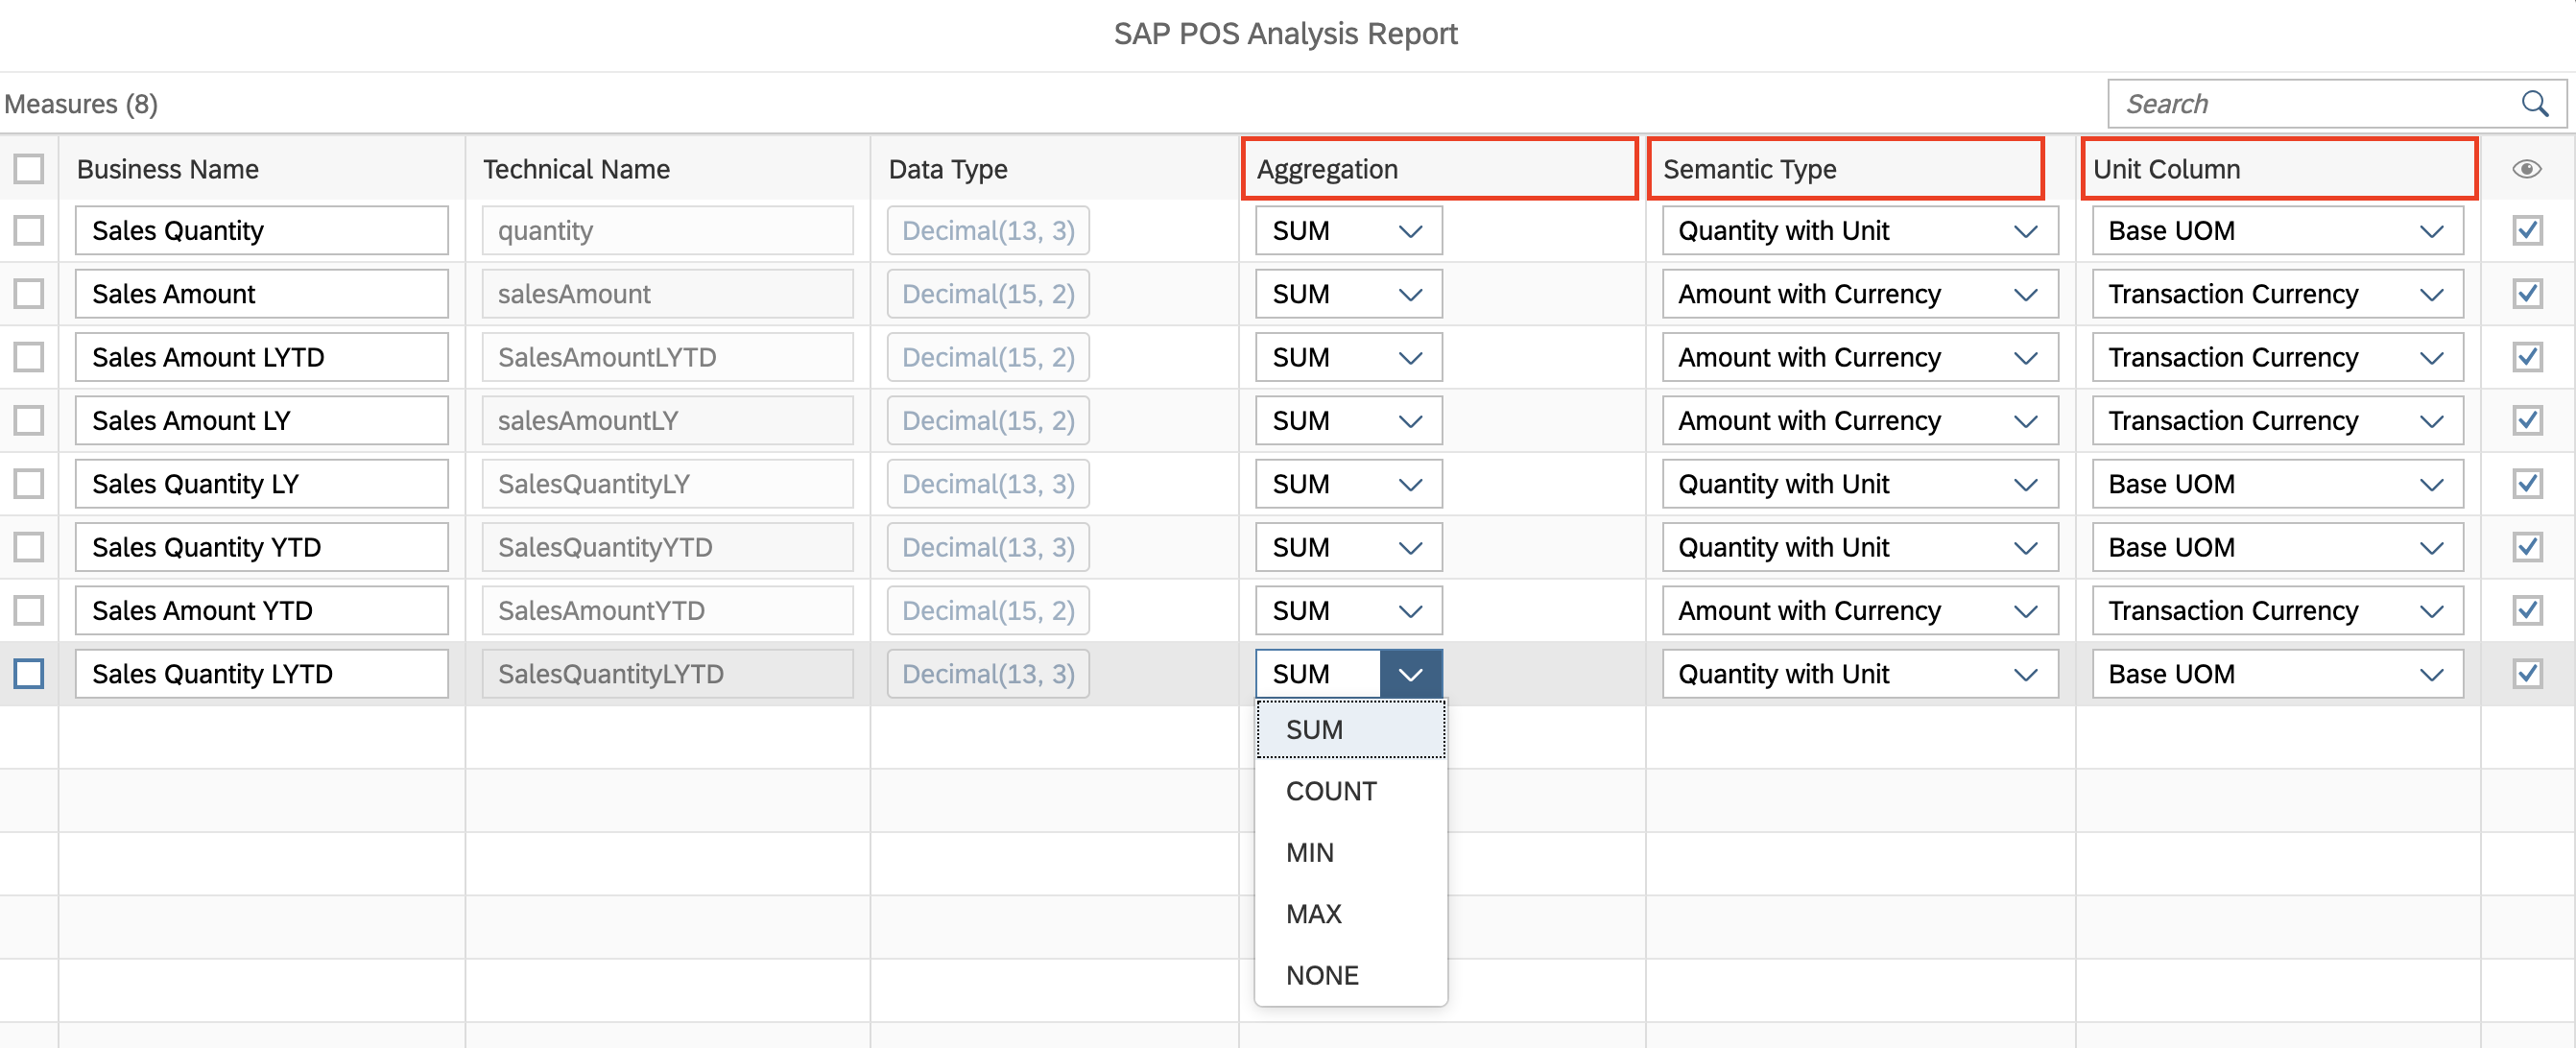
As a consequence, SAP Analytics Cloud can deal with those settings:

To be able to consume all features shown in SAP Analytics Cloud, the master data views are associated to the "Analytical Dataset":

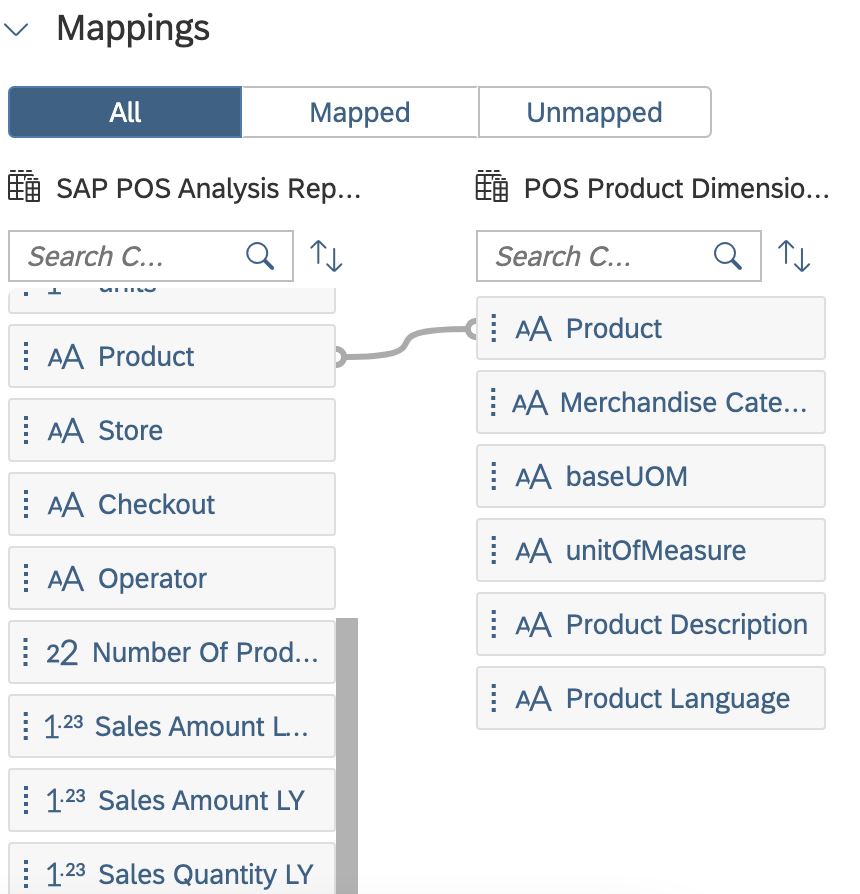
Et voilà:

With this, I will end this blog post. I hope you got a good impression of what the content offers and why it's worth trying it out in your own instance :).
In my next blog post, I will describe how easily it is to deploy this content.
https://blogs.sap.com/2021/06/24/deploy-sap-retail-pos-analysis-sap-data-warehouse-cloud-and-sap-ana...
Regards and stay curious,
Nicole
#build bridges, not silos
- SAP Managed Tags:
- SAP Analytics Cloud,
- SAP Datasphere
Labels:
3 Comments
You must be a registered user to add a comment. If you've already registered, sign in. Otherwise, register and sign in.
Labels in this area
-
ABAP CDS Views - CDC (Change Data Capture)
2 -
AI
1 -
Analyze Workload Data
1 -
BTP
1 -
Business and IT Integration
2 -
Business application stu
1 -
Business Technology Platform
1 -
Business Trends
1,658 -
Business Trends
94 -
CAP
1 -
cf
1 -
Cloud Foundry
1 -
Confluent
1 -
Customer COE Basics and Fundamentals
1 -
Customer COE Latest and Greatest
3 -
Customer Data Browser app
1 -
Data Analysis Tool
1 -
data migration
1 -
data transfer
1 -
Datasphere
2 -
Event Information
1,400 -
Event Information
67 -
Expert
1 -
Expert Insights
177 -
Expert Insights
307 -
General
1 -
Google cloud
1 -
Google Next'24
1 -
GraphQL
1 -
Kafka
1 -
Life at SAP
780 -
Life at SAP
13 -
Migrate your Data App
1 -
MTA
1 -
Network Performance Analysis
1 -
NodeJS
1 -
PDF
1 -
POC
1 -
Product Updates
4,576 -
Product Updates
349 -
Replication Flow
1 -
REST API
1 -
RisewithSAP
1 -
SAP BTP
1 -
SAP BTP Cloud Foundry
1 -
SAP Cloud ALM
1 -
SAP Cloud Application Programming Model
1 -
SAP Datasphere
2 -
SAP S4HANA Cloud
1 -
SAP S4HANA Migration Cockpit
1 -
Technology Updates
6,873 -
Technology Updates
436 -
Workload Fluctuations
1
Related Content
- What’s New in SAP Datasphere Version 2024.9 — Apr 23, 2024 in Technology Blogs by Members
- What’s New in SAP Analytics Cloud Release 2024.09 in Technology Blogs by SAP
- SAP BW/4 - revamp and true to the line 2024 in Technology Blogs by Members
- SAP Analytics Cloud: Support Universal Account Model (UAM) with Custom Widget in Technology Blogs by SAP
- SAP 分析云 2024.08 版功能更新 in Technology Blogs by SAP
Top kudoed authors
| User | Count |
|---|---|
| 24 | |
| 16 | |
| 11 | |
| 10 | |
| 10 | |
| 9 | |
| 9 | |
| 8 | |
| 8 | |
| 7 |