Introduction
SAP HANA Cockpit provides Performance Monitor app to monitoring the various KPIs for Host level and SAP HANA DB service level. This post contains an example to better utilize the features in the Performance Monitor app for the KPI value monitoring.
DIY the Performance Monitoring Layout
We may need to monitor many KPIs to detect the system abnormal situation. For example, CPU related KPIs, memory related KPIs, disk related KPIs, workload related KPIs and so on. It could be difficult to monitor different kinds of KPIs in one chart. Different colors in the chart represent selected KPIs, you may find out it starts to be confusing which line refers to which KPI as the selected KPI number grows.

To display the KPIs easier to be monitored, Add Chart feature could be used. We could categorize KPIs as small groups and display them using separate charts.
For example, CPU KPI chart, memory&disk KPI chart, workload KPI chart and admission control KPI chart.

CPU chart, Memory&Disk chart
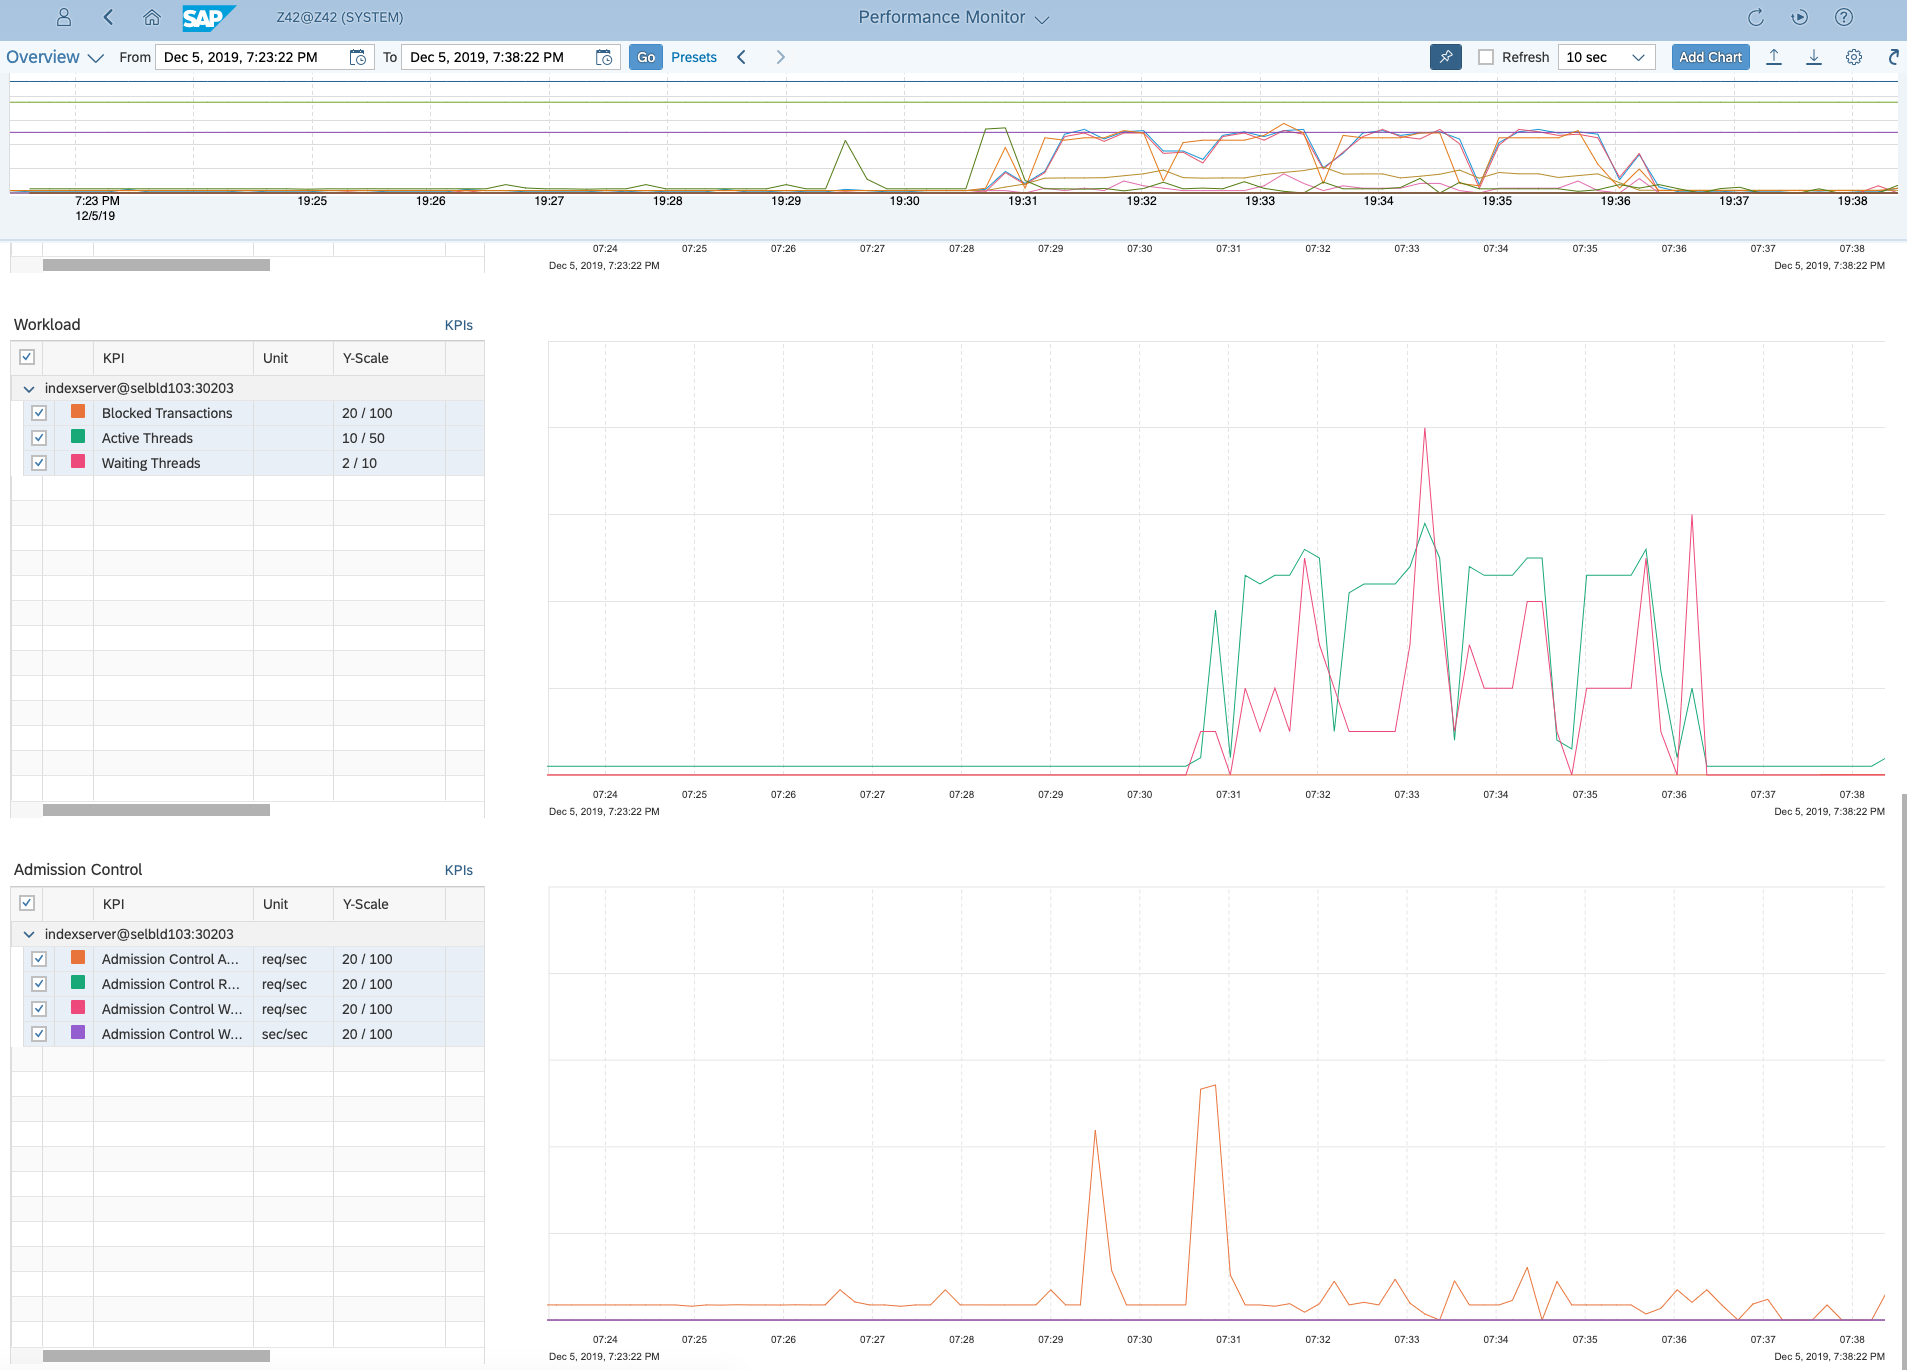
Workload chart, Admission Control chart
Conclusion
By dividing the KPIs groups in the SAP HANA Cockpit Performance Monitor, we could monitor related KPIs in separated charts. It's much clear to monitor the related KPI value change so that a faster decision could be made when there is abnormal KPI value change situation.
