
- SAP Community
- Products and Technology
- Technology
- Technology Blogs by SAP
- Focused Run - Advanced Event & Alert Management (A...
Technology Blogs by SAP
Learn how to extend and personalize SAP applications. Follow the SAP technology blog for insights into SAP BTP, ABAP, SAP Analytics Cloud, SAP HANA, and more.
Turn on suggestions
Auto-suggest helps you quickly narrow down your search results by suggesting possible matches as you type.
Showing results for
former_member59
Explorer
Options
- Subscribe to RSS Feed
- Mark as New
- Mark as Read
- Bookmark
- Subscribe
- Printer Friendly Page
- Report Inappropriate Content
01-01-2019
5:52 AM
Update: Alert Correlation in FRUN by resmi.ks
Newly imagined Alert Management within FRUN, open to integration at both Inbound and Outbound, insightful and responsive user interfaces. Part 1 includes purpose, Scope selector, Overview Page, its Visual Filters and more.
You have known SAP Solution Manager for years. You have most likely heard about Focused Run (FRUN) as well by now. An excerpt from the overview of FRUN that talks about Advanced Event & Alert Management (AEM) goes as follows:
Efficiently handle alerts from thousands of systems, users, and integration-points, including integrated IT infrastructure events.
AEM continues to be the home for all Alerts from the use cases based on Monitoring and Alerting Infrastructure (MAI) of Solution Manager, such as System Monitoring and Open Component Monitoring, which are re imagined within FRUN. It also becomes the home for alerts from all other use cases included in FRUN, not all are necessarily modeled on MAI. It could also serve as Alert Management tool for infrastructures that are deployed to work together with FRUN.
Apart from thus being open on the Inbound, AEM offers the flexibility at Outbound as well. Implementing its well documented interface (check here), alerts may be forwarded to virtually any other ticketing tool.
What else? Does it change the way end-users deal with hundreds, or even thousands of Alerts from large landscapes spread across many data centers? Does it aid in any way to prioritize the work? Does it scale? Does it exploit the powers of SAP HANA? Does it use state-of-the art user interfaces to make self-learning happen in a matter of days? Are we more likely to succeed in making it work for us, rather than adjusting our working style to fit it?
There could be many such questions in your mind. If you have already started playing with AEM as either an end-user, or, a service provider, or a developer integrating it with other infrastructures, chances are that you have figured out some of these yourself. The idea of this write up is to compliment your hands-on experience, and not replace a full-fledged technical documentation.
Screen shots from the product of version FRUN 2.0 FP00 are used herein. It would be possible to relate, even if you are using a previous version.
AEM is continuing to innovate, and there could be further changes in future versions.
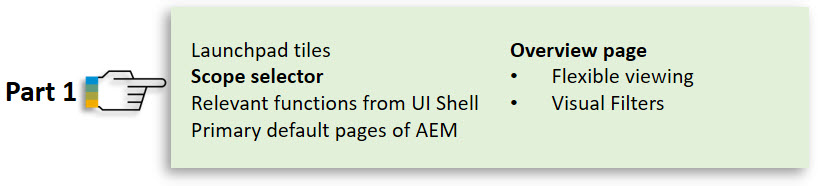
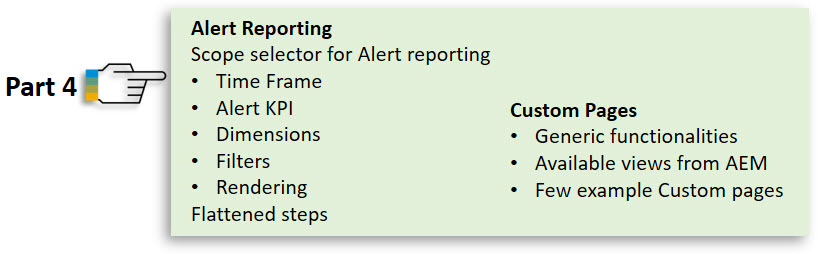
This series is divided in five parts, as shown below.


Let us get started, then, on exploring AEM.
Let us assume we have referred to all the detailed information found in FRUN expert portal, and preparation of AEM in particular, and FRUN including AEM has been set up appropriately. We would then launch the SAP Fiori based launchpad for FRUN and navigate to “Advanced Event & Alert Management” section.
You would have noticed a number on the “Alert Management” tile. This is the number of Open Alerts within the “Scope”.
Every application included in the UI shell of FRUN works on a “Scope” that may be selected in flexible ways. Scope consists of many landscape elements. Any combination of these elements with one or more values for each, may be personalized for every user who logs in, or even be shared among users. These selection-variants could be persisted across sessions, or even system restarts. More we explore, more ideas we would get, on how to easily control the Alerts we want to deal with.

Some elements within the Scope are AEM specific.
Use cases not based on MAI, often do not use LMDB (Landscape Management Data Base) either. In other words, not all managed objects (which are source of Alerts) are defined or maintained in LMDB. These, therefore, cannot be selected via the scope selector based on LMDB elements. AEM extends the scope selector by three additional fields, which are generically named as “Monitoring use case”, “Managed Object type” and “Managed Object Name”. These may be selected from within the “Filters”, under the section “Additional Scope”, and keeping “Show on Filter Bar” ON.
Let us choose a few of the fields and keep it in a view called “Many fields in Scope”:

Let us specify some values in some of the chosen fields, just as examples.
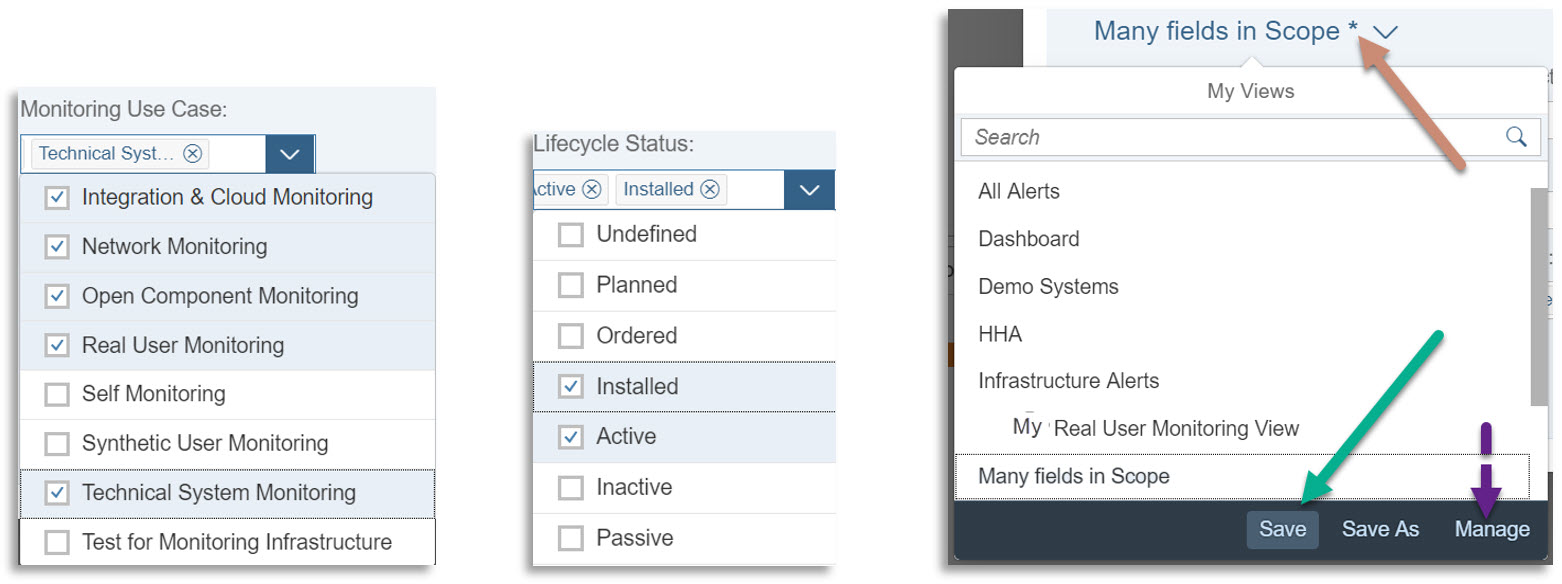
The small “*” by the side of the name of the view we just made up, indicates that there are changes to this view of the scope, which are not “Saved” yet. If we do not save, it would still be possible to apply the chosen scope for the current UI session. If we intend to use it later as well, across application refresh, or even system restarts, we would “Save” the view.
Using “Manage”, we could have saved the view as “Public” (under “Sharing”), if we wanted other colleagues too to use it. We could also choose to get it applied “Automatically” every time we launch AEM, and so on. Let us leave rest of these experiments for the reader, as per his / her needs.

Indeed, we may save multiple such “Views”. And we need not deal with these filter-values inside the Scope all the time. We would keep the filter bar hidden in regular day’s work. We would simply pick the one view we intend to use at a given point in time and hit the button “Go”.

As with all applications within FRUN, AEM UIs are also seamlessly embedded within the “UI shell” of FRUN. This shell is the outer frame holding any FRUN Application and offering some of the most common functionalities.
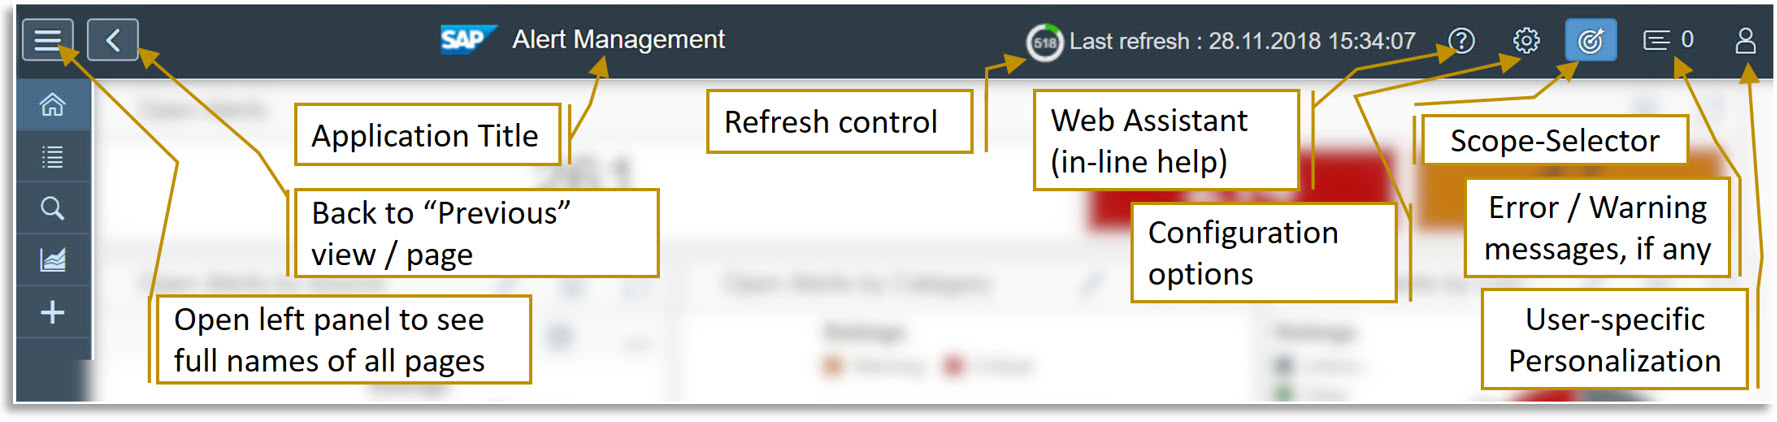
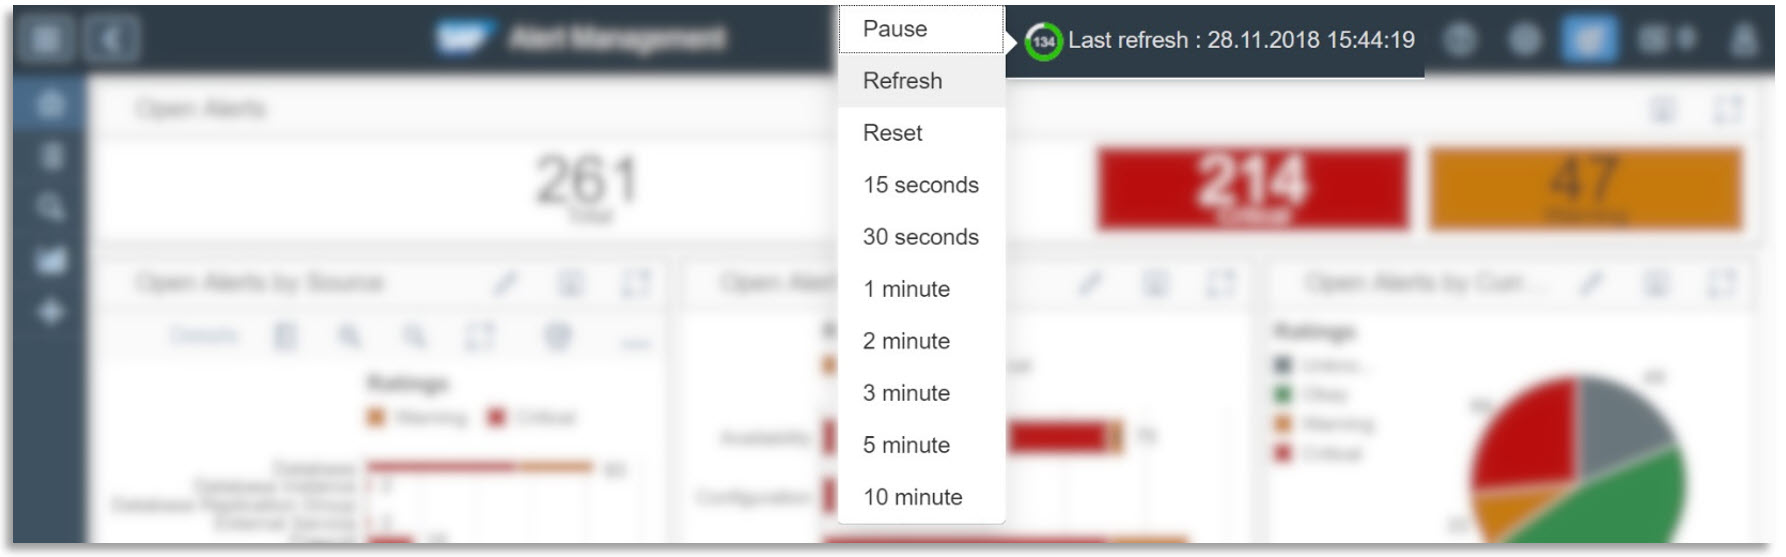
Some of these such as “Personalization” and “Configuration” would become interesting once we get familiar with the application. Some others such as the “Refresh” control is already straight-forward. The “Pause” is particularly useful in the learning phase. Once we discover the optimum refresh interval for a given application, we may leave it at that.
Now, we are ready to explore Alert Management UIs and its features in detail.
On the top-left corner of the shell, we find an icon to expand the left panel, and discover that AEM comes with some pages by default, such as “Overview”, “Open Alert List”, “Alert Search”, “Alert Reporting” and of course, an option to “Add Custom Page”.

Once we add one or more of those Custom Pages, you would find those here, on the left panel of the Shell. We would talk about these in detail later in this series.
On the Overview Page, we find a set of charts, numbers, certainly! What are those and why on overview, knowing that we have a dedicated page for “Alert Reporting” as well? Let us see.
When it comes to managing alerts, a large number of those from a large landscape of many SAP and non-SAP systems, devices, having a sense of the big picture before getting lost into the hundreds of the alerts, always helps.
How is our landscape doing, overall, in terms of alert-handling?
Following are some example charts included in the Overview page. These are quite responsive, render quite well on devices of different screen size, screen resolution. Within a screen too, one may play around with resizing one or more charts, zoom in or out, allow one view to occupy the full screen while view the others separately, and so on. Playing with the options exposed by clicking on the “Pencil” icon would be the best way to make experience here.
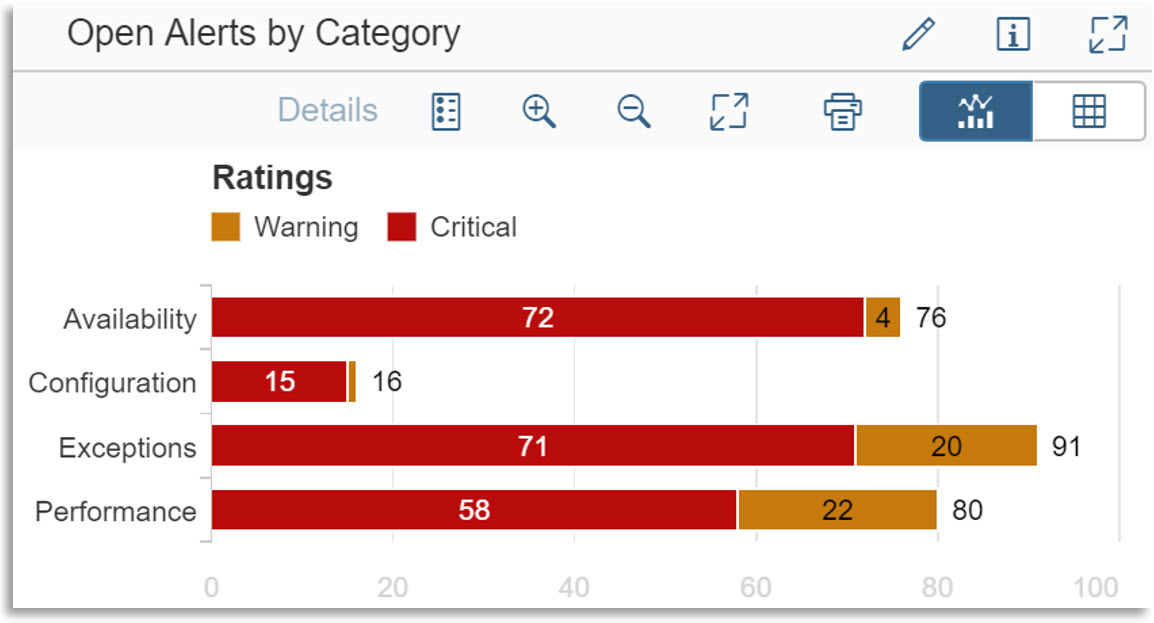

Some of these charts would allow us to select the maximum number of “Top entities” that we are interested in viewing as a part of the big-picture.

Should we want a tabular view of the numbers on the chart, and also download the same, a couple more clicks will get the job done.
These are merely some example charts on the overview page. We could change the “Scope”, save many such views that are important for our work, in our own custom pages.
While these intuitive charts already instill a sense of prioritization for the Alert processors, nearly each part on any chart is clickable and upon click, it presents the user with a list of those alerts that belonged to that part.
If we clicked on the label “Performance”, for example, we are going to view those Open alerts that represent some performance issues, rated either Critical (Red) or Warning (Yellow).
Should we want a more precise list only of those alerts that relate to performance and at the same time rated as Critical (Red), we click on the Red part of the respective chart.
There are alerts that have currently turned Green, that is, got automatically resolved by some changes in the managed system / device, or by some processor’s action. Should we want to quickly get down to these alerts so that we may select and Confirm these at one go, we click on the Green sector of that Pie.
In other words, the various sections of the charts work as Visual Filters.
Upfront viewing of the overall situation with all alerts in our landscape, the possibility to drill down to specific subsets of Alerts via those visual filters thus saves a lot of time, helps prioritization and gets us going in a matter of minutes. That’s the purpose of this overview page. And taking inspiration from this, we may organize many other custom pages based on our personal choices or based on how the alert processors divide workload among them.
In next parts of the series, we would explore many other sides of AEM.
Newly imagined Alert Management within FRUN, open to integration at both Inbound and Outbound, insightful and responsive user interfaces. Part 1 includes purpose, Scope selector, Overview Page, its Visual Filters and more.
FRUN AEM Part 1 | Part 2 | Part 3 | Part 4 | Part 5
Prelude
You have known SAP Solution Manager for years. You have most likely heard about Focused Run (FRUN) as well by now. An excerpt from the overview of FRUN that talks about Advanced Event & Alert Management (AEM) goes as follows:
Efficiently handle alerts from thousands of systems, users, and integration-points, including integrated IT infrastructure events.
- Dashboard-oriented and intuitive alert management user interface as central access point for all alerts from all monitoring use cases in FRUN.
- Alert Search, Alert Reporting and Alert Correlation for efficient handling of high volumes of alerts.
- Automated guided procedure execution for alert problem context collection and follow -up actions
- Inbound integration to receive metrics and events from external monitoring tools such as IT Infrastructure Management tools.
- Outbound integration available out -of-the -box via OS scripts & SNMP traps adapter or customer specific extension e.g. for ticket management integration.
If this is where you stopped and wondered, where could you get some more details, read on!
AEM continues to be the home for all Alerts from the use cases based on Monitoring and Alerting Infrastructure (MAI) of Solution Manager, such as System Monitoring and Open Component Monitoring, which are re imagined within FRUN. It also becomes the home for alerts from all other use cases included in FRUN, not all are necessarily modeled on MAI. It could also serve as Alert Management tool for infrastructures that are deployed to work together with FRUN.
Apart from thus being open on the Inbound, AEM offers the flexibility at Outbound as well. Implementing its well documented interface (check here), alerts may be forwarded to virtually any other ticketing tool.
This means, AEM in FRUN is open to integration with many other tools, applications and / or infrastructures of Customers’ choice, on both sides of the spectrum of Problem-discovery, Analysis, and Resolution.
What else? Does it change the way end-users deal with hundreds, or even thousands of Alerts from large landscapes spread across many data centers? Does it aid in any way to prioritize the work? Does it scale? Does it exploit the powers of SAP HANA? Does it use state-of-the art user interfaces to make self-learning happen in a matter of days? Are we more likely to succeed in making it work for us, rather than adjusting our working style to fit it?
There could be many such questions in your mind. If you have already started playing with AEM as either an end-user, or, a service provider, or a developer integrating it with other infrastructures, chances are that you have figured out some of these yourself. The idea of this write up is to compliment your hands-on experience, and not replace a full-fledged technical documentation.
Screen shots from the product of version FRUN 2.0 FP00 are used herein. It would be possible to relate, even if you are using a previous version.
AEM is continuing to innovate, and there could be further changes in future versions.
This series is divided in five parts, as shown below.
Let us get started, then, on exploring AEM.
Launchpad Tiles
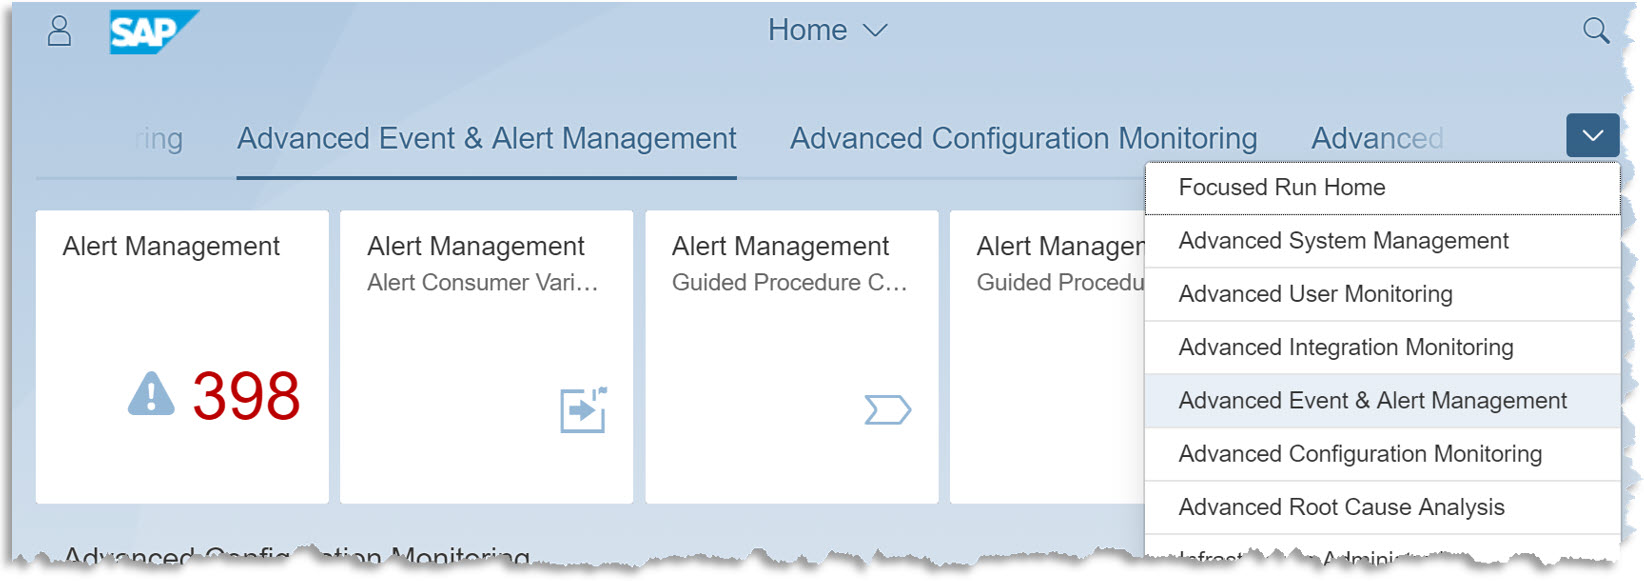
Let us assume we have referred to all the detailed information found in FRUN expert portal, and preparation of AEM in particular, and FRUN including AEM has been set up appropriately. We would then launch the SAP Fiori based launchpad for FRUN and navigate to “Advanced Event & Alert Management” section.
You would have noticed a number on the “Alert Management” tile. This is the number of Open Alerts within the “Scope”.
Scope Selector
Every application included in the UI shell of FRUN works on a “Scope” that may be selected in flexible ways. Scope consists of many landscape elements. Any combination of these elements with one or more values for each, may be personalized for every user who logs in, or even be shared among users. These selection-variants could be persisted across sessions, or even system restarts. More we explore, more ideas we would get, on how to easily control the Alerts we want to deal with.
Some elements within the Scope are AEM specific.
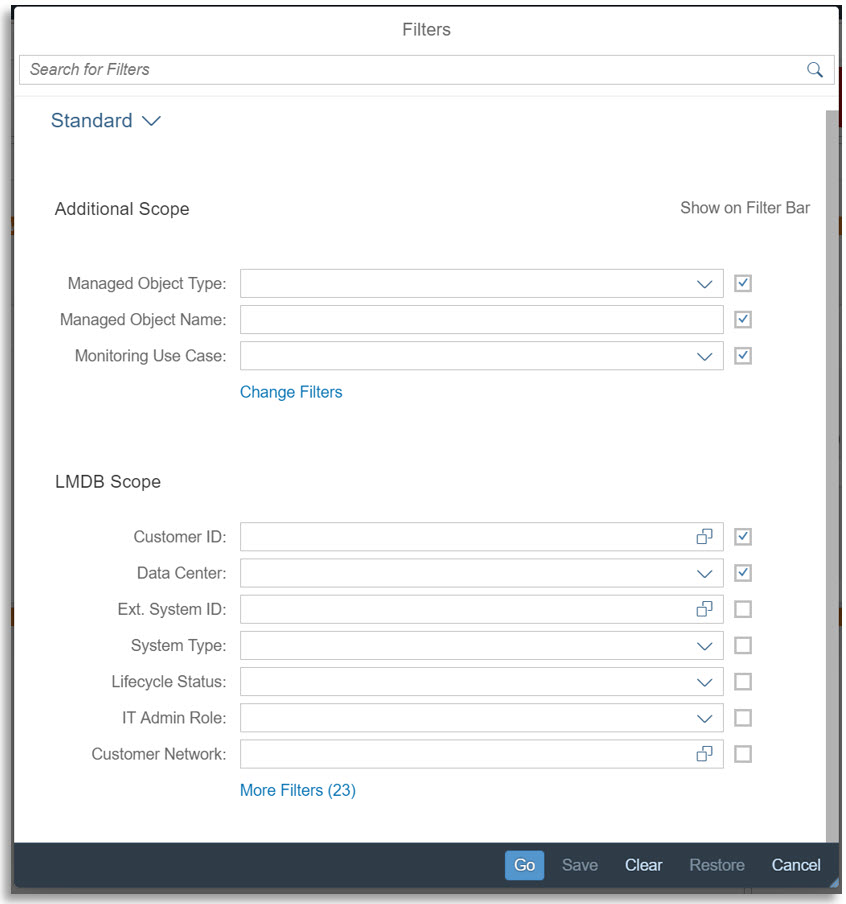
Use cases not based on MAI, often do not use LMDB (Landscape Management Data Base) either. In other words, not all managed objects (which are source of Alerts) are defined or maintained in LMDB. These, therefore, cannot be selected via the scope selector based on LMDB elements. AEM extends the scope selector by three additional fields, which are generically named as “Monitoring use case”, “Managed Object type” and “Managed Object Name”. These may be selected from within the “Filters”, under the section “Additional Scope”, and keeping “Show on Filter Bar” ON.
Let us choose a few of the fields and keep it in a view called “Many fields in Scope”:
Let us specify some values in some of the chosen fields, just as examples.
The small “*” by the side of the name of the view we just made up, indicates that there are changes to this view of the scope, which are not “Saved” yet. If we do not save, it would still be possible to apply the chosen scope for the current UI session. If we intend to use it later as well, across application refresh, or even system restarts, we would “Save” the view.
Using “Manage”, we could have saved the view as “Public” (under “Sharing”), if we wanted other colleagues too to use it. We could also choose to get it applied “Automatically” every time we launch AEM, and so on. Let us leave rest of these experiments for the reader, as per his / her needs.
Indeed, we may save multiple such “Views”. And we need not deal with these filter-values inside the Scope all the time. We would keep the filter bar hidden in regular day’s work. We would simply pick the one view we intend to use at a given point in time and hit the button “Go”.
Relevant functions from UI Shell
As with all applications within FRUN, AEM UIs are also seamlessly embedded within the “UI shell” of FRUN. This shell is the outer frame holding any FRUN Application and offering some of the most common functionalities.
Some of these such as “Personalization” and “Configuration” would become interesting once we get familiar with the application. Some others such as the “Refresh” control is already straight-forward. The “Pause” is particularly useful in the learning phase. Once we discover the optimum refresh interval for a given application, we may leave it at that.
Now, we are ready to explore Alert Management UIs and its features in detail.
Primary default pages of AEM
On the top-left corner of the shell, we find an icon to expand the left panel, and discover that AEM comes with some pages by default, such as “Overview”, “Open Alert List”, “Alert Search”, “Alert Reporting” and of course, an option to “Add Custom Page”.
Once we add one or more of those Custom Pages, you would find those here, on the left panel of the Shell. We would talk about these in detail later in this series.
Overview page
On the Overview Page, we find a set of charts, numbers, certainly! What are those and why on overview, knowing that we have a dedicated page for “Alert Reporting” as well? Let us see.
When it comes to managing alerts, a large number of those from a large landscape of many SAP and non-SAP systems, devices, having a sense of the big picture before getting lost into the hundreds of the alerts, always helps.
Flexible viewing of the big picture
How is our landscape doing, overall, in terms of alert-handling?
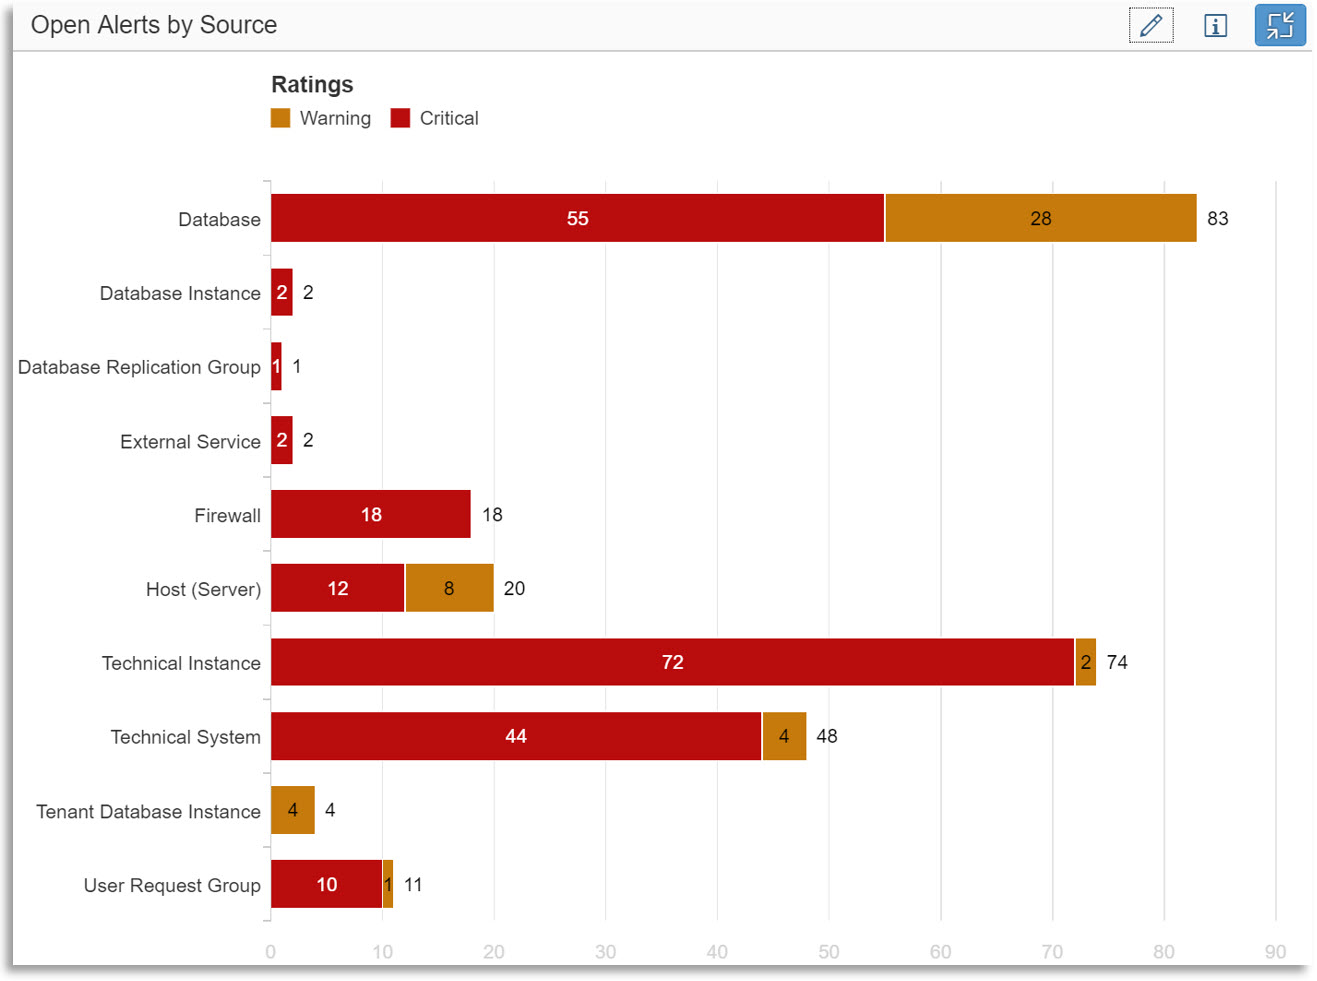
How many of alerts that are currently Open and are also Critical, versus those that are Warnings?
Which are the types of managed objects that are currently experiencing most alerts?
Are the leading number of alerts about “Availability”, or, “Performance”, or “Exceptions”, or of some other category?
How many Alerts, though were critical when first reported, became less-critical by now, as per their current rating?
Which alerts are most pervasive, that is, affecting most number of managed objects?
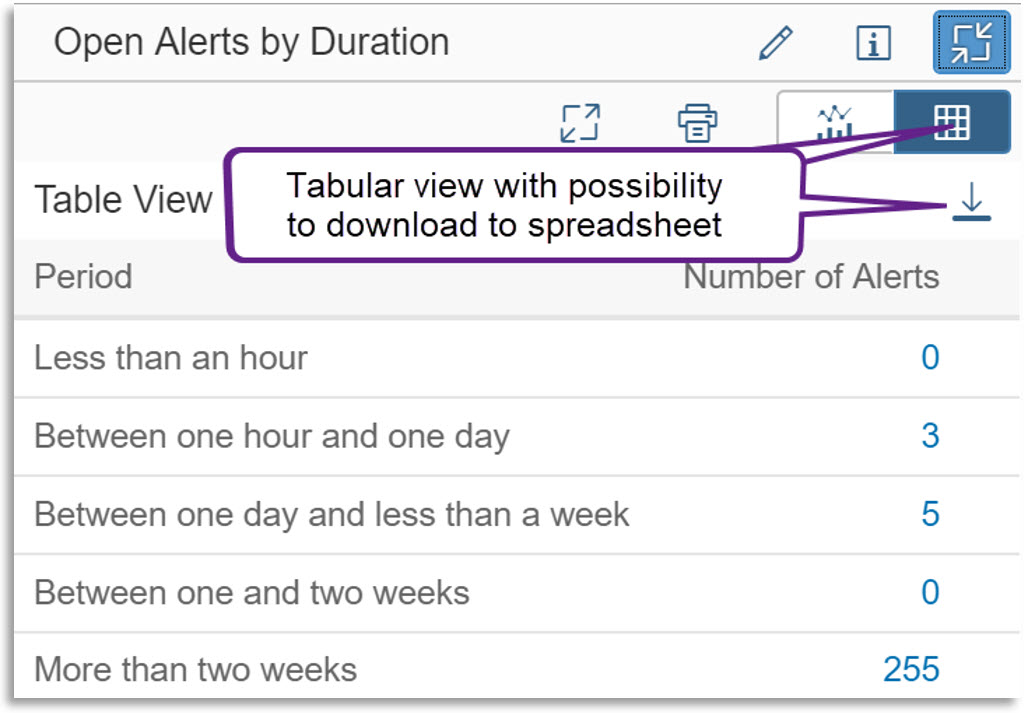
Which alerts are lying open for too long, such as more than two weeks?
Following are some example charts included in the Overview page. These are quite responsive, render quite well on devices of different screen size, screen resolution. Within a screen too, one may play around with resizing one or more charts, zoom in or out, allow one view to occupy the full screen while view the others separately, and so on. Playing with the options exposed by clicking on the “Pencil” icon would be the best way to make experience here.
Some of these charts would allow us to select the maximum number of “Top entities” that we are interested in viewing as a part of the big-picture.
Should we want a tabular view of the numbers on the chart, and also download the same, a couple more clicks will get the job done.
These are merely some example charts on the overview page. We could change the “Scope”, save many such views that are important for our work, in our own custom pages.
What else? Are these only for the senior management, or, the Technical Landscape Owner (TLO), or mere number-crunching for analysts? Or, could these double-up as helping hand for the ones who are tasked to view and resolve alerts in as minimal time as they could?
Visual Filters
While these intuitive charts already instill a sense of prioritization for the Alert processors, nearly each part on any chart is clickable and upon click, it presents the user with a list of those alerts that belonged to that part.
If we clicked on the label “Performance”, for example, we are going to view those Open alerts that represent some performance issues, rated either Critical (Red) or Warning (Yellow).
Should we want a more precise list only of those alerts that relate to performance and at the same time rated as Critical (Red), we click on the Red part of the respective chart.
There are alerts that have currently turned Green, that is, got automatically resolved by some changes in the managed system / device, or by some processor’s action. Should we want to quickly get down to these alerts so that we may select and Confirm these at one go, we click on the Green sector of that Pie.
In other words, the various sections of the charts work as Visual Filters.
Upfront viewing of the overall situation with all alerts in our landscape, the possibility to drill down to specific subsets of Alerts via those visual filters thus saves a lot of time, helps prioritization and gets us going in a matter of minutes. That’s the purpose of this overview page. And taking inspiration from this, we may organize many other custom pages based on our personal choices or based on how the alert processors divide workload among them.
In next parts of the series, we would explore many other sides of AEM.
FRUN AEM Part 1 | Part 2 | Part 3 | Part 4 | Part 5
- SAP Managed Tags:
- SAP Focused Run,
- SAP Solution Manager
Labels:
- alert api
- alert consumer
- alert consumer connector
- alert framework
- alert inbox
- alert integration
- alert log
- alert management
- Alert Message
- alert rating
- alert resolution
- Application Lifecycle Management
- guided procedures
- itil
- itsm
- Monitoring & Alerting Infrastructure
- Monitoring and Error Handling
- monitoring and troubleshooting
- root cause analysis
6 Comments
You must be a registered user to add a comment. If you've already registered, sign in. Otherwise, register and sign in.
Labels in this area
-
ABAP CDS Views - CDC (Change Data Capture)
2 -
AI
1 -
Analyze Workload Data
1 -
BTP
1 -
Business and IT Integration
2 -
Business application stu
1 -
Business Technology Platform
1 -
Business Trends
1,658 -
Business Trends
94 -
CAP
1 -
cf
1 -
Cloud Foundry
1 -
Confluent
1 -
Customer COE Basics and Fundamentals
1 -
Customer COE Latest and Greatest
3 -
Customer Data Browser app
1 -
Data Analysis Tool
1 -
data migration
1 -
data transfer
1 -
Datasphere
2 -
Event Information
1,400 -
Event Information
67 -
Expert
1 -
Expert Insights
177 -
Expert Insights
307 -
General
1 -
Google cloud
1 -
Google Next'24
1 -
GraphQL
1 -
Kafka
1 -
Life at SAP
780 -
Life at SAP
13 -
Migrate your Data App
1 -
MTA
1 -
Network Performance Analysis
1 -
NodeJS
1 -
PDF
1 -
POC
1 -
Product Updates
4,576 -
Product Updates
349 -
Replication Flow
1 -
REST API
1 -
RisewithSAP
1 -
SAP BTP
1 -
SAP BTP Cloud Foundry
1 -
SAP Cloud ALM
1 -
SAP Cloud Application Programming Model
1 -
SAP Datasphere
2 -
SAP S4HANA Cloud
1 -
SAP S4HANA Migration Cockpit
1 -
Technology Updates
6,873 -
Technology Updates
435 -
Workload Fluctuations
1
Related Content
- The 2024 Developer Insights Survey: The Report in Technology Blogs by SAP
- Hybrid Architectures: A Modern Approach for SAP Data Integration in Technology Blogs by SAP
- Vectorize your data for Infuse AI in to Business using Hana Vector and Generative AI in Technology Blogs by Members
- Enhance your SAP Datasphere Experience with API Access in Technology Blogs by SAP
- Improving Time Management in SAP S/4HANA Cloud: A GenAI Solution in Technology Blogs by SAP
Top kudoed authors
| User | Count |
|---|---|
| 25 | |
| 17 | |
| 11 | |
| 11 | |
| 9 | |
| 9 | |
| 9 | |
| 8 | |
| 8 | |
| 7 |