

- SAP Community
- Products and Technology
- Technology
- Technology Blogs by SAP
- Data visualisation with Focused Insights: Advanced...
Technology Blogs by SAP
Learn how to extend and personalize SAP applications. Follow the SAP technology blog for insights into SAP BTP, ABAP, SAP Analytics Cloud, SAP HANA, and more.
Turn on suggestions
Auto-suggest helps you quickly narrow down your search results by suggesting possible matches as you type.
Showing results for
Product and Topic Expert
Options
- Subscribe to RSS Feed
- Mark as New
- Mark as Read
- Bookmark
- Subscribe
- Printer Friendly Page
- Report Inappropriate Content
11-05-2018
8:29 PM
Learn about the different options for data visualisation available in SAP Focused Insights for SAP Solution Manager?
This blog describes some key advanced features of Focused Insights to build the perfect data visualisation for your IT organisation.
The following topics are covered:
An introduction for the data visualisation options is available here: https://blogs.sap.com/2018/07/02/data-visualisation-with-focused-insights/
You can check chart details in the following blog: https://blogs.sap.com/2018-07-02/data-visualisation-with-focused-insights-chart-description
You can easily create and maintain dashboards using the copy & paste interface to manipulate dashboards layout, gadgets or queries.
A preview panel provides you with the capabilities to check the content and the visualisation of each gadget before saving your work.


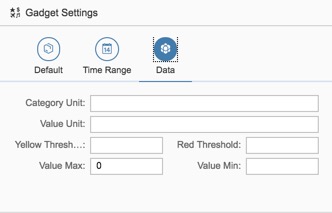


Some renderers supports color-rating based on thresholds (yellow and red).
They could be defined at the gadget level:

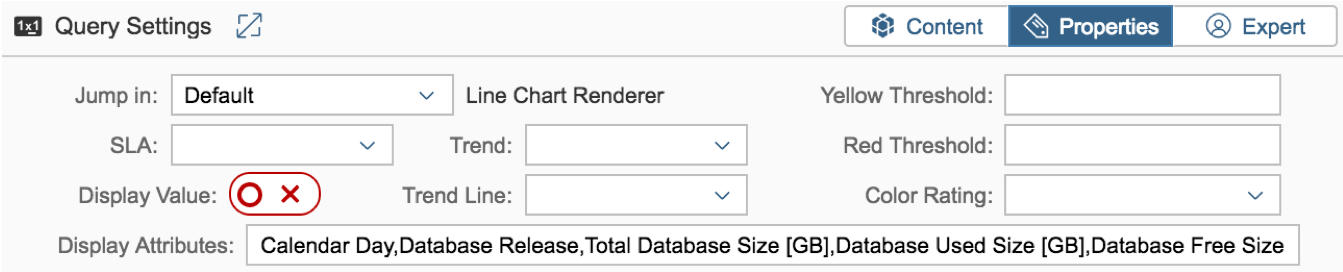
or at the query level. In this case, the gadget settings is overridden with the queries values.

The behaviour of the Renderer could be controlled for each query based on the Color Rating parameter:

Five renderers adapt their display to the color-rating properties:

From the information button accessible in the gadget menu, you can see the period, the resolution, and the timestamp update of the chart data.
The timestamp is marked with an 'Asterix', indicates that the data has been retrieved from the cache.

You have two options to refresh data content for individual charts:

Users with administrators rights can always clean globally the cache from the top-left menu bar.

The Dynamic Table Renderer is used to display a set of rows/columns data. The content of the table depends on the type of data provider:

The attribute Display Attribute is used to:
For example, the following attributes values:

will produce the following results:

Filtering is supported for each columns by clicking on the column headers.

The SLR renderer is used to display Service Level Objectives compliancy.
The datasets return by singles queries need to be translated in a single value.
5 types of SLA methods are supported by the SLA attributes

Thanks for reading.
This blog describes some key advanced features of Focused Insights to build the perfect data visualisation for your IT organisation.
The following topics are covered:
- Content Distribution
- Content Creation
- Time manipulation
- Chart Dimensions
- Chart Details
- Rating
- Cache Management
- SLA algorithms
An introduction for the data visualisation options is available here: https://blogs.sap.com/2018/07/02/data-visualisation-with-focused-insights/
You can check chart details in the following blog: https://blogs.sap.com/2018-07-02/data-visualisation-with-focused-insights-chart-description
Content Distribution
Start Option
- The URL parameter fullscreen=true starts dashboard in full screen.
- The URL parameter autoSwitchOnIdle=true starts dashboard in carousel mode.
- The URL parameter RefreshTimer=10 set the refresh timer to 10 seconds.
- The URL parameter ColorScheme is used to set either the Light or the Dark mode of your dashboards.
- The URL parameter AutoSwitchOnIdle=true is used to activate the carousel mode.
Content Creation
You can easily create and maintain dashboards using the copy & paste interface to manipulate dashboards layout, gadgets or queries.
A preview panel provides you with the capabilities to check the content and the visualisation of each gadget before saving your work.
Preview
- Each change in the gadget or queries settings can be visualised in the preview panel:
Gadget / query manipulation
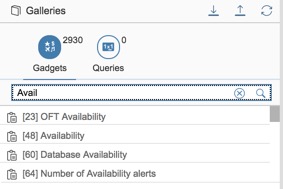
- Queries are managed using the 'copy' icon to place the corresponding query in the Gallery panel,
- The 'paste' icon copy the query from the Gallery panel to the selected gadget.
- You can paste gadgets from the Galleries tab to an empty place holder in the dashboard layout.
Gadget / query reordering
- Gadgets can be reordered directly from the dashboard layout with a drag&drop operation.
- Queries can be reordered directly from the query list from the icon below
Adjust chart scale
- Value Min and Value Max in gadget configuration can be set for scale manipulation of charts.
- Auto adjustmentIn addition, if no scale is set for a specific gadget, the chart will try to adjust the scale automatically based on the dataset values returned by the gadgets queries.For example, line chart with data value range from 80 to 100, the value axis scale will start somewhere near 80.
Time manipulation
Period / Resolution
- The default period and default resolution are defined at the dashboard level in the dashboard settings tabs:
- It can be overridden at the gadget level in the gadget settings tab:
- At runtime, the time dimension can be updated by setting a Global Time Range for all gadgets using 'Auto/Auto' as period/resolution:
- Gadgets using a pre-defined period/resolution will not be affected by the Global Time Range settings.
Chart Dimensions
Main and Drill-down Dimensions
- You can define a drill-down dimension for a main dimension in each query legend as shown below:
- Drill-down dimension are exploited differently depending on the types of renderers:
Stack Column chart 2 label
SLR Table Renderer
SLR Table History Renderer
Bubble Chart
Chart Details
Jump-in Renderer
- Being able to get chart details in different forms is a key capabilities for data analysis.With the Jump-in parameters of the Query Settings tabs, you can either jump to a specific dashboard, a given gadget or a specific renderer.
- Chart details are usually accessed by clicking on the chart legend:
- The chart details are shown in a sub panel accessible from the dashboard bread-crumb navigation.
Rating
Thresholds
Some renderers supports color-rating based on thresholds (yellow and red).
They could be defined at the gadget level:
or at the query level. In this case, the gadget settings is overridden with the queries values.
Rating
The behaviour of the Renderer could be controlled for each query based on the Color Rating parameter:
Renderers
Five renderers adapt their display to the color-rating properties:
- SLR Renderer
- SLR Table Renderer
- Table History Renderer
- Trend Table Renderer
- Donut Chart
Cache Management
Cache validity
From the information button accessible in the gadget menu, you can see the period, the resolution, and the timestamp update of the chart data.
The timestamp is marked with an 'Asterix', indicates that the data has been retrieved from the cache.
Hard reload
You have two options to refresh data content for individual charts:
- The Refresh action will get the data from the cache if the data are still valid for the selected period/resolution.
- The Hard Reload always bypasses the cache.
Clean Cache
Users with administrators rights can always clean globally the cache from the top-left menu bar.
Tables Manipulation
Renderer
The Dynamic Table Renderer is used to display a set of rows/columns data. The content of the table depends on the type of data provider:
Columns
The attribute Display Attribute is used to:
- select the columns to be displayed in the table,
- rename columns headers,
- and order the columns
For example, the following attributes values:
will produce the following results:
Filtering is supported for each columns by clicking on the column headers.
SLA Algorithms
The SLR renderer is used to display Service Level Objectives compliancy.
The datasets return by singles queries need to be translated in a single value.
5 types of SLA methods are supported by the SLA attributes
- Average: dataset values average.
- Max: maximum value of the dataset.
- Min: minimum value of the dataset.
- Last: Last value of the dataset.
- Sum: Accumulation of all values of the dataset.
Thanks for reading.
- SAP Managed Tags:
- SAP Solution Manager
Labels:
You must be a registered user to add a comment. If you've already registered, sign in. Otherwise, register and sign in.
Labels in this area
-
ABAP CDS Views - CDC (Change Data Capture)
2 -
AI
1 -
Analyze Workload Data
1 -
BTP
1 -
Business and IT Integration
2 -
Business application stu
1 -
Business Technology Platform
1 -
Business Trends
1,658 -
Business Trends
95 -
CAP
1 -
cf
1 -
Cloud Foundry
1 -
Confluent
1 -
Customer COE Basics and Fundamentals
1 -
Customer COE Latest and Greatest
3 -
Customer Data Browser app
1 -
Data Analysis Tool
1 -
data migration
1 -
data transfer
1 -
Datasphere
2 -
Event Information
1,400 -
Event Information
67 -
Expert
1 -
Expert Insights
177 -
Expert Insights
310 -
General
1 -
Google cloud
1 -
Google Next'24
1 -
GraphQL
1 -
Kafka
1 -
Life at SAP
780 -
Life at SAP
13 -
Migrate your Data App
1 -
MTA
1 -
Network Performance Analysis
1 -
NodeJS
1 -
PDF
1 -
POC
1 -
Product Updates
4,576 -
Product Updates
353 -
Replication Flow
1 -
REST API
1 -
RisewithSAP
1 -
SAP BTP
1 -
SAP BTP Cloud Foundry
1 -
SAP Cloud ALM
1 -
SAP Cloud Application Programming Model
1 -
SAP Datasphere
2 -
SAP S4HANA Cloud
1 -
SAP S4HANA Migration Cockpit
1 -
Technology Updates
6,873 -
Technology Updates
441 -
Workload Fluctuations
1
Related Content
- SAP BTP Innobytes – April 2024 in Technology Blogs by SAP
- The 2024 Developer Insights Survey: The Report in Technology Blogs by SAP
- Explore the SAP HANA Cloud vector engine with a free learning experience in Technology Blogs by SAP
- Improving Time Management in SAP S/4HANA Cloud: A GenAI Solution in Technology Blogs by SAP
- SAP HANA Cloud Vector Engine: Quick FAQ Reference in Technology Blogs by SAP
Top kudoed authors
| User | Count |
|---|---|
| 19 | |
| 14 | |
| 12 | |
| 11 | |
| 10 | |
| 9 | |
| 8 | |
| 8 | |
| 8 | |
| 7 |