
- SAP Community
- Products and Technology
- Technology
- Technology Blogs by SAP
- Another View on Link Analysis: Are Error Log Files...
Technology Blogs by SAP
Learn how to extend and personalize SAP applications. Follow the SAP technology blog for insights into SAP BTP, ABAP, SAP Analytics Cloud, SAP HANA, and more.
Turn on suggestions
Auto-suggest helps you quickly narrow down your search results by suggesting possible matches as you type.
Showing results for
Employee
Options
- Subscribe to RSS Feed
- Mark as New
- Mark as Read
- Bookmark
- Subscribe
- Printer Friendly Page
- Report Inappropriate Content
05-28-2018
9:27 AM
Error Log files and social? This doesn’t sound like it belongs together at the first glance, but let’s have a deeper look. To answer this question, we first need to understand what a social network is.
As defined in the SAP Predictive Analytics Automated Analytics User Guides: “A social network is a social structure represented in the form of a graph, made of nodes and links.
The nodes are the actors/items within a network (individuals, customers, products, organizations…). The links are the relations, or social interactions, between them.
A node can have several variables associated to it (name, address, profession, age…).
In its simplest form, a social network is a map of all the relevant links between the nodes being studied.
Social networks can be used to represent many kinds of networks: informational (web, blogs), communicational (phone calls, emails), social (social networking, illness), technological (power grid, roads, internet router), financial (transactions), etc.”
This definition implies that this kind of analysis supports predictive use cases across different industries, like Insurance, Public Sector, Retail, Manufacturing, and Banking. However, the Link Analysis of Predictive Analytics is mainly used in the Retail area for market Basket Analysis. This use case doesn’t show the full potential of this powerful Analysis. At the same time industries as manufacturing want mostly to do predictive maintenance or predictive quality but don’t have the necessary data. In reality they are very motivated to equip their machines with the necessary sensors and collect the data. With this they now collect a huge amount of data and have the hope, since we have so much data that we will find the patterns to predict machine failure or badly produced quality. Most manufacturers have already very effective and optimized production systems, which lead to cases where the collected data from half a year time frame only has a single-digit failure or bad quality rate. For the manufacturing industries this is awesome but from a predictive point of view this makes it to a rare event problem and makes it hard to find patterns.
One way would be to wait and collect more data, or we could have a look at the error log files. One benefit of error log files is that they are written by machines and have a clear specified format which usually leads to a good data quality. This error log can now be used in the link analysis. And instead of doing predictive Quality or Maintenance we are analyzing which errors or warnings often appear together or in short time intervals. With this analysis, we can now give recommendations when the machine is maintained that the technician should not only have a look at the part that causes the error but also at the parts that are most likely to cause an error or a warning shortly afterwards. Some technicians told me they do that for some machines based on their long year experience, but even they stated it is difficult when you are responsible for a lot of machines and the complexity gets higher so that they appreciate the “neutral view” of the algorithm to support them. With the information of which parts often fail together, these parts can be maintained together, thus extending the maintenance intervals leading to reduced maintenance costs. Are you interested in how this could be achieved? Let me guide you how easily such an analysis can be done.
We will use a dataset which states the production cycle ID, the error code as well as the timestamp. We don’t necessarily need to have a production cycle ID, we could also say that errors with the same timestamp, or errors that appear within one minute or within 5 minutes are of interest. This depends on the manufacturing process. In this example, we work with the ID. For the simplest case the two columns ID and Error code are enough to do this analysis.
Here I use the tool SAP predictive analysis. This tool helps not only Data Scientists but also Data Analysts and business users to efficiently create powerful predictive models.
To start the analysis, select “Social” on the left and then “Create a Social Network Analysis”.

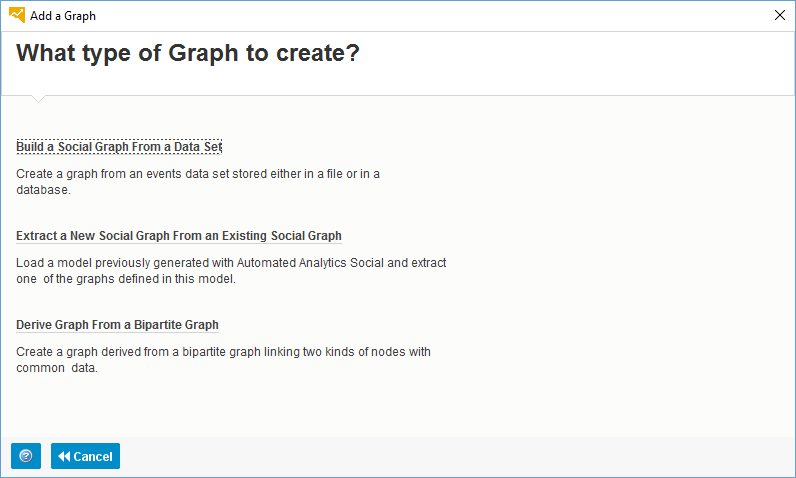
On the next screen select “Build a Social Graph from a Data Set”.

After that we load our data set Error_Log.csv and continue with “Next”. The algorithm needs to know the data and value types of the data columns. Pressing the Analyze button analyzes the data. The column “KxIndex” was added by the tool automatically. For this analysis we will not need it.

With the icon “view Data” we can have a look at the data.

With “close” we will get back to the main screen and we can press “ok” to build our first graph. The first graph we want to build should show us which error code appeared in which production cycle, which leads to the following settings:
Graph Name: ErrorLogAnalysis
Graph Creation Type: Transactions
Source Node: ProductionCycleID
Target Node: ErrorCode

In case you are not sure which graph type to use for what the tool gives you a little help with the information it gives below the Graph creation type. In these cases, it says “Use the transaction mode if your data involve links between objects of a different nature”, which exactly is what we want. We could also specify a weight to show the strength of the link, but in our case, it is not needed.
We are not done jet, since we only specified a graph that gives us the information which error code appeared in which production cycle, but we also want to analyze which error codes appear together.
To do this we select the “Add Graph” icon on the top left and choose “Derive Graph From a Bipartite Graph”. This second graph consists of errors only and shows how they are connected through their production cycles. In detail if two errors have appeared during the same production cycle they are connected.
All we need to do is to set the entity to ErrorCode.

After that just click “ok” and “next” and at the end “Generate”.
After the graph has been generated go to the next screen and have a look into “Nodes Display”.

As “Graph” select the second one to see the error codes that are connected. The thickness of the lines shows how often the errors appear together. Each connection shows a likely combination.

So, with this we created our link analysis with error log files. In production we could use the top 5 combination of errors as a suggestion for maintaining parts together to extend the intervals between the two maintenances. These results can support the quality engineer and lead to new insights.
Did that get you interested? Thank you for reading! You can find more material in the SAP Predictive Analytics Community.
As defined in the SAP Predictive Analytics Automated Analytics User Guides: “A social network is a social structure represented in the form of a graph, made of nodes and links.
The nodes are the actors/items within a network (individuals, customers, products, organizations…). The links are the relations, or social interactions, between them.
A node can have several variables associated to it (name, address, profession, age…).
In its simplest form, a social network is a map of all the relevant links between the nodes being studied.
Social networks can be used to represent many kinds of networks: informational (web, blogs), communicational (phone calls, emails), social (social networking, illness), technological (power grid, roads, internet router), financial (transactions), etc.”
This definition implies that this kind of analysis supports predictive use cases across different industries, like Insurance, Public Sector, Retail, Manufacturing, and Banking. However, the Link Analysis of Predictive Analytics is mainly used in the Retail area for market Basket Analysis. This use case doesn’t show the full potential of this powerful Analysis. At the same time industries as manufacturing want mostly to do predictive maintenance or predictive quality but don’t have the necessary data. In reality they are very motivated to equip their machines with the necessary sensors and collect the data. With this they now collect a huge amount of data and have the hope, since we have so much data that we will find the patterns to predict machine failure or badly produced quality. Most manufacturers have already very effective and optimized production systems, which lead to cases where the collected data from half a year time frame only has a single-digit failure or bad quality rate. For the manufacturing industries this is awesome but from a predictive point of view this makes it to a rare event problem and makes it hard to find patterns.
One way would be to wait and collect more data, or we could have a look at the error log files. One benefit of error log files is that they are written by machines and have a clear specified format which usually leads to a good data quality. This error log can now be used in the link analysis. And instead of doing predictive Quality or Maintenance we are analyzing which errors or warnings often appear together or in short time intervals. With this analysis, we can now give recommendations when the machine is maintained that the technician should not only have a look at the part that causes the error but also at the parts that are most likely to cause an error or a warning shortly afterwards. Some technicians told me they do that for some machines based on their long year experience, but even they stated it is difficult when you are responsible for a lot of machines and the complexity gets higher so that they appreciate the “neutral view” of the algorithm to support them. With the information of which parts often fail together, these parts can be maintained together, thus extending the maintenance intervals leading to reduced maintenance costs. Are you interested in how this could be achieved? Let me guide you how easily such an analysis can be done.
We will use a dataset which states the production cycle ID, the error code as well as the timestamp. We don’t necessarily need to have a production cycle ID, we could also say that errors with the same timestamp, or errors that appear within one minute or within 5 minutes are of interest. This depends on the manufacturing process. In this example, we work with the ID. For the simplest case the two columns ID and Error code are enough to do this analysis.
Here I use the tool SAP predictive analysis. This tool helps not only Data Scientists but also Data Analysts and business users to efficiently create powerful predictive models.
To start the analysis, select “Social” on the left and then “Create a Social Network Analysis”.
On the next screen select “Build a Social Graph from a Data Set”.
After that we load our data set Error_Log.csv and continue with “Next”. The algorithm needs to know the data and value types of the data columns. Pressing the Analyze button analyzes the data. The column “KxIndex” was added by the tool automatically. For this analysis we will not need it.
With the icon “view Data” we can have a look at the data.
With “close” we will get back to the main screen and we can press “ok” to build our first graph. The first graph we want to build should show us which error code appeared in which production cycle, which leads to the following settings:
Graph Name: ErrorLogAnalysis
Graph Creation Type: Transactions
Source Node: ProductionCycleID
Target Node: ErrorCode
In case you are not sure which graph type to use for what the tool gives you a little help with the information it gives below the Graph creation type. In these cases, it says “Use the transaction mode if your data involve links between objects of a different nature”, which exactly is what we want. We could also specify a weight to show the strength of the link, but in our case, it is not needed.
We are not done jet, since we only specified a graph that gives us the information which error code appeared in which production cycle, but we also want to analyze which error codes appear together.
To do this we select the “Add Graph” icon on the top left and choose “Derive Graph From a Bipartite Graph”. This second graph consists of errors only and shows how they are connected through their production cycles. In detail if two errors have appeared during the same production cycle they are connected.
All we need to do is to set the entity to ErrorCode.
After that just click “ok” and “next” and at the end “Generate”.
After the graph has been generated go to the next screen and have a look into “Nodes Display”.
As “Graph” select the second one to see the error codes that are connected. The thickness of the lines shows how often the errors appear together. Each connection shows a likely combination.
So, with this we created our link analysis with error log files. In production we could use the top 5 combination of errors as a suggestion for maintaining parts together to extend the intervals between the two maintenances. These results can support the quality engineer and lead to new insights.
Did that get you interested? Thank you for reading! You can find more material in the SAP Predictive Analytics Community.
- SAP Managed Tags:
- Machine Learning,
- SAP Predictive Analytics
1 Comment
You must be a registered user to add a comment. If you've already registered, sign in. Otherwise, register and sign in.
Labels in this area
-
ABAP CDS Views - CDC (Change Data Capture)
2 -
AI
1 -
Analyze Workload Data
1 -
BTP
1 -
Business and IT Integration
2 -
Business application stu
1 -
Business Technology Platform
1 -
Business Trends
1,658 -
Business Trends
107 -
CAP
1 -
cf
1 -
Cloud Foundry
1 -
Confluent
1 -
Customer COE Basics and Fundamentals
1 -
Customer COE Latest and Greatest
3 -
Customer Data Browser app
1 -
Data Analysis Tool
1 -
data migration
1 -
data transfer
1 -
Datasphere
2 -
Event Information
1,400 -
Event Information
72 -
Expert
1 -
Expert Insights
177 -
Expert Insights
340 -
General
1 -
Google cloud
1 -
Google Next'24
1 -
GraphQL
1 -
Kafka
1 -
Life at SAP
780 -
Life at SAP
14 -
Migrate your Data App
1 -
MTA
1 -
Network Performance Analysis
1 -
NodeJS
1 -
PDF
1 -
POC
1 -
Product Updates
4,575 -
Product Updates
384 -
Replication Flow
1 -
REST API
1 -
RisewithSAP
1 -
SAP BTP
1 -
SAP BTP Cloud Foundry
1 -
SAP Cloud ALM
1 -
SAP Cloud Application Programming Model
1 -
SAP Datasphere
2 -
SAP S4HANA Cloud
1 -
SAP S4HANA Migration Cockpit
1 -
Technology Updates
6,872 -
Technology Updates
472 -
Workload Fluctuations
1
Related Content
- SAP S4HANA Billing Document OData - Pricing Elements No Data in Technology Q&A
- A python flask app sends the http request failed to invoke a S4 odata v4 service in Technology Q&A
- Exploring ML Explainability in SAP HANA PAL – Classification and Regression in Technology Blogs by SAP
- SAP Integration Suite - Design Guidelines in the integration flow editor of SAP Cloud Integration in Technology Blogs by SAP
- SAP Datasphere catalog - Harvesting from SAP Datasphere, SAP BW bridge in Technology Blogs by SAP
Top kudoed authors
| User | Count |
|---|---|
| 17 | |
| 14 | |
| 12 | |
| 10 | |
| 9 | |
| 8 | |
| 7 | |
| 7 | |
| 6 | |
| 6 |