

- SAP Community
- Products and Technology
- Technology
- Technology Blogs by Members
- Streamlining Error Handling and Incident Managemen...
Technology Blogs by Members
Explore a vibrant mix of technical expertise, industry insights, and tech buzz in member blogs covering SAP products, technology, and events. Get in the mix!
Turn on suggestions
Auto-suggest helps you quickly narrow down your search results by suggesting possible matches as you type.
Showing results for
namratharaj
Discoverer
Options
- Subscribe to RSS Feed
- Mark as New
- Mark as Read
- Bookmark
- Subscribe
- Printer Friendly Page
- Report Inappropriate Content
12-01-2023
1:50 PM
Introduction
In the dynamic landscape of SAP CPI integration, it's essential to have efficient error handling and incident management to keep integrations running smoothly. We can encounter various errors, ranging from data inconsistencies to connectivity issues or simple configuration mistakes—all of which have the potential to disrupt critical business processes.
So, what's the solution? We need a robust framework that can effectively address these errors and manage incidents, allowing operations to run seamlessly. That's precisely what we'll explore today. This blog will delve into why error handling and incident management are pivotal in SAP CPI and provide a step-by-step guide on how to tackle these challenges head-on.
Architecture
The proposed solution for error handling and incident management in SAP CPI integrates with various tools and platforms to provide a unified approach.
Interface Design
The Generic Error Handling Interface is implemented to serve as a centralized hub for managing exceptions across all iFlows within the tenant. This setup allows for smooth changes, enabling easy management and simplification of any logic enhancements in future.
Step 1: Main iFlow Configuration
All iFlows within the tenant are configured to send error details and additional log properties to the Generic Error Handling iFlow through a dedicated JMS queue.
1.1 Exception subprocess of Main iFlow
When an exception occurs in the interface, the Exception subprocess is invoked. For connectivity errors, a retry mechanism is initiated to reprocess the data a specified number of times. If all retries are exhausted and the issue persists, an error log is sent to a generic flow within CPI, which then forwards it to Splunk for further analysis and monitoring.
3. JMS Adapter config

Further Reading: For JMS retry configuration, you can refer to this SAP blog.
Step 2: Generic Error Handling Process Flow to Replicate MPL logs in Splunk.
Once the error data is received from the JMS queue in the Generic flow, a series of actions are taken to effectively manage the error. These include:
Step 3: Integration with Splunk
Splunk Integration setup details can be found in this https://blogs.sap.com/2023/06/23/sap-integration-suite-external-logging-to-splunk/ blog.
Splunk Alert
Title: Name of the alert
Description: Additional details of the alert
Permissions: Options are Private and Shared in App. Private indicates that only you have permission to view and edit the alert, it is not visible to other users. Shared in App indicates that the alert is available to other users in the searching and reporting app. The alert is visible to other users in this context. Depending on their permissions, other users can edit the dashboard.
Alert Type: Scheduled
Trigger Conditions: The condition that triggered the alert.
Trigger alert when: The alert is triggered when a criteria is met and you can also add additional criteria where the number of results are greater or lesser than a particular value.
Trigger: Do you want this alert to trigger once or whenever the criteria is met.
Throttle: This feature allows us to control the frequency of alert triggering. It is useful in scenarios where alerts may trigger frequently due to similar search results or frequent scheduling. By setting throttling controls, you can suppress alert notifications for a specific time period, reducing the number of alerts you receive.
For scheduled searches that run frequently, you can set longer throttling periods to avoid being notified for every result generated. In the case of real-time searches, if the alert triggers for each result, configuring throttling can help suppress additional alerts and prevent your inbox from being overwhelmed with notification emails. The default throttling period is 60 seconds, but you have the flexibility to adjust it according to your needs.
Trigger Actions: In this section, we have the option to customize the e-mail subject and body for the alert. We can use tokens to add specific information to the alert. For example, the $type$ token will be replaced with the name of the search when the alert is sent.
We also have the option to include information from the trigger search results by using the $result.count$ token. This allows you to dynamically incorporate the count of the error log into the alert.
Once you save the alert you will be presented with the popup where you can make changes to the permissions.
Email Alert from Splunk
Step 4: Splunk Webhook to CPI
Step 5: Integration with Azure Event Hub
AMQP adapter is used to integrate with Azure Event Hub.
We have Integrated with the event hub to leverage the deduplication process, which helps ensure data accuracy and efficiency. By using the event hub, Logic Apps and ELK can efficiently transfer messages through the pipeline, with alerts being sent to the ELK stack. The ELK stack then utilizes the message content to create Incidents in ServiceNow.
Deduplication is valuable when multiple alerts for the same issue could lead to duplicate Incidents, causing confusion and wasting resources. With deduplication, only one Incident is created, optimizing resource allocation and simplifying incident resolution, ultimately enhancing workflow efficiency.
Step 6: Incident Creation in ServiceNow.
In the dynamic landscape of SAP CPI integration, it's essential to have efficient error handling and incident management to keep integrations running smoothly. We can encounter various errors, ranging from data inconsistencies to connectivity issues or simple configuration mistakes—all of which have the potential to disrupt critical business processes.
So, what's the solution? We need a robust framework that can effectively address these errors and manage incidents, allowing operations to run seamlessly. That's precisely what we'll explore today. This blog will delve into why error handling and incident management are pivotal in SAP CPI and provide a step-by-step guide on how to tackle these challenges head-on.
Architecture
The proposed solution for error handling and incident management in SAP CPI integrates with various tools and platforms to provide a unified approach.

The key components of our design include:
- Centralized Logging and Monitoring: SAP CPI is integrated with Splunk to provide centralized logging and monitoring of errors encountered during interface execution. Splunk's powerful search capabilities facilitate quick identification and troubleshooting of errors. Furthermore, Splunk's indexing, and correlation features create a structured container for error data, streamlining the error detection and management process.
- Alert Notification: Splunk alerts are configured to run regularly and notify business users via email when errors occur. This ensures that stakeholders are promptly aware of errors, allowing for quick resolution.
- Automated Incident Creation: The solution leverages the integration of SAP APIM and Azure Event Hub to facilitate deduplication of error logs. Error logs are transmitted from SAP CPI to Azure Event Hub, which utilizes the Radar application for deduplication. Subsequently, the integration with ServiceNow enables the automatic creation of incidents for each unique error, ensuring efficient incident management and resolution.
- Scalability and Customization: The proposed solution is built to scale easily, thanks to Splunk's ability to handle growing amounts of data. It also lets you customize alert timings and send notifications to specific business groups. By routing incidents to the support teams responsible for each integration, the framework makes it easier to resolve issues quickly and holds everyone accountable.
Interface Design
The Generic Error Handling Interface is implemented to serve as a centralized hub for managing exceptions across all iFlows within the tenant. This setup allows for smooth changes, enabling easy management and simplification of any logic enhancements in future.
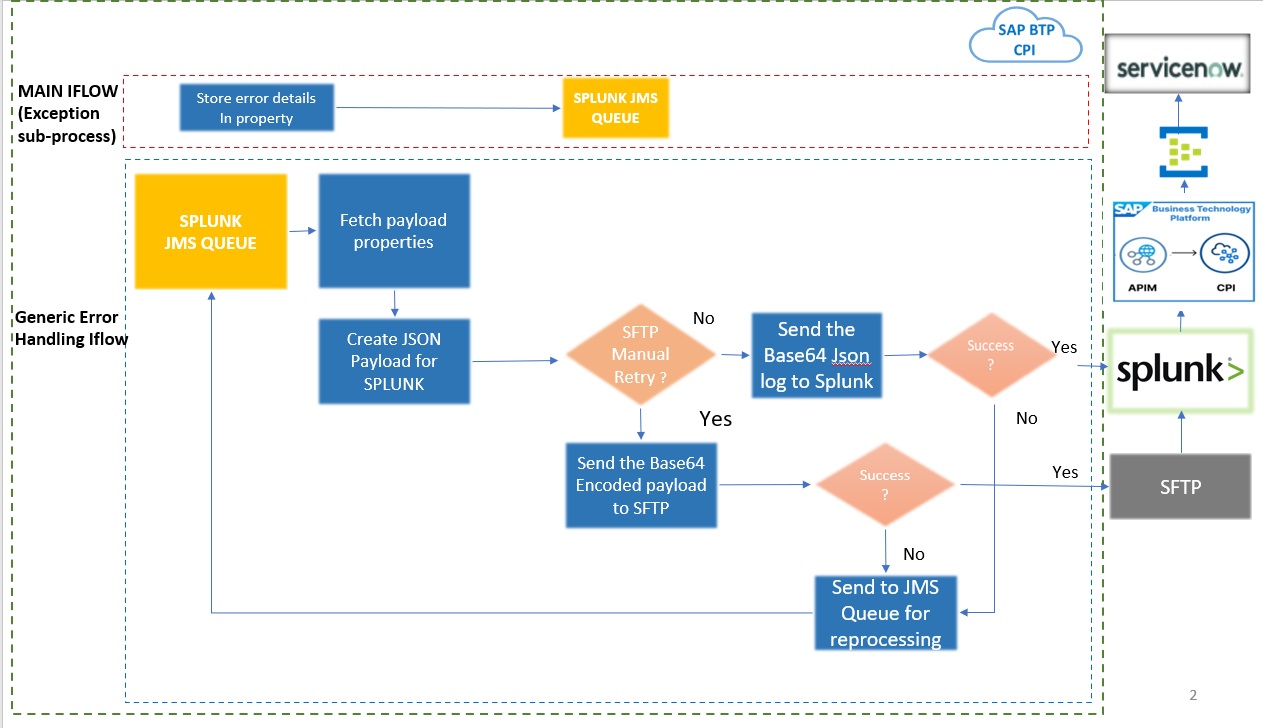
Step 1: Main iFlow Configuration
All iFlows within the tenant are configured to send error details and additional log properties to the Generic Error Handling iFlow through a dedicated JMS queue.
1.1 Exception subprocess of Main iFlow
When an exception occurs in the interface, the Exception subprocess is invoked. For connectivity errors, a retry mechanism is initiated to reprocess the data a specified number of times. If all retries are exhausted and the issue persists, an error log is sent to a generic flow within CPI, which then forwards it to Splunk for further analysis and monitoring.

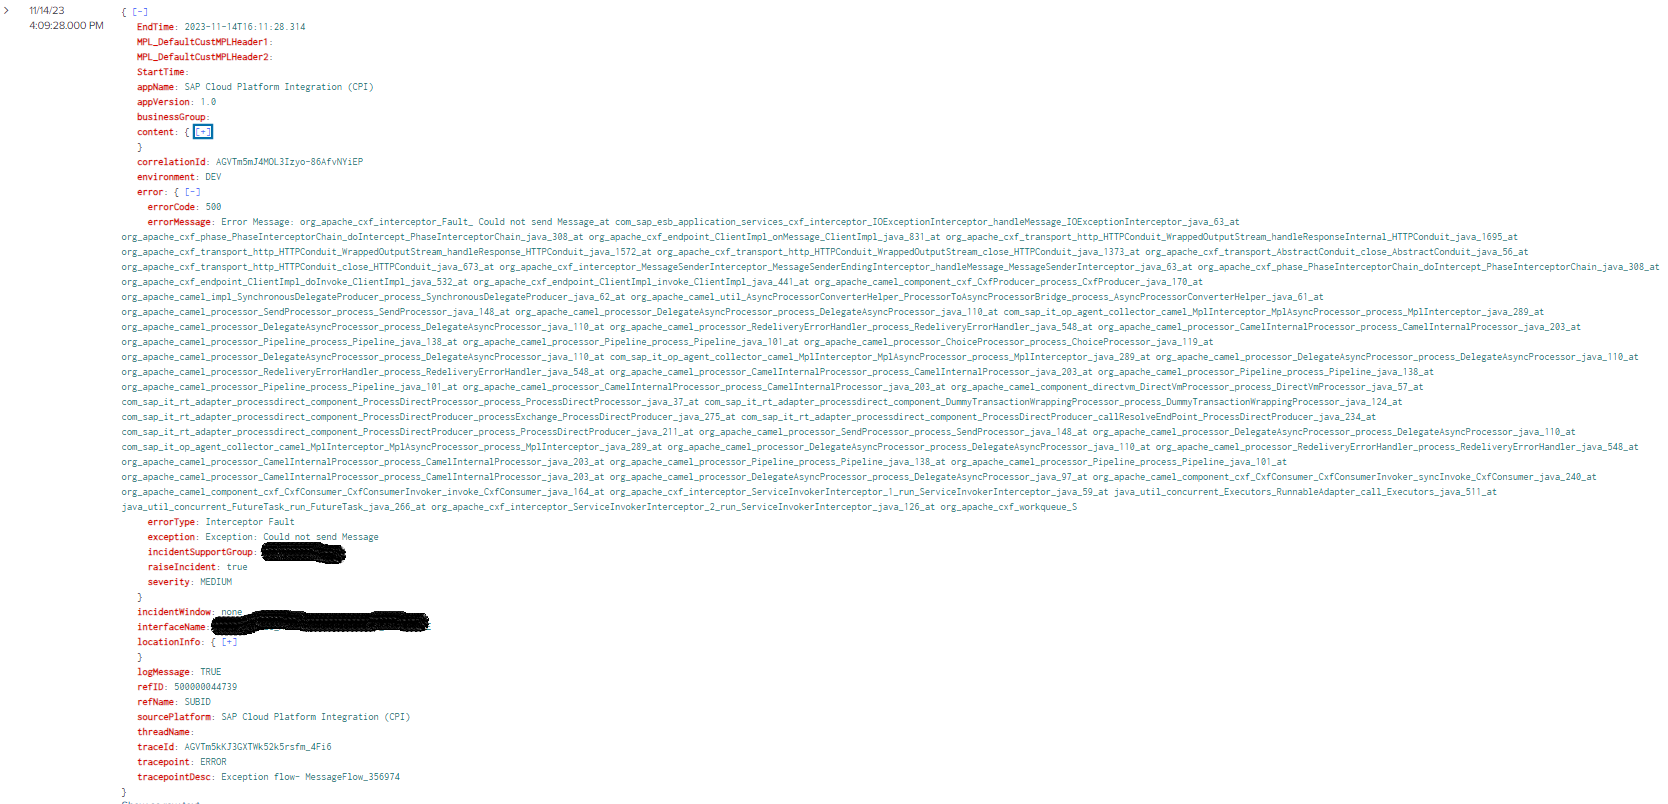
- Store Exception properties

- Camel Exception in the exception subprocess of main iFlow is used to read error code in receiver adapter and set these in Splunk properties.
3. JMS Adapter config
Note: Retry via JMS is applicable only for asynchronous flows. For all other cases, error logs are sent directly to the generic flow without retrying.
Further Reading: For JMS retry configuration, you can refer to this SAP blog.
Step 2: Generic Error Handling Process Flow to Replicate MPL logs in Splunk.
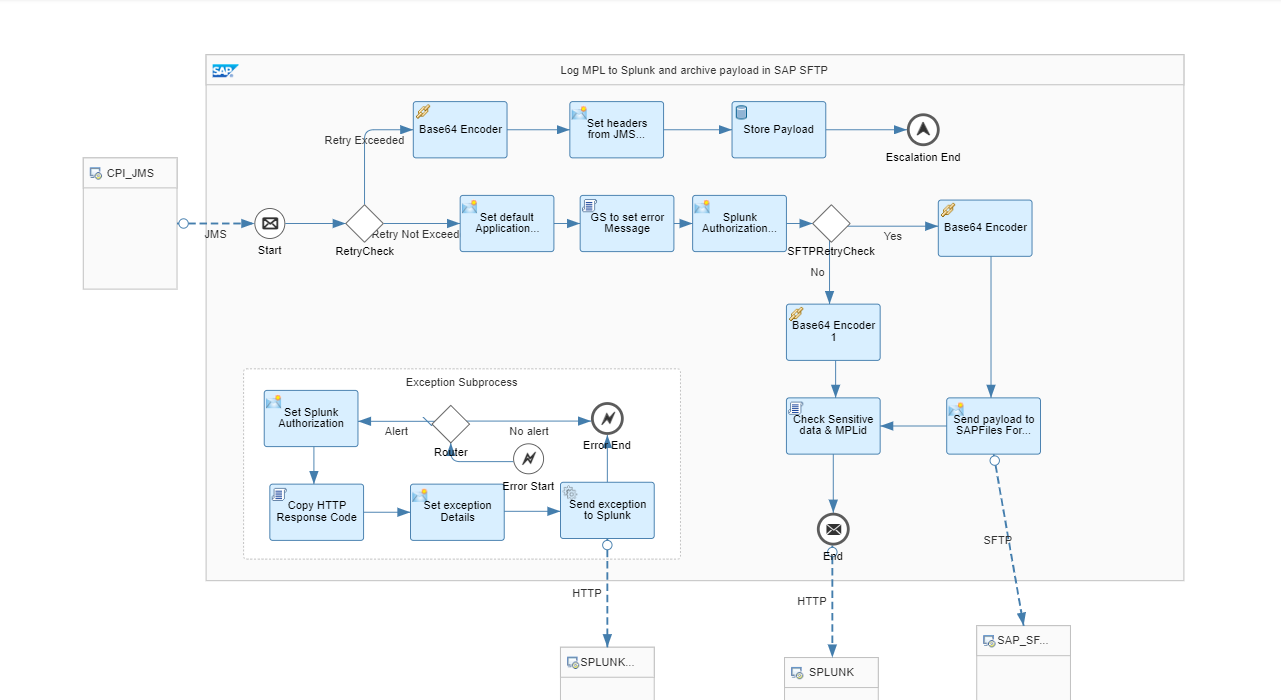
Once the error data is received from the JMS queue in the Generic flow, a series of actions are taken to effectively manage the error. These include:
- Retry Check: A router condition checks for potential retries in case the Error Handling iFlow fails due to exceptions such as Splunk being unavailable. If the retry limit is reached, the data is stored in a data store using the WRITE operation.( A separate iFlow can then be used to read the logs from the data store and send them to Splunk when it becomes available.)
- Error Message Character Limit: A Groovy script checks the length of the error message. Given that Splunk has a character limit of 5000, messages exceeding this limit are trimmed.
- SFTP ManualRetry Check: This step assesses if the data should be stored in SFTP for possible manual retry, particularly when the source system lacks the capability to resend failed messages. In cases where SFTP is needed, the payload is archived in SAP SFTP, and logs are sent to Splunk in parallel. If SFTP isn't required, logs go directly to Splunk.This decision is based on the property "SFTPRequiredForManualRetry," which is sent from the main iFlow.
Step 3: Integration with Splunk
Splunk Integration setup details can be found in this https://blogs.sap.com/2023/06/23/sap-integration-suite-external-logging-to-splunk/ blog.
Splunk Alert
- Navigate to Splunk and in the Search page, enter the search query for which you have to generate alert.

- To create an alert select Save As and then click Alert as shown below.

- You will be presented with the following screen where you can enter additional details:

Title: Name of the alert
Description: Additional details of the alert
Permissions: Options are Private and Shared in App. Private indicates that only you have permission to view and edit the alert, it is not visible to other users. Shared in App indicates that the alert is available to other users in the searching and reporting app. The alert is visible to other users in this context. Depending on their permissions, other users can edit the dashboard.
Alert Type: Scheduled
Trigger Conditions: The condition that triggered the alert.
Trigger alert when: The alert is triggered when a criteria is met and you can also add additional criteria where the number of results are greater or lesser than a particular value.
Trigger: Do you want this alert to trigger once or whenever the criteria is met.
Throttle: This feature allows us to control the frequency of alert triggering. It is useful in scenarios where alerts may trigger frequently due to similar search results or frequent scheduling. By setting throttling controls, you can suppress alert notifications for a specific time period, reducing the number of alerts you receive.
For scheduled searches that run frequently, you can set longer throttling periods to avoid being notified for every result generated. In the case of real-time searches, if the alert triggers for each result, configuring throttling can help suppress additional alerts and prevent your inbox from being overwhelmed with notification emails. The default throttling period is 60 seconds, but you have the flexibility to adjust it according to your needs.
Trigger Actions: In this section, we have the option to customize the e-mail subject and body for the alert. We can use tokens to add specific information to the alert. For example, the $type$ token will be replaced with the name of the search when the alert is sent.
We also have the option to include information from the trigger search results by using the $result.count$ token. This allows you to dynamically incorporate the count of the error log into the alert.

Once you save the alert you will be presented with the popup where you can make changes to the permissions.
Email Alert from Splunk

Step 4: Splunk Webhook to CPI
- From the Search page in the Search and Reporting app, select Save As > Alert. Enter alert details and configure triggering and throttling as needed.
In the Add Actions menu, select Webhook.
Type a URL for the webhook. The target URL must be on the webhook allow list. For more information, see Configure webhook allow list.
Click Save.
Step 5: Integration with Azure Event Hub
AMQP adapter is used to integrate with Azure Event Hub.

We have Integrated with the event hub to leverage the deduplication process, which helps ensure data accuracy and efficiency. By using the event hub, Logic Apps and ELK can efficiently transfer messages through the pipeline, with alerts being sent to the ELK stack. The ELK stack then utilizes the message content to create Incidents in ServiceNow.
Deduplication is valuable when multiple alerts for the same issue could lead to duplicate Incidents, causing confusion and wasting resources. With deduplication, only one Incident is created, optimizing resource allocation and simplifying incident resolution, ultimately enhancing workflow efficiency.
Step 6: Incident Creation in ServiceNow.
- SAP Managed Tags:
- SAP Business Technology Platform
You must be a registered user to add a comment. If you've already registered, sign in. Otherwise, register and sign in.
Labels in this area
-
"automatische backups"
1 -
"regelmäßige sicherung"
1 -
"TypeScript" "Development" "FeedBack"
1 -
505 Technology Updates 53
1 -
ABAP
14 -
ABAP API
1 -
ABAP CDS Views
2 -
ABAP CDS Views - BW Extraction
1 -
ABAP CDS Views - CDC (Change Data Capture)
1 -
ABAP class
2 -
ABAP Cloud
3 -
ABAP Development
5 -
ABAP in Eclipse
1 -
ABAP Platform Trial
1 -
ABAP Programming
2 -
abap technical
1 -
abapGit
1 -
absl
2 -
access data from SAP Datasphere directly from Snowflake
1 -
Access data from SAP datasphere to Qliksense
1 -
Accrual
1 -
action
1 -
adapter modules
1 -
Addon
1 -
Adobe Document Services
1 -
ADS
1 -
ADS Config
1 -
ADS with ABAP
1 -
ADS with Java
1 -
ADT
2 -
Advance Shipping and Receiving
1 -
Advanced Event Mesh
3 -
AEM
1 -
AI
7 -
AI Launchpad
1 -
AI Projects
1 -
AIML
9 -
Alert in Sap analytical cloud
1 -
Amazon S3
1 -
Analytical Dataset
1 -
Analytical Model
1 -
Analytics
1 -
Analyze Workload Data
1 -
annotations
1 -
API
1 -
API and Integration
3 -
API Call
2 -
API security
1 -
Application Architecture
1 -
Application Development
5 -
Application Development for SAP HANA Cloud
3 -
Applications and Business Processes (AP)
1 -
Artificial Intelligence
1 -
Artificial Intelligence (AI)
5 -
Artificial Intelligence (AI) 1 Business Trends 363 Business Trends 8 Digital Transformation with Cloud ERP (DT) 1 Event Information 462 Event Information 15 Expert Insights 114 Expert Insights 76 Life at SAP 418 Life at SAP 1 Product Updates 4
1 -
Artificial Intelligence (AI) blockchain Data & Analytics
1 -
Artificial Intelligence (AI) blockchain Data & Analytics Intelligent Enterprise
1 -
Artificial Intelligence (AI) blockchain Data & Analytics Intelligent Enterprise Oil Gas IoT Exploration Production
1 -
Artificial Intelligence (AI) blockchain Data & Analytics Intelligent Enterprise sustainability responsibility esg social compliance cybersecurity risk
1 -
ASE
1 -
ASR
2 -
ASUG
1 -
Attachments
1 -
Authorisations
1 -
Automating Processes
1 -
Automation
2 -
aws
2 -
Azure
1 -
Azure AI Studio
1 -
Azure API Center
1 -
Azure API Management
1 -
B2B Integration
1 -
Backorder Processing
1 -
Backup
1 -
Backup and Recovery
1 -
Backup schedule
1 -
BADI_MATERIAL_CHECK error message
1 -
Bank
1 -
BAS
1 -
basis
2 -
Basis Monitoring & Tcodes with Key notes
2 -
Batch Management
1 -
BDC
1 -
Best Practice
1 -
bitcoin
1 -
Blockchain
3 -
bodl
1 -
BOP in aATP
1 -
BOP Segments
1 -
BOP Strategies
1 -
BOP Variant
1 -
BPC
1 -
BPC LIVE
1 -
BTP
13 -
BTP Destination
2 -
Business AI
1 -
Business and IT Integration
1 -
Business application stu
1 -
Business Application Studio
1 -
Business Architecture
1 -
Business Communication Services
1 -
Business Continuity
1 -
Business Data Fabric
3 -
Business Fabric
1 -
Business Partner
12 -
Business Partner Master Data
10 -
Business Technology Platform
2 -
Business Trends
4 -
BW4HANA
1 -
CA
1 -
calculation view
1 -
CAP
4 -
Capgemini
1 -
CAPM
1 -
Catalyst for Efficiency: Revolutionizing SAP Integration Suite with Artificial Intelligence (AI) and
1 -
CCMS
2 -
CDQ
12 -
CDS
2 -
Cental Finance
1 -
Certificates
1 -
CFL
1 -
Change Management
1 -
chatbot
1 -
chatgpt
3 -
CL_SALV_TABLE
2 -
Class Runner
1 -
Classrunner
1 -
Cloud ALM Monitoring
1 -
Cloud ALM Operations
1 -
cloud connector
1 -
Cloud Extensibility
1 -
Cloud Foundry
4 -
Cloud Integration
6 -
Cloud Platform Integration
2 -
cloudalm
1 -
communication
1 -
Compensation Information Management
1 -
Compensation Management
1 -
Compliance
1 -
Compound Employee API
1 -
Configuration
1 -
Connectors
1 -
Consolidation Extension for SAP Analytics Cloud
2 -
Control Indicators.
1 -
Controller-Service-Repository pattern
1 -
Conversion
1 -
Cosine similarity
1 -
cryptocurrency
1 -
CSI
1 -
ctms
1 -
Custom chatbot
3 -
Custom Destination Service
1 -
custom fields
1 -
Customer Experience
1 -
Customer Journey
1 -
Customizing
1 -
cyber security
3 -
cybersecurity
1 -
Data
1 -
Data & Analytics
1 -
Data Aging
1 -
Data Analytics
2 -
Data and Analytics (DA)
1 -
Data Archiving
1 -
Data Back-up
1 -
Data Flow
1 -
Data Governance
5 -
Data Integration
2 -
Data Quality
12 -
Data Quality Management
12 -
Data Synchronization
1 -
data transfer
1 -
Data Unleashed
1 -
Data Value
8 -
database tables
1 -
Datasphere
3 -
datenbanksicherung
1 -
dba cockpit
1 -
dbacockpit
1 -
Debugging
2 -
Defender
1 -
Delimiting Pay Components
1 -
Delta Integrations
1 -
Destination
3 -
Destination Service
1 -
Developer extensibility
1 -
Developing with SAP Integration Suite
1 -
Devops
1 -
digital transformation
1 -
Documentation
1 -
Dot Product
1 -
DQM
1 -
dump database
1 -
dump transaction
1 -
e-Invoice
1 -
E4H Conversion
1 -
Eclipse ADT ABAP Development Tools
2 -
edoc
1 -
edocument
1 -
ELA
1 -
Embedded Consolidation
1 -
Embedding
1 -
Embeddings
1 -
Employee Central
1 -
Employee Central Payroll
1 -
Employee Central Time Off
1 -
Employee Information
1 -
Employee Rehires
1 -
Enable Now
1 -
Enable now manager
1 -
endpoint
1 -
Enhancement Request
1 -
Enterprise Architecture
1 -
ESLint
1 -
ETL Business Analytics with SAP Signavio
1 -
Euclidean distance
1 -
Event Dates
1 -
Event Driven Architecture
1 -
Event Mesh
2 -
Event Reason
1 -
EventBasedIntegration
1 -
EWM
1 -
EWM Outbound configuration
1 -
EWM-TM-Integration
1 -
Existing Event Changes
1 -
Expand
1 -
Expert
2 -
Expert Insights
2 -
Exploits
1 -
Fiori
14 -
Fiori Elements
2 -
Fiori SAPUI5
12 -
first-guidance
1 -
Flask
1 -
FTC
1 -
Full Stack
8 -
Funds Management
1 -
gCTS
1 -
General
1 -
Generative AI
1 -
Getting Started
1 -
GitHub
9 -
Grants Management
1 -
groovy
1 -
GTP
1 -
HANA
6 -
HANA Cloud
2 -
Hana Cloud Database Integration
2 -
HANA DB
2 -
HANA XS Advanced
1 -
Historical Events
1 -
home labs
1 -
HowTo
1 -
HR Data Management
1 -
html5
8 -
HTML5 Application
1 -
Identity cards validation
1 -
idm
1 -
Implementation
1 -
input parameter
1 -
instant payments
1 -
Integration
3 -
Integration Advisor
1 -
Integration Architecture
1 -
Integration Center
1 -
Integration Suite
1 -
intelligent enterprise
1 -
iot
1 -
Java
1 -
job
1 -
Job Information Changes
1 -
Job-Related Events
1 -
Job_Event_Information
1 -
joule
4 -
Journal Entries
1 -
Just Ask
1 -
Kerberos for ABAP
8 -
Kerberos for JAVA
8 -
KNN
1 -
Launch Wizard
1 -
Learning Content
2 -
Life at SAP
5 -
lightning
1 -
Linear Regression SAP HANA Cloud
1 -
Loading Indicator
1 -
local tax regulations
1 -
LP
1 -
Machine Learning
2 -
Marketing
1 -
Master Data
3 -
Master Data Management
14 -
Maxdb
2 -
MDG
1 -
MDGM
1 -
MDM
1 -
Message box.
1 -
Messages on RF Device
1 -
Microservices Architecture
1 -
Microsoft Universal Print
1 -
Middleware Solutions
1 -
Migration
5 -
ML Model Development
1 -
Modeling in SAP HANA Cloud
8 -
Monitoring
3 -
MTA
1 -
Multi-Record Scenarios
1 -
Multiple Event Triggers
1 -
Myself Transformation
1 -
Neo
1 -
New Event Creation
1 -
New Feature
1 -
Newcomer
1 -
NodeJS
3 -
ODATA
2 -
OData APIs
1 -
odatav2
1 -
ODATAV4
1 -
ODBC
1 -
ODBC Connection
1 -
Onpremise
1 -
open source
2 -
OpenAI API
1 -
Oracle
1 -
PaPM
1 -
PaPM Dynamic Data Copy through Writer function
1 -
PaPM Remote Call
1 -
PAS-C01
1 -
Pay Component Management
1 -
PGP
1 -
Pickle
1 -
PLANNING ARCHITECTURE
1 -
Popup in Sap analytical cloud
1 -
PostgrSQL
1 -
POSTMAN
1 -
Prettier
1 -
Process Automation
2 -
Product Updates
5 -
PSM
1 -
Public Cloud
1 -
Python
4 -
python library - Document information extraction service
1 -
Qlik
1 -
Qualtrics
1 -
RAP
3 -
RAP BO
2 -
Record Deletion
1 -
Recovery
1 -
recurring payments
1 -
redeply
1 -
Release
1 -
Remote Consumption Model
1 -
Replication Flows
1 -
research
1 -
Resilience
1 -
REST
1 -
REST API
1 -
Retagging Required
1 -
Risk
1 -
Rolling Kernel Switch
1 -
route
1 -
rules
1 -
S4 HANA
1 -
S4 HANA Cloud
1 -
S4 HANA On-Premise
1 -
S4HANA
3 -
S4HANA_OP_2023
2 -
SAC
10 -
SAC PLANNING
9 -
SAP
4 -
SAP ABAP
1 -
SAP Advanced Event Mesh
1 -
SAP AI Core
8 -
SAP AI Launchpad
8 -
SAP Analytic Cloud Compass
1 -
Sap Analytical Cloud
1 -
SAP Analytics Cloud
4 -
SAP Analytics Cloud for Consolidation
3 -
SAP Analytics Cloud Story
1 -
SAP analytics clouds
1 -
SAP API Management
1 -
SAP BAS
1 -
SAP Basis
6 -
SAP BODS
1 -
SAP BODS certification.
1 -
SAP BTP
21 -
SAP BTP Build Work Zone
2 -
SAP BTP Cloud Foundry
6 -
SAP BTP Costing
1 -
SAP BTP CTMS
1 -
SAP BTP Innovation
1 -
SAP BTP Migration Tool
1 -
SAP BTP SDK IOS
1 -
SAP BTPEA
1 -
SAP Build
11 -
SAP Build App
1 -
SAP Build apps
1 -
SAP Build CodeJam
1 -
SAP Build Process Automation
3 -
SAP Build work zone
10 -
SAP Business Objects Platform
1 -
SAP Business Technology
2 -
SAP Business Technology Platform (XP)
1 -
sap bw
1 -
SAP CAP
2 -
SAP CDC
1 -
SAP CDP
1 -
SAP CDS VIEW
1 -
SAP Certification
1 -
SAP Cloud ALM
4 -
SAP Cloud Application Programming Model
1 -
SAP Cloud Integration for Data Services
1 -
SAP cloud platform
8 -
SAP Companion
1 -
SAP CPI
3 -
SAP CPI (Cloud Platform Integration)
2 -
SAP CPI Discover tab
1 -
sap credential store
1 -
SAP Customer Data Cloud
1 -
SAP Customer Data Platform
1 -
SAP Data Intelligence
1 -
SAP Data Migration in Retail Industry
1 -
SAP Data Services
1 -
SAP DATABASE
1 -
SAP Dataspher to Non SAP BI tools
1 -
SAP Datasphere
9 -
SAP DRC
1 -
SAP EWM
1 -
SAP Fiori
3 -
SAP Fiori App Embedding
1 -
Sap Fiori Extension Project Using BAS
1 -
SAP GRC
1 -
SAP HANA
1 -
SAP HCM (Human Capital Management)
1 -
SAP HR Solutions
1 -
SAP IDM
1 -
SAP Integration Suite
9 -
SAP Integrations
4 -
SAP iRPA
2 -
SAP LAGGING AND SLOW
1 -
SAP Learning Class
1 -
SAP Learning Hub
1 -
SAP Master Data
1 -
SAP Odata
2 -
SAP on Azure
2 -
SAP PartnerEdge
1 -
sap partners
1 -
SAP Password Reset
1 -
SAP PO Migration
1 -
SAP Prepackaged Content
1 -
SAP Process Automation
2 -
SAP Process Integration
2 -
SAP Process Orchestration
1 -
SAP S4HANA
2 -
SAP S4HANA Cloud
1 -
SAP S4HANA Cloud for Finance
1 -
SAP S4HANA Cloud private edition
1 -
SAP Sandbox
1 -
SAP STMS
1 -
SAP successfactors
3 -
SAP SuccessFactors HXM Core
1 -
SAP Time
1 -
SAP TM
2 -
SAP Trading Partner Management
1 -
SAP UI5
1 -
SAP Upgrade
1 -
SAP Utilities
1 -
SAP-GUI
8 -
SAP_COM_0276
1 -
SAPBTP
1 -
SAPCPI
1 -
SAPEWM
1 -
sapfirstguidance
1 -
SAPHANAService
1 -
SAPIQ
1 -
sapmentors
1 -
saponaws
2 -
SAPS4HANA
1 -
SAPUI5
5 -
schedule
1 -
Script Operator
1 -
Secure Login Client Setup
8 -
security
9 -
Selenium Testing
1 -
Self Transformation
1 -
Self-Transformation
1 -
SEN
1 -
SEN Manager
1 -
service
1 -
SET_CELL_TYPE
1 -
SET_CELL_TYPE_COLUMN
1 -
SFTP scenario
2 -
Simplex
1 -
Single Sign On
8 -
Singlesource
1 -
SKLearn
1 -
Slow loading
1 -
soap
1 -
Software Development
1 -
SOLMAN
1 -
solman 7.2
2 -
Solution Manager
3 -
sp_dumpdb
1 -
sp_dumptrans
1 -
SQL
1 -
sql script
1 -
SSL
8 -
SSO
8 -
Substring function
1 -
SuccessFactors
1 -
SuccessFactors Platform
1 -
SuccessFactors Time Tracking
1 -
Sybase
1 -
system copy method
1 -
System owner
1 -
Table splitting
1 -
Tax Integration
1 -
Technical article
1 -
Technical articles
1 -
Technology Updates
15 -
Technology Updates
1 -
Technology_Updates
1 -
terraform
1 -
Threats
2 -
Time Collectors
1 -
Time Off
2 -
Time Sheet
1 -
Time Sheet SAP SuccessFactors Time Tracking
1 -
Tips and tricks
2 -
toggle button
1 -
Tools
1 -
Trainings & Certifications
1 -
Transformation Flow
1 -
Transport in SAP BODS
1 -
Transport Management
1 -
TypeScript
3 -
ui designer
1 -
unbind
1 -
Unified Customer Profile
1 -
UPB
1 -
Use of Parameters for Data Copy in PaPM
1 -
User Unlock
1 -
VA02
1 -
Validations
1 -
Vector Database
2 -
Vector Engine
1 -
Visual Studio Code
1 -
VSCode
2 -
VSCode extenions
1 -
Vulnerabilities
1 -
Web SDK
1 -
work zone
1 -
workload
1 -
xsa
1 -
XSA Refresh
1
- « Previous
- Next »
Related Content
- Sapphire 2024 user experience and application development sessions in Technology Blogs by SAP
- SAP BW/4 - revamp and true to the line 2024 in Technology Blogs by Members
- PM Notification Configuration from DMC to ERP in Technology Blogs by Members
- Govern SAP APIs living in various API Management gateways in a single place with Azure API Center in Technology Blogs by Members
- Enhance your SAP Datasphere Experience with API Access in Technology Blogs by SAP
Top kudoed authors
| User | Count |
|---|---|
| 9 | |
| 8 | |
| 5 | |
| 5 | |
| 4 | |
| 4 | |
| 4 | |
| 3 | |
| 3 | |
| 3 |