
- SAP Community
- Products and Technology
- Technology
- Technology Blogs by Members
- Advanced Dashboards using Design Studio Extensions...
Technology Blogs by Members
Explore a vibrant mix of technical expertise, industry insights, and tech buzz in member blogs covering SAP products, technology, and events. Get in the mix!
Turn on suggestions
Auto-suggest helps you quickly narrow down your search results by suggesting possible matches as you type.
Showing results for
TammyPowlas
Active Contributor
Options
- Subscribe to RSS Feed
- Mark as New
- Mark as Read
- Bookmark
- Subscribe
- Printer Friendly Page
- Report Inappropriate Content
06-03-2015
1:03 AM
This was a webcast today given by ihilgefort on Visual BI's Design Studio extensions. These are my notes as I heard them.

Figure 1: Source: Visual BI
Figure 1 shows that things in the future are subject to change

Figure 2: Source: Visual BI
Figure 2 shows a mapping of Visual BI add-ons, showing latest Design Studio version provides mapping, basic functionality
Regional maps, US/states, Germany/District, street level details
It is not limited to marker layers
It includes a menu structure, search box, helping the developer add standard functionality without coding
Here is the link to a thirty day trial for the Visual BI extensions

Figure 3: Source: SAP
Figure 3 is the roadmap for the extensions. What is coming in the future includes trend lines, full hierarchy support (expand/collapse), assign colors to members of dashboard, includes GeoJSON / TopJSON map
Utilities include export to PPT and to Outlook
It includes responsive container for mobile
It supports Design Studio Release 1.3, 1.4, 1.5

Figure 4: Source: SAP
Figure 4 shows that it includes multi-axis charts, combine data with maps without having to create files to build maps
It speeds up process of building dashboards, using an Excel spreadsheet as a data source

Figure 5: Source: Visual BI
Adding more than 40 charts to Design Studio – influence them in design time and run time using scripts
Standard features include print, export, drill down
Reuse same chart for multiple charts

Figure 6: Source: Visual BI
The maps go down to street level
The maps go down to the next level - can navigate from a map to Web intelligence / Crystal for a closed loop scenario
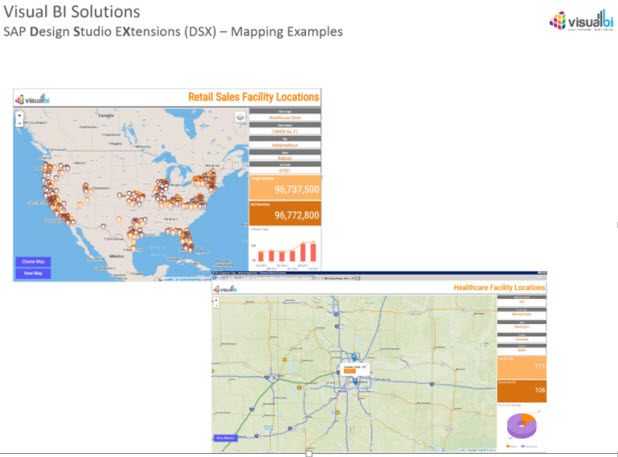
Figure 7: Source: Visual BI
Figure 7 shows the marker layer for maps, drill down, scripting behind it

Figure 8: Source: Visual BI
Figure 8 shows some of the current Design Studio Utilities one of which is Search - which I tried here Sharing my SAP Design Studio Search Utility Extension Experience
RELEASE 2 DSX

Figure 9: Source: Visual BI
Figure 9 covers the new chart types and at the bottom it includes new features for the chart types

Figure 10: Source: Visual BI
Conditional formatting
- Can be based on measure or members of dimension
- Bar chart showing the profit and highlight profit based on revenue
- Color-code members –
Scaling features shown in Figure 10 can be used to prevent confusion with numbers

Figure 11: Source: Visual BI
Figure 11 shows color-coding of charts where you can “paint the chart” instead of you having to code that – deliver style sheet code need
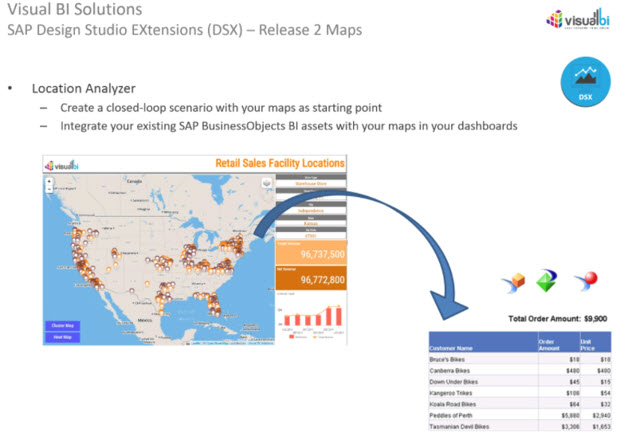
Figure 12: Source: Visual BI
Maps are a part of your overall landscape
Map to navigate to your existing assets such as Crystal or Web Intelligence
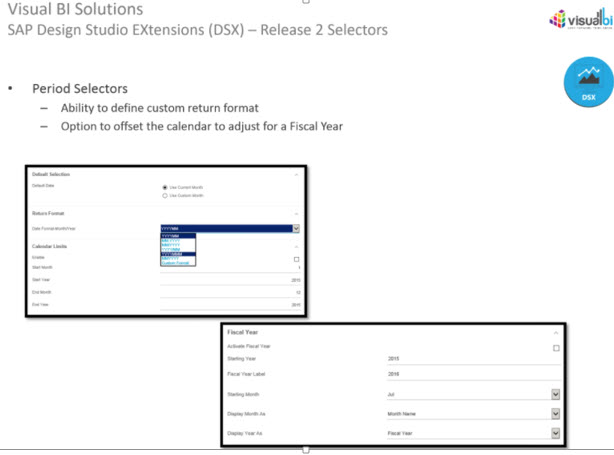
Figure 13: Source: Visual BI
Figure 13 covers updates to period selectors, including how to send data to backend
You can freely define it instead of coding it; it also adjusts for fiscal year

Figure 14: Source: Visual BI
Figure 14 shows a custom table, with column independent sorting

Figure 15: Source: Visual BI
Figure 15 is a new KPI tile with title, sub title, integrate icons, values, and sparkline charts in tile

Figure 16: Source: Visual BI
For quick prototyping you can use Excel or Google spreadsheets as a data source

Figure 17: Source: Visual BI
With the export to PDF you can influence the orientation, header and footer text
You can add comments before you export
You can select which components become part of the PDF; for example you may want to remove buttons from PDF to only get chart and table

Figure 18: Source: Visual BI
Figure 18 shows a true hierarchical filter

Figure 19: Source: Visual BI
Figure 19 shows the What if scenario, similar to XCelsius
If costs go down 5% how will it influence profit? See Is a What if Scenario in Design Studio possible ? for more details
Please note this webcast was sponsored by Visual BI and these are my notes as I heard them. Unfortunately I had to leave the webinar early so I didn't document the question & answer.
Join ASUG for these upcoming webcasts:
- June 4: SAP BI Suite Roadmap
- June 8: Best Practices for Data Visualization and Dashboard Design with SAP BusinessObjects Design Studio
- June 10: Moving from BEx Tools to Analysis and Design Studio: Question & Answer Session
- June 22: Enabling Your Salesforce through On-Time Analytics with SAP BusinessObjects Design Studio
- Aug. 10: Tetra Pak's BI Reporting Strategy Using Applications Created by SAP BusinessObjects Design Studio
- SAP Managed Tags:
- SAP BusinessObjects Design Studio
2 Comments
You must be a registered user to add a comment. If you've already registered, sign in. Otherwise, register and sign in.
Labels in this area
-
"automatische backups"
1 -
"regelmäßige sicherung"
1 -
"TypeScript" "Development" "FeedBack"
1 -
505 Technology Updates 53
1 -
ABAP
19 -
ABAP API
1 -
ABAP CDS Views
4 -
ABAP CDS Views - BW Extraction
1 -
ABAP CDS Views - CDC (Change Data Capture)
1 -
ABAP class
2 -
ABAP Cloud
3 -
ABAP DDIC CDS view
1 -
ABAP Development
5 -
ABAP in Eclipse
3 -
ABAP Platform Trial
1 -
ABAP Programming
2 -
abap technical
1 -
abapGit
1 -
absl
2 -
access data from SAP Datasphere directly from Snowflake
1 -
Access data from SAP datasphere to Qliksense
1 -
Accrual
1 -
action
1 -
adapter modules
1 -
Addon
1 -
Adobe Document Services
1 -
ADS
1 -
ADS Config
1 -
ADS with ABAP
1 -
ADS with Java
1 -
ADT
2 -
Advance Shipping and Receiving
1 -
Advanced Event Mesh
3 -
Advanced formula
1 -
AEM
1 -
AI
8 -
AI Launchpad
1 -
AI Projects
1 -
AIML
10 -
Alert in Sap analytical cloud
1 -
Amazon S3
1 -
Analytic Models
1 -
Analytical Dataset
1 -
Analytical Model
1 -
Analytics
1 -
Analyze Workload Data
1 -
annotations
1 -
API
1 -
API and Integration
4 -
API Call
2 -
API security
1 -
Application Architecture
1 -
Application Development
5 -
Application Development for SAP HANA Cloud
3 -
Applications and Business Processes (AP)
1 -
Architecture
1 -
Artificial Intelligence
1 -
Artificial Intelligence (AI)
6 -
Artificial Intelligence (AI) 1 Business Trends 363 Business Trends 8 Digital Transformation with Cloud ERP (DT) 1 Event Information 462 Event Information 15 Expert Insights 114 Expert Insights 76 Life at SAP 418 Life at SAP 1 Product Updates 4
1 -
Artificial Intelligence (AI) blockchain Data & Analytics
1 -
Artificial Intelligence (AI) blockchain Data & Analytics Intelligent Enterprise
1 -
Artificial Intelligence (AI) blockchain Data & Analytics Intelligent Enterprise Oil Gas IoT Exploration Production
1 -
Artificial Intelligence (AI) blockchain Data & Analytics Intelligent Enterprise sustainability responsibility esg social compliance cybersecurity risk
1 -
AS Java
1 -
ASE
1 -
ASR
2 -
Asset Management
2 -
Associations in CDS Views
1 -
ASUG
1 -
Attachments
1 -
Authentication
1 -
Authorisations
1 -
Authorizations
1 -
Automate the Interim Account Update rule using Integration Center Job (Time Off)
1 -
Automating Processes
1 -
Automation
2 -
aws
2 -
Azure
2 -
Azure AI Studio
1 -
Azure API Center
1 -
Azure API Management
1 -
B2B Integration
1 -
Background job
1 -
Backorder Processing
1 -
Backpropagation
1 -
Backup
1 -
Backup and Recovery
1 -
Backup schedule
1 -
BADI_MATERIAL_CHECK error message
1 -
Bank
1 -
Bank Communication Management
1 -
BAS
1 -
basis
2 -
Basis Monitoring & Tcodes with Key notes
2 -
Batch Management
1 -
BDC
1 -
Best Practice
1 -
BI
1 -
bitcoin
1 -
Blockchain
3 -
bodl
1 -
BOP in aATP
1 -
BOP Segments
1 -
BOP Strategies
1 -
BOP Variant
1 -
BPC
1 -
BPC LIVE
1 -
BTP
17 -
BTP AI Launchpad
1 -
BTP Destination
2 -
BTP for Sustainability
1 -
Business AI
1 -
Business and IT Integration
1 -
Business application stu
1 -
Business Application Studio
1 -
Business Architecture
1 -
Business Communication Services
1 -
Business Continuity
2 -
Business Data Fabric
3 -
Business Fabric
1 -
Business Partner
13 -
Business Partner Master Data
11 -
Business Technology Platform
2 -
Business Trends
4 -
BW4 HANA Dev
1 -
BW4HANA
1 -
C4C cloud root certificate
1 -
CA
1 -
calculation view
1 -
CAP
6 -
CAP development
1 -
Capgemini
1 -
CAPM
1 -
Catalyst for Efficiency: Revolutionizing SAP Integration Suite with Artificial Intelligence (AI) and
1 -
CCMS
2 -
CDQ
13 -
CDS
2 -
CDS Views
1 -
Cental Finance
1 -
Certificates
1 -
CFL
1 -
Change Management
1 -
chatbot
1 -
chatgpt
3 -
CICD
1 -
CL_SALV_TABLE
2 -
Class Runner
1 -
Classrunner
1 -
Cloud ALM Monitoring
1 -
Cloud ALM Operations
1 -
cloud connector
1 -
Cloud Extensibility
1 -
Cloud Foundry
4 -
Cloud Integration
6 -
Cloud Platform Integration
2 -
cloudalm
1 -
communication
1 -
Compensation Information Management
1 -
Compensation Management
1 -
Compliance
1 -
Compound Employee API
1 -
Configuration
1 -
Connectors
1 -
Consolidation
1 -
Consolidation Extension for SAP Analytics Cloud
3 -
Control Indicators.
1 -
Controller-Service-Repository pattern
1 -
Conversion
1 -
Corrective Maintenance
1 -
Cosine similarity
1 -
CPI
2 -
cryptocurrency
1 -
CSI
1 -
ctms
1 -
Custom chatbot
3 -
Custom Destination Service
1 -
custom fields
1 -
Custom Headers
1 -
Custom Widget
2 -
Customer Experience
1 -
Customer Journey
1 -
Customizing
1 -
cyber security
5 -
cybersecurity
1 -
Data
1 -
Data & Analytics
1 -
Data Aging
1 -
Data Analytics
2 -
Data and Analytics (DA)
1 -
Data Archiving
1 -
Data Back-up
1 -
Data Flow
1 -
Data Governance
5 -
Data Integration
2 -
Data Quality
13 -
Data Quality Management
13 -
Data Synchronization
1 -
data transfer
1 -
Data Unleashed
1 -
Data Value
9 -
Database
1 -
Database and Data Management
1 -
database tables
1 -
Databricks
1 -
Dataframe
1 -
Datasphere
4 -
Datasphere Delta
1 -
datenbanksicherung
1 -
dba cockpit
1 -
dbacockpit
1 -
Debugging
2 -
Defender
1 -
Delimiting Pay Components
1 -
Delta Integrations
1 -
Destination
3 -
Destination Service
1 -
Developer extensibility
1 -
Developing with SAP Integration Suite
1 -
Devops
1 -
digital transformation
1 -
Disaster Recovery
1 -
Documentation
1 -
Dot Product
1 -
DQM
1 -
dump database
1 -
dump transaction
1 -
e-Invoice
1 -
E4H Conversion
1 -
Eclipse ADT ABAP Development Tools
2 -
edoc
1 -
edocument
1 -
ELA
1 -
Embedded Consolidation
1 -
Embedding
1 -
Embeddings
1 -
Emergency Maintenance
1 -
Employee Central
1 -
Employee Central Payroll
1 -
Employee Central Time Off
1 -
Employee Information
1 -
Employee Rehires
1 -
Enable Now
1 -
Enable now manager
1 -
endpoint
1 -
Enhancement Request
1 -
Enterprise Architecture
2 -
Enterprise Asset Management
2 -
Entra
1 -
ESLint
1 -
ETL Business Analytics with SAP Signavio
1 -
Euclidean distance
1 -
Event Dates
1 -
Event Driven Architecture
1 -
Event Mesh
2 -
Event Reason
1 -
EventBasedIntegration
1 -
EWM
1 -
EWM Outbound configuration
1 -
EWM-TM-Integration
1 -
Existing Event Changes
1 -
Expand
1 -
Expert
2 -
Expert Insights
2 -
Exploits
1 -
Fiori
16 -
Fiori App Extension
2 -
Fiori Elements
2 -
Fiori Launchpad
2 -
Fiori SAPUI5
13 -
first-guidance
2 -
Flask
2 -
Fragment Forms
1 -
Fragment Forms using ABA[
1 -
FTC
1 -
Full Stack
9 -
Funds Management
1 -
gCTS
1 -
GenAI hub
1 -
General
3 -
Generative AI
1 -
Getting Started
1 -
GitHub
11 -
Google cloud
1 -
Grants Management
1 -
groovy
2 -
GTP
1 -
HANA
6 -
HANA Cloud
3 -
hana cloud database
2 -
Hana Cloud Database Integration
2 -
HANA DB
2 -
Hana Vector Engine
1 -
HANA XS Advanced
1 -
HanaDB
1 -
Historical Events
1 -
home labs
1 -
HowTo
1 -
HR Data Management
1 -
html5
9 -
HTML5 Application
1 -
Identity cards validation
1 -
idm
1 -
Implementation
1 -
Improvement Maintenance
1 -
Infuse AI
1 -
input parameter
1 -
instant payments
1 -
Integration
3 -
Integration Advisor
1 -
Integration Architecture
1 -
Integration Center
1 -
Integration Suite
1 -
intelligent enterprise
1 -
Internal Table
1 -
IoT
2 -
Java
1 -
Java Script
1 -
JavaScript
2 -
JMS Receiver channel ping issue
1 -
job
1 -
Job Information Changes
1 -
Job-Related Events
1 -
Job_Event_Information
1 -
joule
4 -
Journal Entries
1 -
Just Ask
1 -
Kafka
1 -
Kerberos for ABAP
10 -
Kerberos for JAVA
9 -
KNN
1 -
Launch Wizard
1 -
Learning Content
3 -
Life at SAP
4 -
lightning
1 -
Linear Regression SAP HANA Cloud
1 -
Live Sessions
1 -
Loading Indicator
1 -
local tax regulations
1 -
LP
1 -
Machine Learning
4 -
Marketing
1 -
Master Data
3 -
Master Data Management
15 -
Maxdb
2 -
MDG
1 -
MDGM
1 -
MDM
1 -
Message box.
1 -
Messages on RF Device
1 -
Microservices Architecture
1 -
Microsoft
1 -
Microsoft Universal Print
1 -
Middleware Solutions
1 -
Migration
5 -
ML Model Development
1 -
MLFlow
1 -
Modeling in SAP HANA Cloud
9 -
Monitoring
3 -
MPL
1 -
MTA
1 -
Multi-factor-authentication
1 -
Multi-Record Scenarios
1 -
Multilayer Perceptron
1 -
Multiple Event Triggers
1 -
Myself Transformation
1 -
Neo
1 -
NetWeaver
1 -
Neural Networks
1 -
New Event Creation
1 -
New Feature
1 -
Newcomer
1 -
NodeJS
3 -
ODATA
2 -
OData APIs
1 -
odatav2
1 -
ODATAV4
1 -
ODBC
1 -
ODBC Connection
1 -
Onpremise
1 -
open source
2 -
OpenAI API
1 -
Optimized Story Experience
1 -
Oracle
1 -
Overhead and Operational Maintenance
1 -
PaPM
1 -
PaPM Dynamic Data Copy through Writer function
1 -
PaPM Remote Call
1 -
Partner Built Foundation Model
1 -
PAS-C01
1 -
Pay Component Management
1 -
Personal story
1 -
PGP
1 -
Pickle
1 -
PLANNING ARCHITECTURE
1 -
Plant Maintenance
2 -
Plugin Attachment
1 -
Popup in Sap analytical cloud
1 -
Postgresql
1 -
PostgrSQL
1 -
POSTMAN
1 -
Practice Systems
1 -
Prettier
1 -
Proactive Maintenance
1 -
Process Automation
2 -
Product Updates
6 -
Product Updates
1 -
PSE
1 -
PSM
1 -
Public Cloud
1 -
Python
5 -
python library - Document information extraction service
1 -
Qlik
1 -
Qualtrics
1 -
RAP
3 -
RAP BO
2 -
React
1 -
Reactive Maintenance
2 -
Record Deletion
1 -
Recovery
1 -
recurring payments
1 -
redeply
1 -
Release
1 -
Remote Consumption Model
1 -
Replication Flows
1 -
Report Malfunction
1 -
report painter
1 -
research
1 -
Research and Development Custom Widgets in SAP Analytics Cloud
1 -
Resilience
1 -
REST
1 -
REST API
1 -
Retagging Required
1 -
RFID
1 -
Risk
1 -
rolandkramer
3 -
Rolling Kernel Switch
1 -
route
1 -
Route determination
1 -
Router Non-XML condition
1 -
rules
1 -
S4 HANA
2 -
S4 HANA ABAP Dev
1 -
S4 HANA Cloud
2 -
S4 HANA On-Premise
3 -
S4HANA
6 -
S4HANA Cloud
1 -
S4HANA_OP_2023
2 -
SAC
11 -
SAC PLANNING
10 -
SAN
1 -
SAP
4 -
SAP ABAP
1 -
SAP Advanced Event Mesh
2 -
SAP AI Core
10 -
SAP AI Launchpad
9 -
SAP Analytic Cloud
1 -
SAP Analytic Cloud Compass
1 -
Sap Analytical Cloud
1 -
SAP Analytics Cloud
8 -
SAP Analytics Cloud for Consolidation
3 -
SAP Analytics cloud planning
1 -
SAP Analytics Cloud Story
1 -
SAP analytics clouds
1 -
SAP API Management
1 -
SAP Application Lifecycle Management
1 -
SAP Application Logging Service
1 -
SAP BAS
1 -
SAP Basis
6 -
SAP BO FC migration
1 -
SAP BODS
1 -
SAP BODS certification.
1 -
SAP BODS migration
1 -
SAP BPC migration
1 -
SAP BTP
26 -
SAP BTP Build Work Zone
2 -
SAP BTP Cloud Foundry
8 -
SAP BTP Costing
1 -
SAP BTP CTMS
1 -
SAP BTP Generative AI
1 -
SAP BTP Innovation
1 -
SAP BTP Migration Tool
1 -
SAP BTP SDK IOS
1 -
SAP BTPEA
1 -
SAP Build
12 -
SAP Build App
1 -
SAP Build apps
1 -
SAP Build CodeJam
1 -
SAP Build Process Automation
3 -
SAP Build work zone
11 -
SAP Business Objects Platform
1 -
SAP Business Technology
2 -
SAP Business Technology Platform (XP)
1 -
sap bw
1 -
SAP CAP
2 -
SAP CDC
1 -
SAP CDP
1 -
SAP CDS VIEW
1 -
SAP Certification
1 -
SAP Cloud ALM
5 -
SAP Cloud Application Programming Model
2 -
SAP Cloud Integration
1 -
SAP Cloud Integration for Data Services
1 -
SAP cloud platform
9 -
SAP Companion
1 -
SAP CPI
3 -
SAP CPI (Cloud Platform Integration)
2 -
SAP CPI Discover tab
1 -
sap credential store
1 -
SAP Customer Data Cloud
1 -
SAP Customer Data Platform
1 -
SAP Data Intelligence
1 -
SAP Data Migration in Retail Industry
1 -
SAP Data Services
1 -
SAP DATABASE
1 -
SAP Dataspher to Non SAP BI tools
1 -
SAP Datasphere
10 -
SAP DRC
1 -
SAP EWM
1 -
SAP Fiori
3 -
SAP Fiori App Embedding
1 -
Sap Fiori Extension Project Using BAS
1 -
SAP GRC
1 -
SAP HANA
1 -
SAP HANA Dev tools
1 -
SAP HANA PAL
1 -
SAP HANA Vector
1 -
SAP HCM (Human Capital Management)
1 -
SAP HR Solutions
1 -
SAP IDM
1 -
SAP Integration Suite
10 -
SAP Integrations
4 -
SAP iRPA
2 -
SAP LAGGING AND SLOW
1 -
SAP Learning Class
2 -
SAP Learning Hub
1 -
SAP Master Data
1 -
SAP Odata
3 -
SAP on Azure
2 -
SAP PAL
1 -
SAP PartnerEdge
1 -
sap partners
1 -
SAP Password Reset
1 -
SAP PO Migration
1 -
SAP Prepackaged Content
1 -
sap print
1 -
SAP Process Automation
2 -
SAP Process Integration
2 -
SAP Process Orchestration
1 -
SAP Router
1 -
SAP S4HANA
2 -
SAP S4HANA Cloud
3 -
SAP S4HANA Cloud for Finance
1 -
SAP S4HANA Cloud private edition
1 -
SAP Sandbox
1 -
SAP STMS
1 -
SAP successfactors
3 -
SAP SuccessFactors HXM Core
1 -
SAP Time
1 -
SAP TM
2 -
SAP Trading Partner Management
1 -
SAP UI5
1 -
SAP Upgrade
1 -
SAP Utilities
1 -
SAP-GUI
9 -
SAP_COM_0276
1 -
SAPBTP
1 -
SAPCPI
1 -
SAPEWM
1 -
sapfirstguidance
4 -
SAPHANAService
1 -
SAPIQ
2 -
sapmentors
1 -
saponaws
2 -
saprouter
1 -
SAPRouter installation
1 -
SAPS4HANA
1 -
SAPUI5
5 -
schedule
1 -
Script Operator
1 -
Secure Login Client Setup
9 -
security
11 -
Selenium Testing
1 -
Self Transformation
1 -
Self-Transformation
1 -
SEN
1 -
SEN Manager
1 -
Sender
1 -
service
2 -
SET_CELL_TYPE
1 -
SET_CELL_TYPE_COLUMN
1 -
SFTP scenario
2 -
Simplex
1 -
Single Sign On
9 -
Singlesource
1 -
SKLearn
1 -
Slow loading
1 -
SOAP
2 -
Software Development
1 -
SOLMAN
1 -
solman 7.2
2 -
Solution Manager
3 -
sp_dumpdb
1 -
sp_dumptrans
1 -
SQL
1 -
sql script
1 -
SSL
10 -
SSO
9 -
Story2
1 -
Substring function
1 -
SuccessFactors
1 -
SuccessFactors Platform
1 -
SuccessFactors Time Tracking
1 -
Sybase
1 -
Synthetic User Monitoring
1 -
system copy method
1 -
System owner
1 -
Table splitting
1 -
Tax Integration
1 -
Technical article
1 -
Technical articles
1 -
Technology Updates
15 -
Technology Updates
1 -
Technology_Updates
1 -
terraform
1 -
Testing
1 -
Threats
2 -
Time Collectors
1 -
Time Off
2 -
Time Sheet
1 -
Time Sheet SAP SuccessFactors Time Tracking
1 -
Tips and tricks
2 -
toggle button
1 -
Tools
1 -
Trainings & Certifications
1 -
Transformation Flow
1 -
Transport in SAP BODS
1 -
Transport Management
1 -
TypeScript
3 -
ui designer
1 -
unbind
1 -
Unified Customer Profile
1 -
UPB
1 -
UploadSetTable
1 -
Use of Parameters for Data Copy in PaPM
1 -
User Unlock
1 -
VA02
1 -
Validations
1 -
Vector Database
2 -
Vector Engine
1 -
Vectorization
1 -
Visual Studio Code
1 -
VSCode
2 -
VSCode extenions
1 -
Vulnerabilities
1 -
Web SDK
1 -
Webhook
1 -
work zone
1 -
workload
1 -
xsa
1 -
XSA Refresh
1
- « Previous
- Next »
Related Content
- Adapt Clean Core Principle using SAP Cloud ALM in Technology Blogs by Members
- SAP BTP Innobytes – April 2024 in Technology Blogs by SAP
- The 2024 Developer Insights Survey: The Report in Technology Blogs by SAP
- 10+ ways to reshape your SAP landscape with SAP Business Technology Platform – Blog 4 in Technology Blogs by SAP
- Responsive vs. Canvas in SAP Analytics Cloud with Optimized Design Experience in Technology Blogs by Members
Top kudoed authors
| User | Count |
|---|---|
| 6 | |
| 5 | |
| 5 | |
| 4 | |
| 4 | |
| 4 | |
| 4 | |
| 3 | |
| 3 | |
| 3 |