
- SAP Community
- Groups
- Industry Groups
- SAP for Chemicals
- Blogs
- Value Management Approach for the Chemical Compani...
SAP for Chemicals Blogs
Explore blog posts by chemical industry leaders and SAP experts, showcasing transformative solutions powered by SAP. Contribute a blog post of your own.
Turn on suggestions
Auto-suggest helps you quickly narrow down your search results by suggesting possible matches as you type.
Showing results for
Employee
Options
- Subscribe to RSS Feed
- Mark as New
- Mark as Read
- Bookmark
- Subscribe
- Printer Friendly Page
- Report Inappropriate Content
11-04-2022
5:13 PM
Ola, boa tarde!
Reference
This is the Part 2 of the blog article series I would like to describe the Value Management Approach for Chemical companies.
- The Part 1 could be found here: https://blogs.sap.com/2022/10/24/value-management-approach-for-the-chemical-companies-part-1/
Previously in the Part 1 I have delivered my point of view to the common approach to the value estimation for the transformation programs and its main problem and gave the overview how to manage the value lifecycle more efficiently.
Part 1 concluded with the overview scheme describing the effective value management approach in common in one picture. I must post the picture again here to refer during this Part 2.
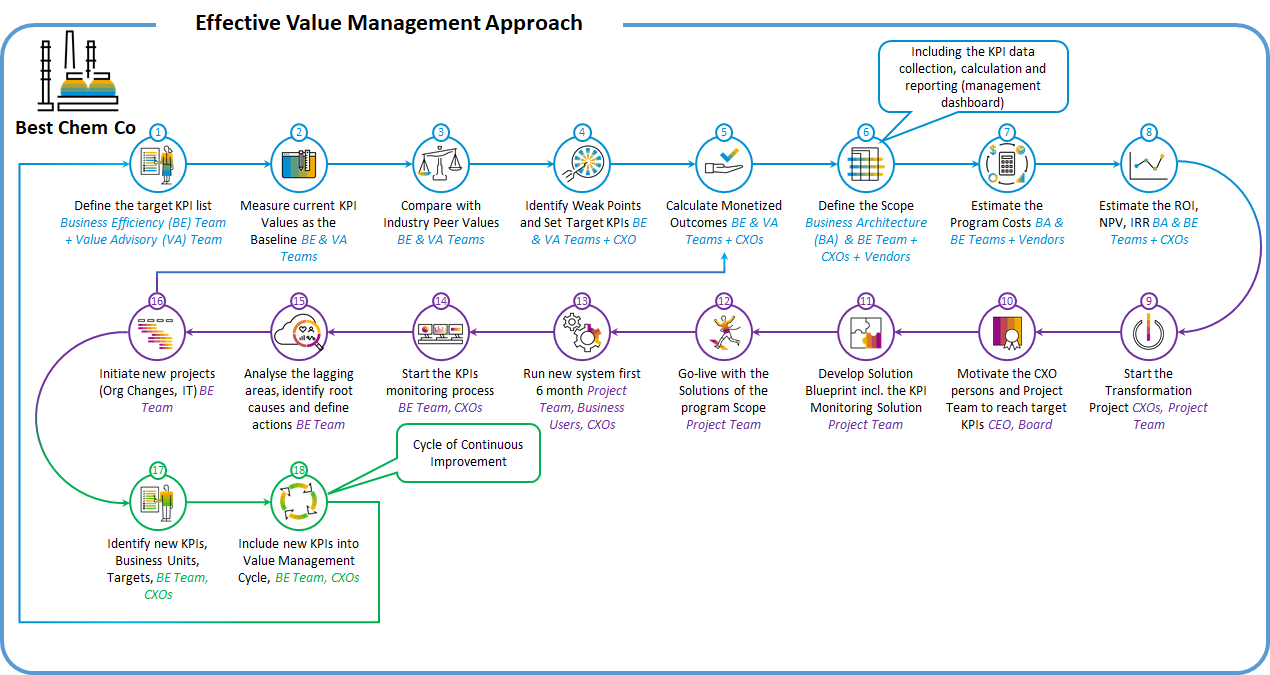
Picture 1. The effective Value Management Approach – high-level overview.
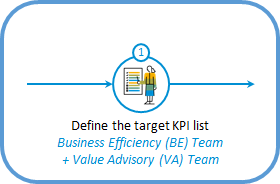
And I would like to start from the Step 1 “Define the target KPI List”
The KPI list relevant for the Chemical Company | Step 1.
There are many sources of the KPIs for industries, but for transformation programs realized with SAP I suggest using the public tool “SAP Value Lifecycle Manager” or SAP VLM (https://vlm.cfapps.eu10.hana.ondemand.com/index.html#/home) which provides big list of advantages, but major one be especially described below.
Note 1: the instruction of the SAP VLM tool usage is out of the scope of my blog. If you are interesting, you can self-register and proceed with “How to videos”

Picture 2. The SAP Value Lifecycle Manager start screen and “How to videos” link.
Note 2: if you are not SAP employee you can self-register using your corporate e-mail and try the SAP VLM, but available functions and data will be limited significantly. For better experience please contact your SAP Account Executive and ask to provide the special workshop with SAP Value Advisory Team.
I would like to propose example of starting list of KPIs based on SAP VLM recommendations and my experience.

Picture 3. Example of proposed KPI list for the start of transformation program.
This list has been defined based on following assumptions:
- Not many for each business process area.
- 3 to 5 KPIs per area is a very good quantity to start the value journey,
- Consider that each KPI baseline data should be collected for each business unit. That´s why for 5 business units (for example) every KPI be multiplied x5,
- They lead to clear monetized benefits (Revenue, Costs, Margin, Working capital),
- They are being selected by SAP Value Advisory experts for the Chemical Industry:
- Asset management area is highly important for Chemicals asset-incentive industry with continuous production cycle where shutdown of the one equipment might cause stop all production line with losses of production volumes and with high costs and time of the process restart,
- Manufacturing area and especially Overall Equipment Effectiveness (OEE) also critically important for the process where equipment should run in 24x7x365 mode,
- Sustainability with especially energy consumption ratio and manufacturing safety performance does not need any additional comments,
- Material turnaround or “Days in Inventory” (DII) impacts significantly to the working capital and should be measured for every type of inventories separately (raw materials, semi-products, goods, MRO material, CAPEX materials, others),
- Days Payables Outstanding (DPO) and Days Sales Outstanding (DSO) together with DII impact on Cash Conversion Cycle and possibility to manage and financing the operations with lower external credits to decrease the cost of capital.
Of course, this KPIs list is not cast in granite. You can adopt it on your own opinion about preferred value areas, but I suggest considering:
- Do not try to take many KPIs from the beginning. each additional KPI will increase your workload dramatically (see steps 1 to 16 on the Picture 1 and remember the multiplicator – quantity of business units), and you will have possibility to include them later (see steps 17 and 18 on the Picture 1),
- KPIs provided by SAP VLM can be compared with your industrial peers and it makes easy to find a waypoint to your next move.
During this blog I cannot proceed deeper into details of each KPI, the calculation formula and financial impact. I plan to dive into several examples further on, in Step 5 “Calculate Monetized Outcomes”. Also, you can get more information about each of KPIs in SAP VLM and in many external resources, I recommend starting with investopedia.com or even Wikipedia (example – DII).
Roles and responsibilities for the Step 1:
Step 1 should be performed by company’s Business Efficiency (BE) team with assistance and advisory of SAP Value Advisory team (SAP VA) on the KPI List preparation phase.
Outcomes for the Step 1:
After preparation the KPI List and approval by executives, the company should start the baseline data collection. That leads us to Step 2 which is much more complex.
Measure current KPI Values as the Baseline | Step 2.

As I mentioned previously this Step is mandatory with two very simple reasons:
- Any measurable improvement is the delta between “Before” and “After”. So, to know your improvement in the future you should know your starting point on today,
- Baseline – is the not only starting point but also waypoint where you should go. Where (which areas) exactly and what (how much) potential to improvement the company has.
The KPI responsibility table
Different KPIs refer to different business or organizational units. For example, DSO does not refer to Ammonia or Cracking Plant, and OEE does not refer to the sales department. That´s why before data collection company should define the KPI responsibility matrix. Here is the short example how this matric could be defined.
To do this let’s assume following simplified and small-partial example of the “Best Chem Company” organizational structure.
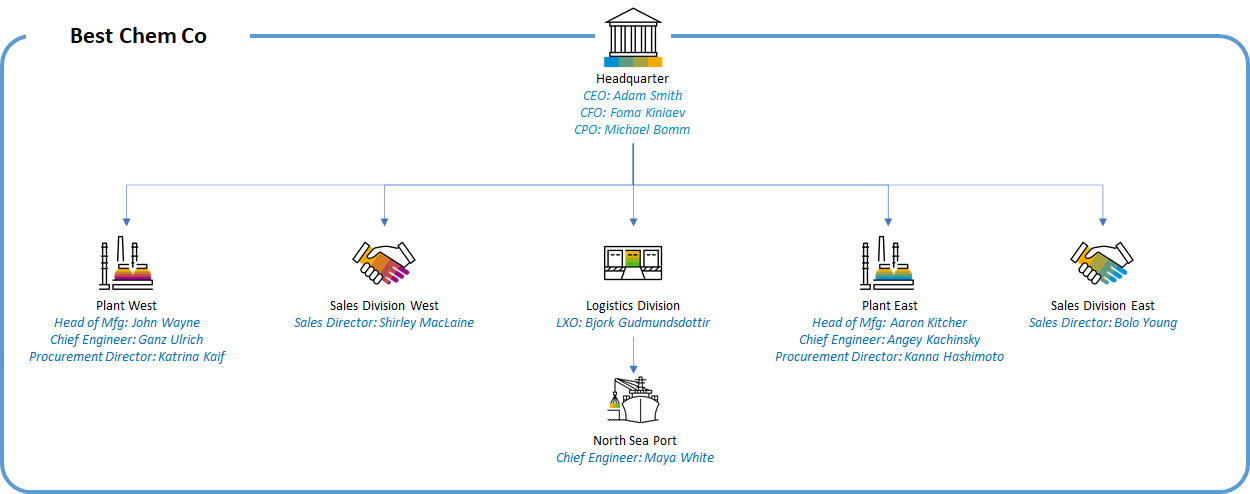
Picture 4. Simplified and partial example of the “Best Chem Company” organizational structure.
According to this short example of the organizational structure we can define the KPI responsibility table for 5 KPIs as an example (DII of MRO, OEE, CFA, DSO, OTD). This table for these 5 KPIs should look like that:
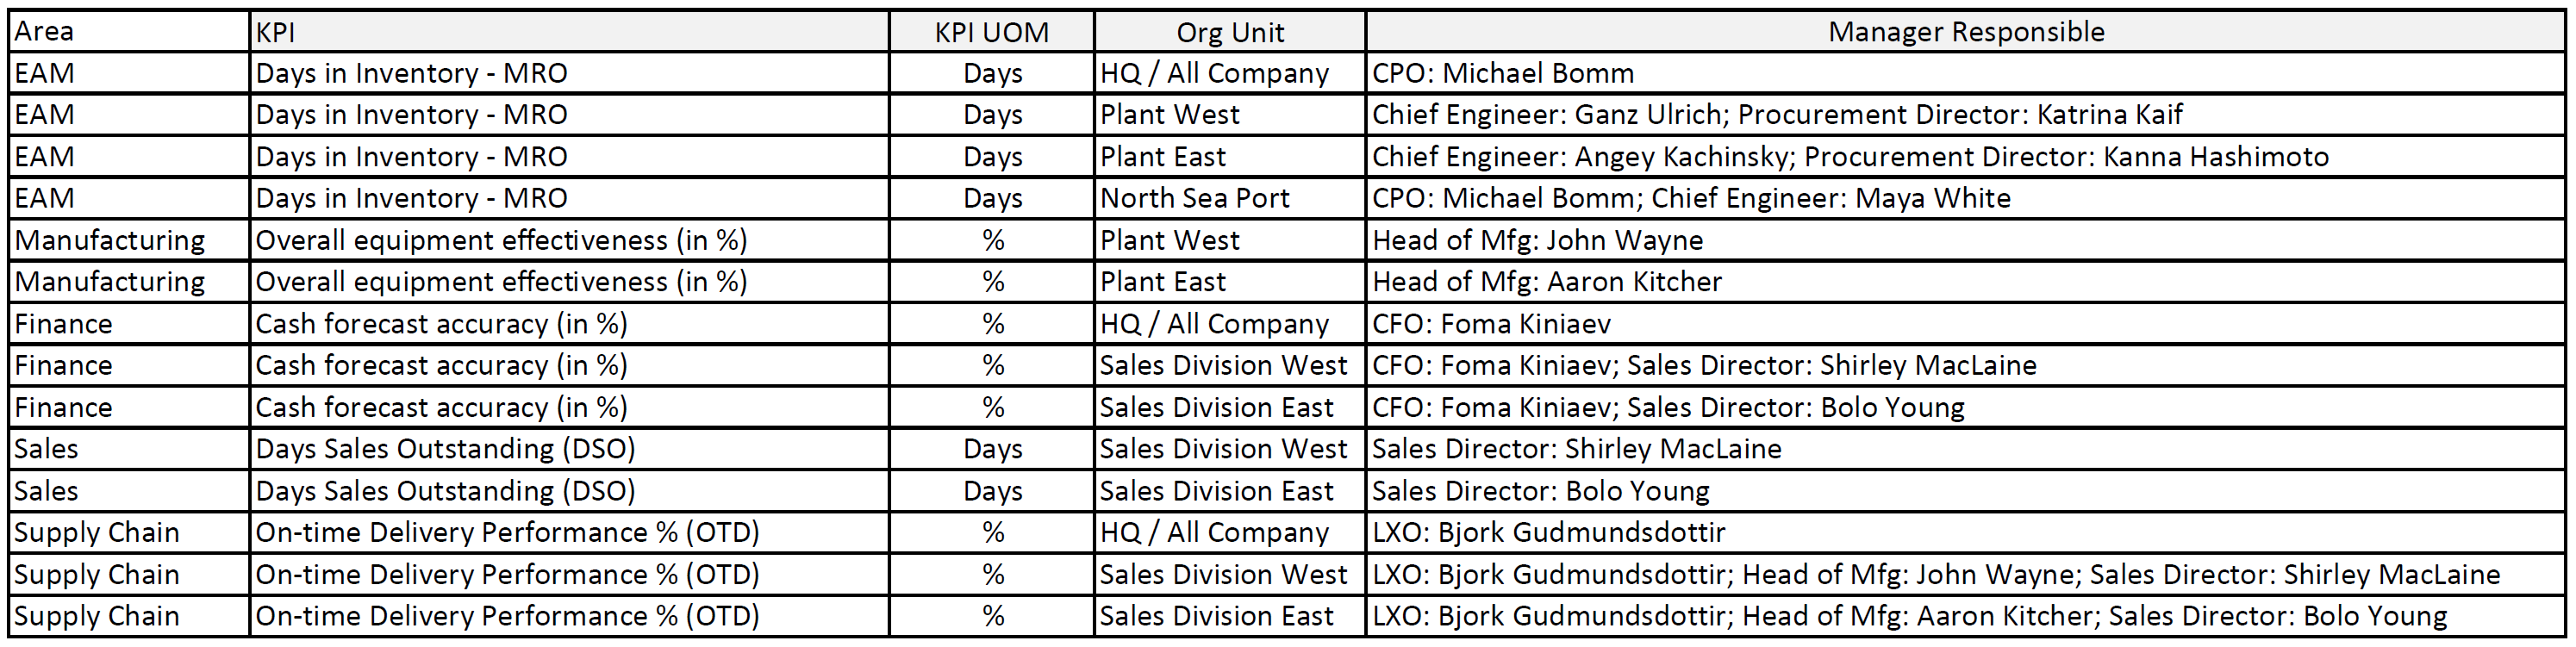
Picture 5. Example of the KPI responsibility table by organizational units.
Please pay your attention to for the very short example of organizational structure and very small KPI quantity we got the table with 14 lines. And data for every line should be collected and processed with calculations. That’s why it´s important to make a reasonable limitation of the KPI as the output of the step 1. It´s easy to get more than 100 … 200 lines for the big company and be overloaded on the earlier data collection step.
The data collection order
Now you can issue an order for the company based on the KPI responsibility table. The order is a mandatory step because:
- The KPI project team will face lots of work which consume lots of working time and resources in many different departments,
- The working time and workload required on the company side should be defined and “legalized” inside the company,
- The business colleagues should disclosure lots of very sensitive information including pain areas with lack of performance,
- The timeline of the working tasks should be defined,
- The responsible persons should be defined:
- For the data collection templates,
- For the source data collection,
- For the data collection management / orchestration on the company side,
- For the data validation and acceptance on the project team side,
Without the order the data collection job fill fail. With the order we do have a chance on success.
Data collection templates
There might be three possible tools to collect and store the source data:
- SAP VLM Tool,
- Corporate Business Warehouse (BW),
- Spreadsheet Template.
SAP VLM is the has the embedded function to choose SAP-provided drivers related to SAP solution capabilities, estimate effects, and calculate business case. It can be used for the value management but requires time and expert resources to work with it.
The alternative is using the Spreadsheet or Corporate BW. BW is much more reliable but requires the development of the data structures, data entries forms, etc. – and suitable for big companies with complex organizational structure, high data complexity and enough resources for the development.
For the detailed explanation of the common approach to manage the value, I will use MS Excel spreadsheets in this blog article. The usage of the SAP VLM for the whole story might be the subject of another blog cycle in the future – this tool is different; it contains the similar idea but it’s more difficult to explain all the calculations.
Templates are depended on target KPIs and its calculation algorithms, and to create the KPI data collection templates I should explain them first. I will take the MRO DII KPI – one of I chose as an example on the picture 5.
DII MRO (Days in Inventory – MRO Materials and Spare Parts), UOM = Days
- Formulae: DII MRO = (“Annual Value of MRO Materials and Spare Parts Spend” / “Average Inventory Value of MRO Materials and Spare Parts”) * 365
- Where:
- “Annual Value of MRO Materials and Spare Parts Spend” – annual value of all materials and spare parts spent (means: issued from inventory, not procured) during the year for the maintenance purposes, UOM = Currency,
- “Average Inventory Value of MRO Materials and Spare Parts” – average inventory value for the year. Calculates like (“Inventory Value of MRO Materials and Spare Parts” on the 1st-Jan-YYYY + “Inventory Value of MRO Materials and Spare Parts” on the 31st-Dec-YYYY) / 2, UOM = Currency,
- Where:
- Meaning: How long (in days) the average MRO material unit is staying inside the Inventory from the receipt (from an external supplier) to the issue, value less is better, and more is worse,
- Processes impact on the KPI:
- Material Master Data Management,
- EAM Master Data Management,
- EAM Long-term Planning (quarterly, monthly),
- Material Requirements Planning (MRP),
- Sourcing and Suppliers Performance Management,
- Procurement,
- Inbound Delivery and Quality Management,
- Warehouse Management,
- Value Impact: Very high. The frozen inventory means consumed working capital which could be invested or deposited when freed,
- Known issues:
- It might be difficult to identify the annual inventory on the MRO and non-MRO (for example – cables may be used for MRO and for the Capital Construction), data collection might consume high workload and require lots of management decisions about,
- Complex planned shutdowns for the overhaul in Chemicals might perform not every year, in this case calculation results for one year only will provide wrong insights. That’s why data should be collected at least for 3 previous years,
- Obsolete inventory might be the legacy of bad management from several years ago, it also should be considered to get right insights and decisions.
Please pay your attention on “Known Issues” bullet above. Every sub-bullet is extremely important and cannot be skipped or ignored if want to get the success. If you decide to skip something here – your respective customers from the business will challenge your results easily and (what is even more important) your conclusions and next action items be wrong.
Based on inputs above, the data collection template for “DII MRO” should look like this:
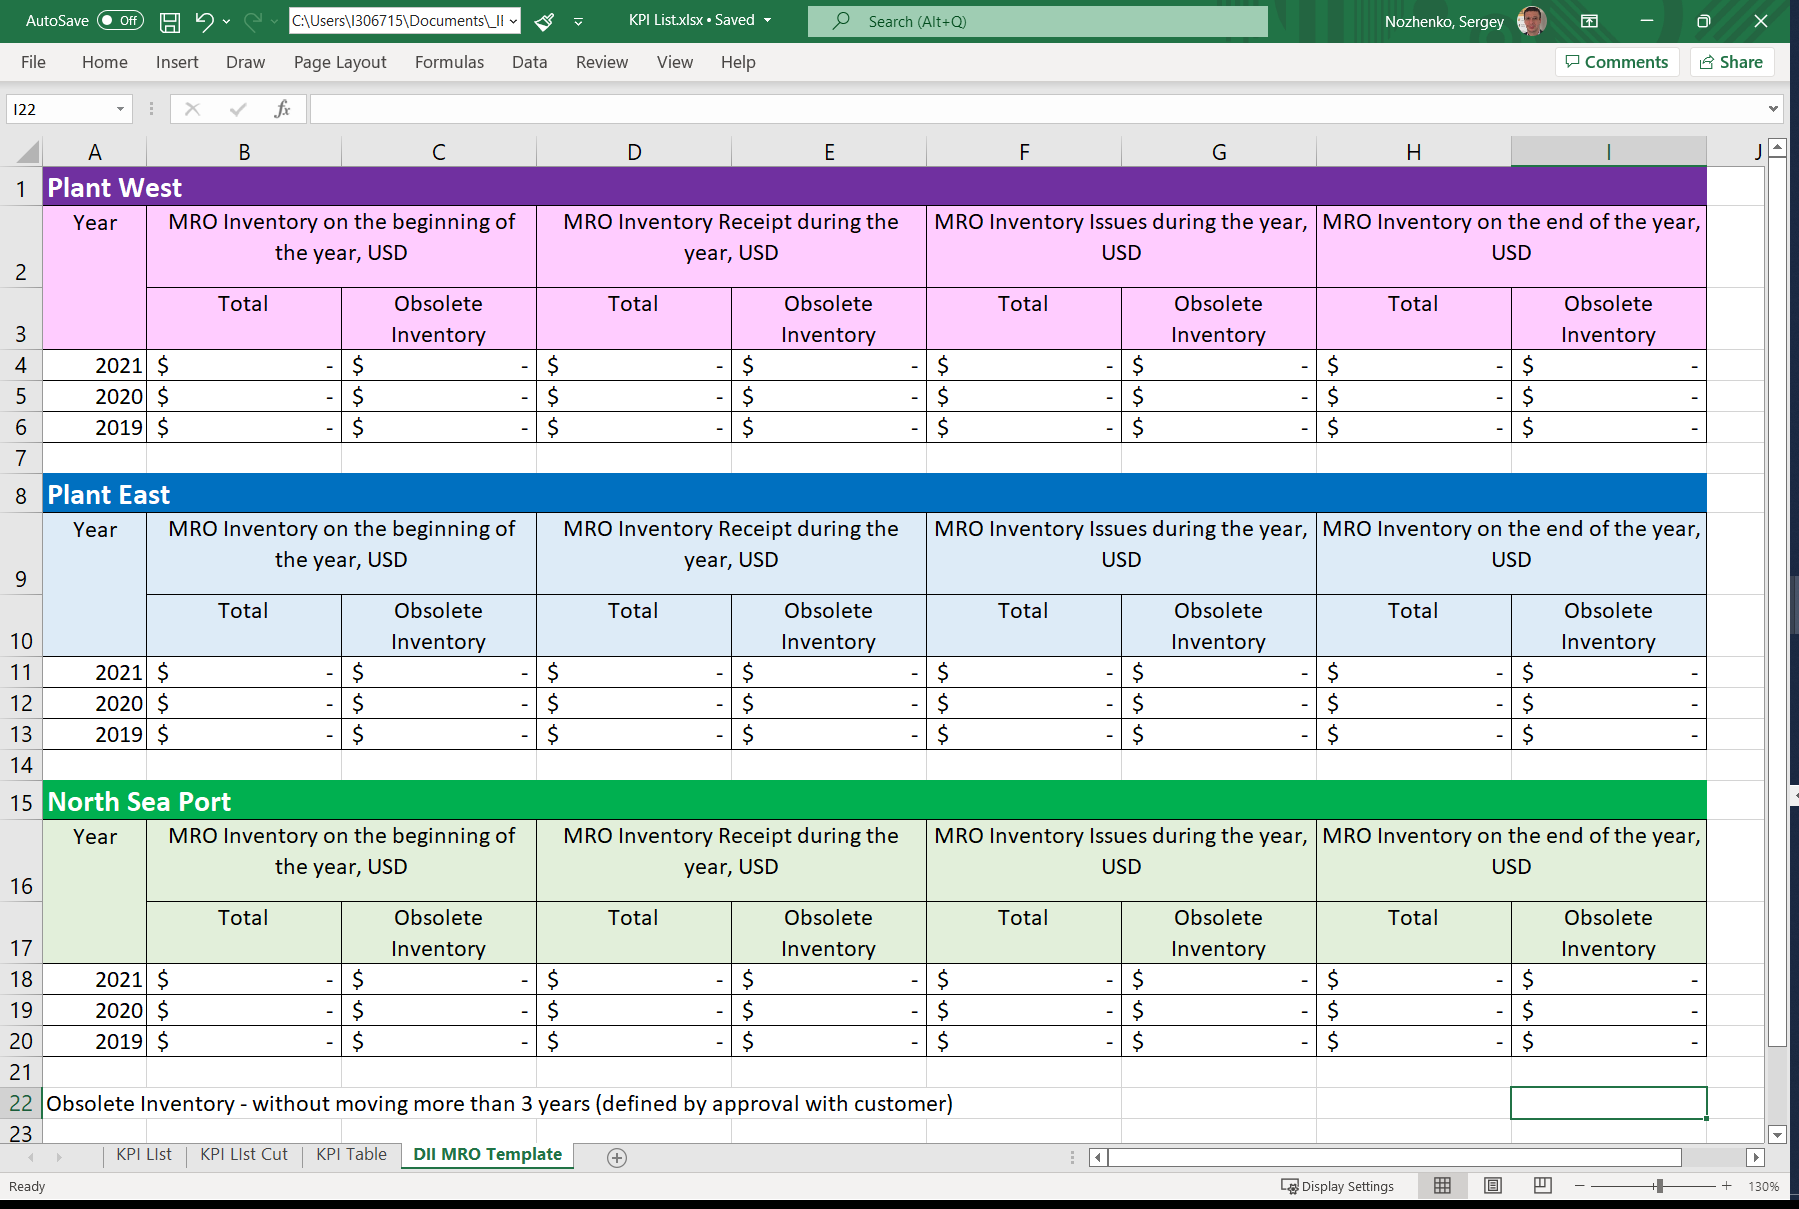
Picture 6. Data Collection Template for DII MRO.
Similar templates need to be prepared for all KPIs and organizational units. The template content depends on the calculation algorithms and standard issues with the KPI usage described above.
There is a similar expertise for the KPIs algorithms, description, value effect, known issues and for data collection templates, unfortunately it cannot be disclosure inside this blog because of huge volume of the information. But you always can contact your SAP Sales Representative to schedule the detailed discussion about.
Data collection management / validation
To collect the source data, you need to create the special procedure and assign the responsible management person from the business side. Standard way to do so is to define the responsible manager in the data collection order mentioned above.
This is necessary because for the data collection you will need to send dozens of different files to different divisions and managers. As it follows from the example on picture 6 you need to send the 3 files to 3 different persons – and that just only for one KPI.
One issue – is timing and priority. The responsible persons’ reply time should be managed carefully.
Next issue: it´s very rare for the data template filled with good quality from the first iteration. Usually, as the result of 1st and even 2nd tries return the bad quality data – with white spaces, inconsistencies, wrong formats, and other issues. And all these issues should be identified fast, comments on data quality must be formulated promptly and in details, and then next iteration should run.
All this process must be manageable – otherwise the data collection will take too much time and the project might become at risk. This work is mandatory, time and resource consuming, and should be planned upfront. Normal time for the data collection is about 1 month including all iterations and data quality checks.
All collected and validated data (actual versions only) should be placed in one spreadsheet on different tabs. This is important for all upcoming activities starting KPI calculations.
KPI calculations
All KPI calculations should be performed in one spreadsheet file by formulas which are linked to the source data. The reason to do so is the ability to make prompt reply and fast and transparent clarification of every KPI value in a probable situation where questions and doubts will take place. Another reason is to use this KPI Table for all upcoming calculations of the business outcomes.
Here is the example of the KPI calculations table.
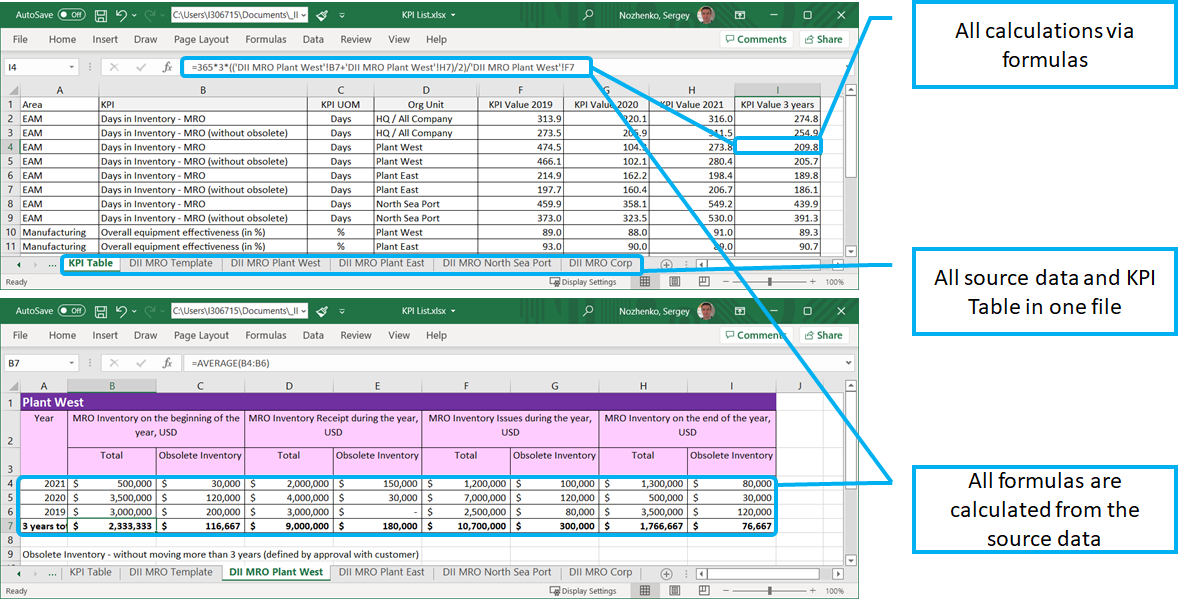
Picture 7. Example of the KPI Calculation table based on the collected data.
It’s also necessary to present the calculation results in the graphical view for clarity and simplicity. To do so you can use the embedded graphical tool in your office software.
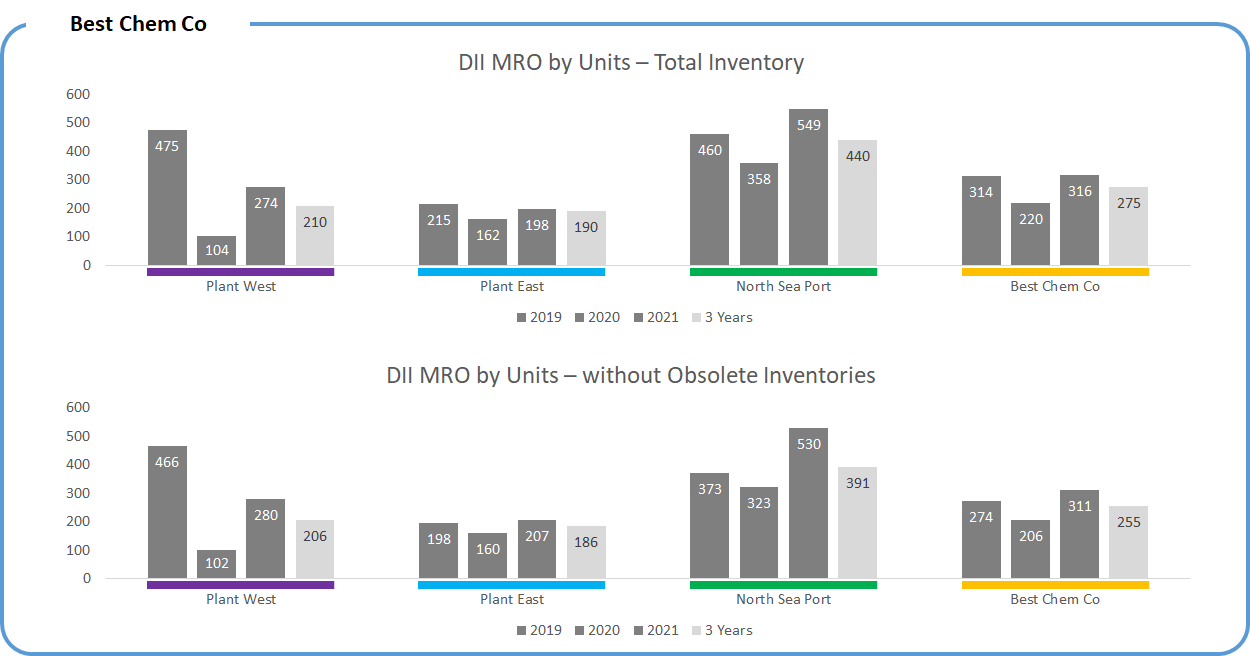
Picture 8. Graphical representation of the KPI calculation results.
As I mentioned above, there is a reason to calculate and analyse the DII MRO for 3 previous years plus 3-years average for the Chemical and other asset-intensive industries. The reason – long cycles of supplies of some materials and more-than-year frequency of overhauls. It’s important to calculate 3-years average DII to smooth the possible peak effect. There are similar reasons for any other KPIs to analyse several periods and to clarify level of other analytics details.
Roles and responsibilities for the Step 2:
Step 2 should be performed by company’s Business Efficiency (BE) team with assistance and advisory of SAP Value Advisory team (SAP VA) on the KPI List preparation phase.
Outcomes for the Step 2:
After preparation of the KPIs’ Algorithms, collecting the data and perform the calculations the project team should perform the peer's comparison. That leads us to the Step 3.
Dare to compare | Step 3

There is the way to compare your company KPI values with the peers of your industry. To do so I suggest using the SAP VLM where you can fill in the benchmarking questionnaire with specifying the industry (Chemicals) and other selection criteria. Peers’ values are divided on three
- Average 25% of the worst values in the recorder dataset,
- Medium value,
- Average 25% of the best values.
The deep dive into SAP VLM is out of scope this blog but I can mention major points:
- The SAP VLM source data for KPIs is collected from our customers around the world (with agreement from SAP customers to do so),
- The data is actualized continuously with every new data record,
- The same KPIs are calculated by same algorithms and based the same data structures and logic – that’s why it can be compare,
- KPIs outcome calculates as average sum, that’s why details about exact KPI value of each customer cannot be disclosure to any another and all outputs are anonymized,
In our example I will use the comparison values for the DII MRO for Chemical industry (data valid at moment of writing this article):
- Bottom 25% = 210 Days,
- Average = 140 Days,
- Top 25% = 75 Days
In graphic representation it would look like that:
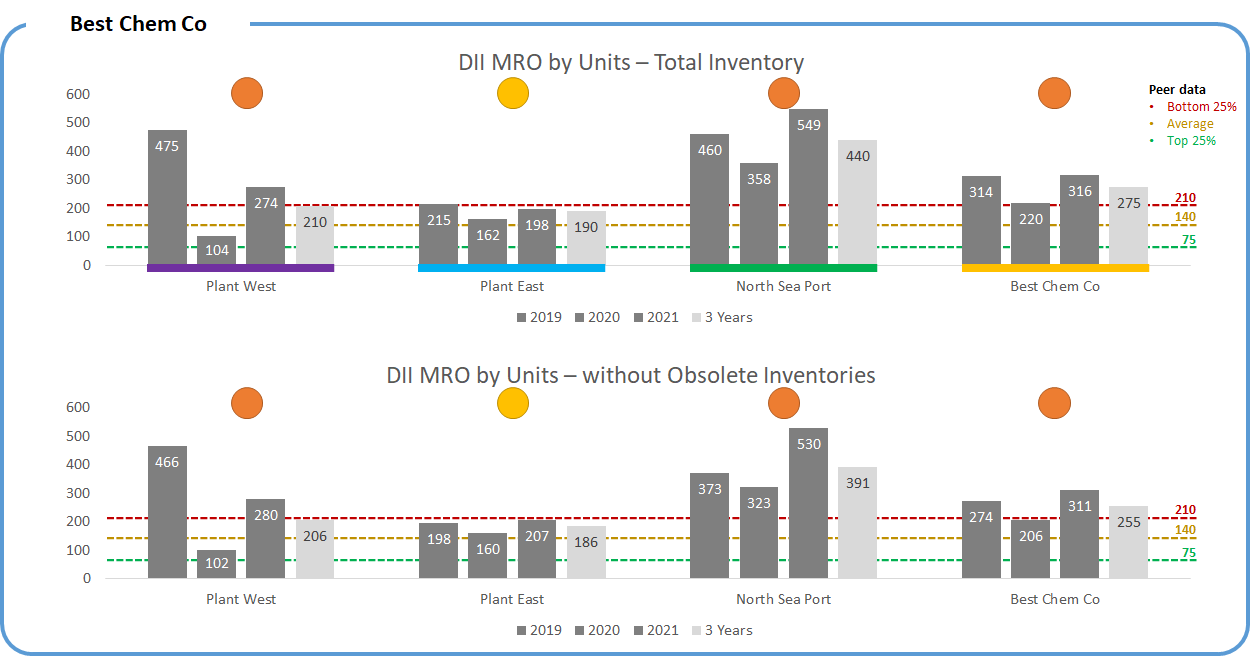
Picture 9. Graphical representation of the KPI comparison.
In our example we can conclude that common status of the “Best Chem Co” is red, and it means the huge potential to improvements and to getting the business effects. Also, we can see that KPI values and yearly patterns of different divisions are different and might be caused by variety of reasons, and that is the good starting point to further discussion with business.
Similar graph should be prepared as the result of all KPIs calculation and comparison – those be required for analysis and further discussions with business.
Roles and responsibilities for the Step 3:
Step 3 should be performed by company’s Business Efficiency (BE) team with assistance and advisory of SAP Value Advisory team (SAP VA) on the defining of the peer values.
Outcomes for the Step 3:
After firs look on the comparison results, we can formulate some hypothesis and discuss it with the business to identify the transformation priorities and measurable targets. Also, current results must be stored as the baseline for the future calculations of actual outcomes. That leads us to the Step 4.
What next?
In this article which is Part 2 in the series I described first 3 Steps to build the effective value management approach based on the transformation. The topics are: KPIs list relevant to Chemicals industry company and the data collection approach and how to calculate baseline values of KPIs.
In the next article I will explain how to read these results, estimate targets, calculate expected outcomes, and more.
I hope these thoughts were interested to Chemicals community and not only. Please share your feedback or thoughts in a comment and I’d be happy to answer.
You might also be interested to read other Chemicals industry related topics here.
Please follow my LinkedIn profile.
Cumprimentos, Sergey
- SAP Managed Tags:
- Chemicals
You must be a registered user to add a comment. If you've already registered, sign in. Otherwise, register and sign in.