


- SAP Community
- Groups
- Interest Groups
- Data and Analytics
- Blog Posts
- Unlocking the Power of Customer Data – SAP Custome...
Data and Analytics Blog Posts
Check out the latest blog posts in the Data & Analytics group, and contribute your own posts with insights, best practices, and unique perspectives.
Turn on suggestions
Auto-suggest helps you quickly narrow down your search results by suggesting possible matches as you type.
Showing results for
Associate
Options
- Subscribe to RSS Feed
- Mark as New
- Mark as Read
- Bookmark
- Subscribe
- Printer Friendly Page
- Report Inappropriate Content
a month ago
Overview
Upcoming feature Direct Data Access facilitates user access to data housed in the SAP Customer Data Platform (CDP). This includes external data storages and customer experience applications like SAP Emarsys Customer Engagement or SAP Analytics Cloud (SAC), achieved via Purpose Views within CPD. These views offer a relational perspective of profiles, activities, segments, and indicators based on processing purposes defined in the SAP CDP. By accessing these views, external applications gain a transparent access to customer data within the CDP. This paves the way for direct comparisons between current customer data and user activities with the application's data, leading to insightful findings, which can then be integrated back into the CDP. Consequently, both marketing systems and analytical tools stand to gain from a bidirectional data exchange with the CDP.
In this blog post, we will provide a comprehensive guide to integrate Datasphere within CDP via Direct Data Access, enabling SAP Analytics Cloud access to CDP data via its Datasphere integration support. Our objective is to provide you with a thorough understanding of this integration process and offer insights into the technology foundational to it.
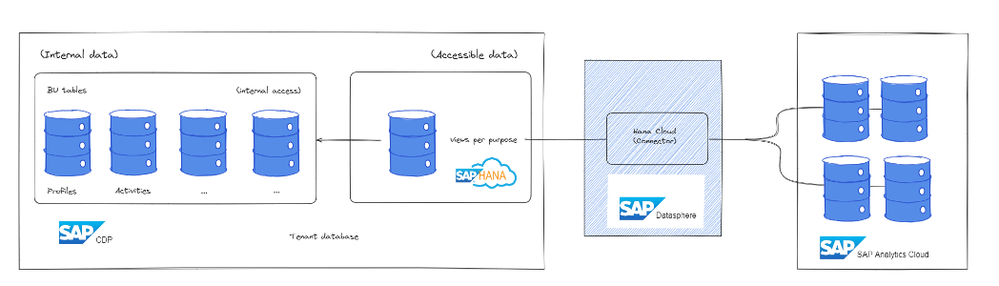
The following graphic summarizes the connection between CDP, SAP Datasphere and SAP Analytics Cloud:
The architecture design incorporates three core components.
- On the left, the Customer Data Platform comes integrated with its own internal data, accompanied by an accessible layer with the Purpose Views for data exposure: Direct Data Access.
- The central element of this framework is SAP Datasphere, in which you create views and remote tables to query the data, then adapt the data for multiple usages, including analytical modelling.
- On the right, SAP Analytics Cloud can leverage the Analytical Model defined in Datasphere to analyze and present the data, contributing to further insights.
Note: The process described below is correct as of early April 2024 - updates will be added as required.
SAP Customer Data Platform – First stage of integration
We will begin by organizing the data in the CDP for exchange with the SAP Analytics Cloud and setting the groundwork for Direct Data Access within the CDP.
Note: Direct Data Access requires an SAP Customer Data Platform add-on SKU – please contact your SAP contact to discuss its availability for your landscape.
1 – Preparation
To utilize Direct Data Access, the primary prerequisite is that this feature is enabled in your tenant. This activation becomes evident when the "Direct Data Access" tab emerges under "Activities" in the CDP menu:
Before advancing to the configuration stages, it is vital to identify the data set for Direct Access. This crucial step unfolds in the "Purpose" tab, marking the beginning of the integration journey. Within this tab, a data purpose is established in the CDP, addressing the pertinent data for Direct Data Access. The process occurs in the 'Purpose' sector of the CDP, where relevant attributes are selected to facilitate future access to the appropriate CDP data.
Emphasizing adherence to data protection guidelines and alignment with customer consent settings, this selection ensures regulatory compliance and safeguards data processing for a specific purpose, including Direct Data Access in linked target systems. The data defined under the "Purpose" menu is then transmitted to the corresponding destination (SAC via Datasphere). In the provided screenshot below, you can observe the chosen attributes intended to be accessible for Datasphere views.
2 – Configuration Direct Access for Datasphere within CPD
Moving to the Direct Data Access configuration in the CDP, you will find all views ready for sharing with an external application by selecting "Direct Data Access" in the CDP menu. The focus now shifts to the view previously identified within the purpose view, intended for the connection to Datasphere.
Within the Direct Data Access configuration, locate the relevant Purpose View. Enable and customize it based on your preferences at this stage.
The subsequent configuration overview within the CDP presents a side-by-side comparison of the data representation in the CDP (on the left) and the display that the Datasphere will eventually see (on the right). The header displays specifics such as the activation view, connection settings, and descriptive information regarding the purpose view. The details provided under the "Connection" field are particularly crucial for establishing connectivity with the Datasphere:
The user key, user secret, instance ID, and schema are vital details needed for subsequent connection within the Datasphere. These details have been pre-generated by the CDP for integration and can easily be copied with the "copy" button. Due to security precautions, the user secret is not visible on the user interface (UI) but can be copied to the clipboard using the "copy" button.
Note: The attribute chosen as the “identifier” (top left), will be added to Activity views as “cdpId” for easy joins back with the profile data.
In contrast to the "SAP Customer Data Platform" view (on the left) and the "External" view (on the right), data objects or arrays are notably absent in the External view. The view has been streamlined to a 'flat' structure wherein the type of attribute ("string", "date", "boolean", etc.) remains within the external data, but object hierarchies or array stacks are not conveyed yet.
Prior to transitioning to the Datasphere configuration, let us recap the significant information required for the setup:
- Full host with domain: Pair the Instance ID with the domain ".hanacloud.ondemand.com" (i.e., [Instance ID].hanacloud.ondemand.com).
- User key.
- Secret.
Armed with this information, we are now ready to configure the Datasphere part.
SAP Datasphere – Second stage of integration
Now that CDP data is exposed via the embedded HANA, it is possible to connect it to Datasphere as remote tables, directly accessing the data.
1 – Create the Connection
The next step involves accessing the "Connections" menu item on the left-hand side after logging into the SAP Datasphere Instance. From the list of connection types, select "SAP HANA," currently serving as the starting point for establishing the Direct Data Access connection to the CDP. For help, please check the official documentation SAP HANA Connections | SAP Help Portal.
In the next step, the parameters specified by the CDP from the previous chapter are required:
- in Host you enter the value Instance ID + the domain ".hanacloud.ondemand.com" – ex: [Instance ID].hanacloud.ondemand.com
- the port requires the value 443 due to the TLS connection.
- in "Password" the "Secret" from the previous CDP configuration is required
- in "User Name" enter the user key from the CDP configuration
- for "Data Access" select "Remote Only"
The configuration in the SAP Datasphere instance is completed with a name and a description of the connection. It is important that the configuration is given a technical name (no spaces or special characters). A final check of the connection should result in a functioning Direct Data Access connection to the CDP.
Once you have set up the connection, you can go to the "Data Builder" Menu Item in the Data Sphere Instance. Here we generate data artifacts by integrating various views and remote tables into our CDP dataset. Utilize the Data Builder tool (Modeling Data in the Data Builder | SAP Help Portal) to efficiently model and manage data structures.
2 – Create Graphical Views
Following this, begin the creation of graphical views, SQL views, or analytical models.
Navigate to the "Sources" section in the Data Builder, select the previously configured connection, and access the views associated with the configured Purpose Views in CDP. Please refer to the CDP Direct Data Access screen to determine which view represent profiles and activities.
Utilize the SAP Datasphere's graphical view editor to efficiently prepare and transform data as needed. Leverage functionalities such as adding calculated columns, applying filters, and renaming or selecting relevant columns.
This can also be done in several steps, for instance creating dedicated Graphical Views for each CDP Purpose Views to progressively clean, rename or transform them for the next step. This can potentially minimise impacts of change of the source data set structure on the final, exposed Graphical View.
Multiple CDP Purpose Views can also be joined to provide a comprehensive view of Tickets and Profiles, for instance.
3 – Prepare the Analytical Model
In the next step you define a view for your Analytics Model. Select “View” in the upper Menu Options and choose your imported Table. In the View Properties, create a Business Name, a Technical Name. Choose a Semantic Usage of Fact to signify that your entity encompasses numerical measures eligible for analysis.
Next, enable both “Expose for Consumption” as well as “Run in Analytical Mode”. The former signals that the data is accessible for consumption in SAP Analytics Cloud, while the latter can enhance view performance, especially during union operations. Note that "Run in Analytical Mode" is only accessible when "Expose for Consumption" is enabled.
Please assign the best measures and dimensions to prepare for the Analytical Model – for instance focusing on Order amounts for revenue-centric analytics by dragging them from the attribute list.
4 – Configure & test the Analytical Model
In the final step of this section, create an Analytic Model based on this view effortlessly by selecting the "Create Analytic Model" option within the view properties.
Once in the Analytical View editor, measures and dimensions can be adjusted to suit the analytical goals.
Associated dimensions can also be brought in, to enrich the dataset further, for instance bringing in at this stage geographical data, time dimensions or a product catalogue.
Once ready, you can utilize the preview feature in the Analytic Model to confirm that the data appears as anticipated. If necessary, leverage this validation to incorporate additional logic into either the view or the Analytic Model using the steps described above.
Conclude the process by clicking "Save" and "Deploy".
SAP Analytics Cloud (SAC) – Third stage of integration
To visualize the data, switch to SAP Analytics Cloud. If not already done, establish a live connection from SAP Analytics Cloud to SAP Datasphere (also see also Live Data Connections to SAP Datasphere | SAP Help Portal)
Navigate to Connections (Add Connection) from the side navigation. In the “Select a data” source dialog, expand “Connect to Live Data” and opt for SAP HANA. Provide a name and description for your connection in the dialog. Afterward, follow these steps:
- Add the URL of the SAP Analytics Cloud tenant as a Trusted Origin in SAP Datasphere (go to System --> Administration --> App Integration --> “+ Add a Trusted Origin”).
- Create a new live connection to SAP Datasphere in the connection management of SAP Analytics Cloud.
Supply the name, description, and the URL of your SAP Datasphere tenant. The HTTPS port is consistently set to 443. Confirm the creation with an "OK," and if no errors are encountered, you are ready to proceed.
Now, initiate the data visualization process. Head to the "Stories" app in SAP Analytics Cloud and generate a new story using the "Responsive" layout, ensuring compatibility with the SAP Analytics Cloud mobile app:
Choose to utilize the Optimized Design Experience for an enhanced and contemporary feature set. This selection ensures that you can leverage the most current and advanced capabilities available in the system, providing you with an optimized and efficient design environment.
Add a new chart by dragging and dropping the "Chart" widget from the left-hand selection onto the canvas of your story:
As visualizations rely on data, SAP Analytics Cloud now prompts you to choose a data source. Locate the live connection to SAP Datasphere on the left-hand side and click on it. This action reveals a list of your spaces from the respective SAP Datasphere tenant. Choose the necessary space, and subsequently, opt for the newly created Analytic Model:
Customize the chart by defining the measures and dimensions for visualization and selecting the preferred chart type. This enables real-time data processing from SAP Datasphere, allowing you to instantly observe the results.
Feel free to design your Story with all the features offered by SAP Analytics Cloud. For more detailed information, refer to the Data Visualization documentation for SAP Analytics Cloud.
Here are a few examples, leveraging both CDP activities, segments, and external data sets to represent revenue and support insights.
 |  |
 |  |
Summary
This guide outlines the integration of SAP Datasphere with the Customer Data Platform (CDP) through Direct Data Access, facilitating user access to data, including external sources like SAP Emarsys Customer Engagement and SAP Analytics Cloud (SAC).
The integration comprises three core components: SAP Customer Data Platform, SAP Datasphere, and SAP Analytics Cloud. It outlines a step-by-step process, commencing with organizing data in the CDP for exchange with SAP Analytics Cloud. Key steps involve preparing the data set, enabling Direct Data Access in the CDP, and configuring Direct Data Access for Datasphere in CDP.
The SAP Datasphere stage involves establishing connections and generating data artifacts using the Data Builder tool. The integration concludes in SAP Analytics Cloud, guiding users through live connections and data visualization, emphasizing the Optimized Design Experience.
Additional information:
- (by SAP) Introducing the Analytic Model in SAP Datasphere | SAP Blogs
- (not SAP) The SAP Datasphere Analytic Model | SAP Blogs
- (by SAP) Create Consumption Model via Business Builder – here you will need first to create Fact in Business Builder and then create Model. More info Getting started with the Business Builder | SAP Blogs
- (not SAP) Request: Showcase from remote tables in Datasphere to consumption in Analytics Cloud | SAP Community
- SAP Managed Tags:
- SAP Analytics Cloud,
- SAP Datasphere,
- SAP Customer Data Platform
Labels:
You must be a registered user to add a comment. If you've already registered, sign in. Otherwise, register and sign in.
Labels in this area

