

- SAP Community
- Products and Technology
- Financial Management
- Financial Management Blogs by SAP
- GRC Tuesdays: Modelling the Risk Landscape with Mo...
Financial Management Blogs by SAP
Get financial management insights from blog posts by SAP experts. Find and share tips on how to increase efficiency, reduce risk, and optimize working capital.
Turn on suggestions
Auto-suggest helps you quickly narrow down your search results by suggesting possible matches as you type.
Showing results for
Product and Topic Expert
Options
- Subscribe to RSS Feed
- Mark as New
- Mark as Read
- Bookmark
- Subscribe
- Printer Friendly Page
- Report Inappropriate Content
06-07-2022
1:24 PM
During World War II, a group of scientists were working on the secretive Manhattan Project at the Los Alamos Laboratory. Within these scientists were Stanislaw Ulam and John von Neumann who developed the Monte Carlo method as part of their work relating to the development of nuclear weapons.
As for most contributions to the overall Manhattan Project, their work was also highly confidential and therefore needed a code name. The story goes that the name “Monte Carlo” was proposed by one of their colleagues as a reference to the casinos in Monaco where Stanislaw Ulam’s uncle would gamble – and allegedly loose large sums. Another story goes that this is because the Monte Carlo method is based on random chance, hence perfectly represented by the roulettes in said casinos.
Regardless of the origin, as per Britannica’s definition, Monte Carlo method is a “statistical method of understanding complex physical or mathematical systems by using randomly generated numbers as input into those systems to generate a range of solutions”.
If, like me, you are not a nuclear physicist, you may think that there is no chance in the world that you will ever use this approach… Well, if you are dealing with risks – and everyone really does – then this method might be very relevant.
An incident rarely (never?) happens on its own. And its consequences are both direct and indirect. As a result, a great deal of effort in risk management is put in recreating risk chains (possible event > possible causes > possible consequences) to get as close as possible to the understanding of the overall exposure.
To do so, risk aggregation has been historically used as the go to approach. In this method, one would combine the aggregated outcome of all associated risks – from same categories or same organizations for instance.
If this approach is of course valid, it usually leads to a simple aggregation where risks are grouped and a potential value is determined by applying an average, minimum, maximum, or sum of all impacts. This value is then reported back and documented on the top risk of the group and used as the data point.
Statistical risk scenario – including Monte Carlo approach – differ in that they introduce many more parameters and eliminate linear risk documentations by leveraging risk interdependencies instead and enabling the calculation of the outcome based on documented assumptions. As a result, the results are usually much more accurate, as well as all encompassing.
Why would you use Monte Carlo?
The objective of a Monte-Carlo simulation in most Enterprise Risk Management software solutions – including in SAP Risk Management, is to display the aggregated risk impact with the best case, average case and worst case scenario.
Once you run a Monte Carlo simulation, you can then compare its results against your risk tolerance. If the aggregated financial impact is not acceptable, then you can decide to enhance further your mitigation strategy. Including a potential transfer to a third party as we will discuss further.
Let’s take an example.
Assuming your company is operating an asset intensive sector where you have a risk of “Damaged infrastructure”, surely this risk won’t occur on its own. It could trigger many other risks including safety incidents, service interruptions, complete shutdown, etc.
Using a Monte Carlo simulation, the company would be able to understand the complete aggregated financial exposure should the asset be damaged.
Depending on the risk profile of the company, they might opt for:
- Best case scenario if they are risk takers
- Worst case if they are risk averse
- Average is they are risk neutral
If the selected scenario is not acceptable to the decision makers, then they can decide to trigger a proactive maintenance for instance to reduce the likelihood of occurrence, or purchase an insurance policy to transfer the risk and its outcomes to offset the financial impact for instance.
What about optimizing insurance coverage?
Talking about counterbalancing the financial impact, oftentimes risk departments mention that they have difficulties in optimizing their insurance coverage because they don't have enough quantitative exposure information. As a result, they rely on external loss database or in their broker expertise to set the adequate level.
A Monte Carlo approach will help them in calculating the potential exposure for each impact in their given risk context.
They can then compare these values with their insurance coverage to see if they are under-covering, over-covering or right on target. They can then decide to reduce their insurance level, keep it is as, purchase a new one, etc. Hence truly optimising their investment.
Selecting the right parameters for a successful simulation
As for any mathematical simulation, different assumption methods will suit different contexts and will be the key to success. This is not only based on the nature of the risk – its predictability for instance, but also on the level of data and knowledge the organization already has on past risk occurrences (i.e.: the incidents).

Illustration of severity distributions in SAP Risk Management
If you have a risk that has already occurred many times and that you have a list of recorded incidents associated to it, you will be able to say with quite some confidence that:
- In 10% of the cases, it would result in a 600,000 EUR loss
- In 40% of the cases, it would climb to 800,000 EUR
- In 30% of the cases, it would be of 1,000,000 EUR
- And finally, in the last 20% extreme cases it could even reach 1,200,000 EUR.
Here you would use a “Discrete” distribution as per the illustration with 4 bars charts above.
In another case, the risk being analysed might also be well defined (i.e.: damage to a company vehicle) and here, you might know what the minimum impact is (the minimum price for a repair) and you might know what its maximum impact would be (actual cost of replacing the vehicle).
Here, you could decide to use a “Continuous” distribution.
As you can see, it’s not a one size fits all and this is why most simulations offer various severity distribution models including the ones mentioned here, or a Normal distribution illustrated by the bell curve in the image above where you set the mean value and the standard deviation.
Once this is set, another step is to define the Frequency Distribution. In short, this defines how many times the risk could occur within a “run”. A “run” here being an occurrence of the simulation.
For each run the system will try to generate a loss for the risk and related impacts and record the outcome.
It is usually the role of the actuaries or the specialists in the insurance department to define the best fitting assumption model for each risk and each impact as they are the ones who have the information on the predictability and past occurrences of a risk.
Like many simulation tools, SAP Risk Management then summarizes the outcomes in a graph:
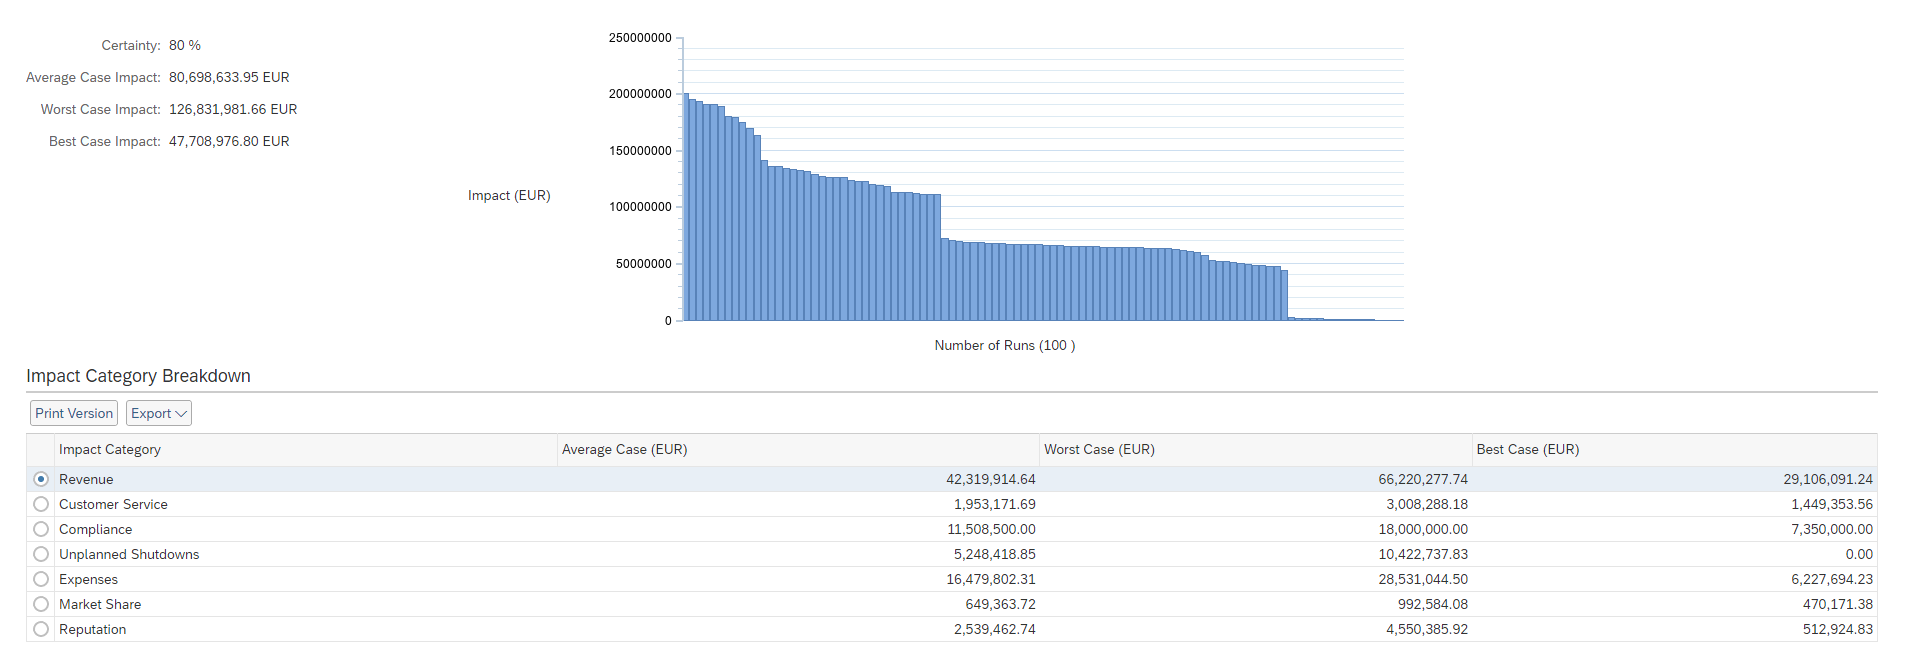
Illustration of the results of a Monte Carlo simulation in SAP Risk Management
The graph is rather simple to read as it displays the aggregated impact results per run organized from the worst to best case.
What would be interesting for an actuary would be to view the “consistency” of the graph. If the slope regularly decreases from worst to best case, then the model is usually considered a good fit as it is consistent. If on the other hand there are many sudden “drops”, then the assumption model might not be optimum and the specialist would go back to the parameters and review them.
By structuring risks in a chain and running a Monte Carlo simulation, stakeholders can determine more precisely what the possible risk outcome could be. This would in turn enable them to make a much more informed decision, rather than just relying on a hunch.
What about you, does your company use simulations to get a better understanding of the overall risk exposure? I look forward to reading your thoughts and comments either on this blog or on Twitter @TFrenehard
- SAP Managed Tags:
- Governance, Risk, Compliance (GRC), and Cybersecurity
Labels:
You must be a registered user to add a comment. If you've already registered, sign in. Otherwise, register and sign in.
Labels in this area
-
Business Trends
145 -
Business Trends
17 -
Event Information
35 -
Event Information
9 -
Expert Insights
8 -
Expert Insights
31 -
Life at SAP
48 -
Product Updates
521 -
Product Updates
67 -
Technology Updates
196 -
Technology Updates
11
Related Content
- GRC Tuesdays: What Risks to Look Out for in 2024 in Financial Management Blogs by SAP
- Security Safeguards for SAP Cloud Services: Addressing the Threats to Cloud Computing in Financial Management Blogs by SAP
- Think Twice: The Pitfalls of Outsourcing SAP GRC Reporting to External Analytics Tools in Financial Management Blogs by Members
- GRC Tuesdays: Hidden Gems - Context-Based Risk Management in Financial Management Blogs by SAP
- GRC Tuesdays: Announcing SAP’s plans for a next generation Governance, Risk, and Compliance Platform: SAP GRC edition for SAP HANA in Financial Management Blogs by SAP
Top kudoed authors
| User | Count |
|---|---|
| 1 | |
| 1 | |
| 1 | |
| 1 | |
| 1 | |
| 1 |