One way to sustain business profitability is to produce, purchase and sell products of high quality so that customers or in-house production can rely on it. Therefore, quality managers want to check the rejection rate of their inspections to identify the improvement potential for example for the affected product or the supplier.
The KPI 'Rejection Rate in %' is now available in standard. It sets the number of rejected inspections in relation to all inspections.
The tile in the overview page could look like the following showing the Month to Date value in the upper section and here with more values for months of the full year.

With a click on the Tile, you get more details showing a chart view. The target value is left empty because it differs from company to company. You can enhance to your needs.

With changing the view, you can analyze further: It shows you the Year/Month and inspection type along with the acceptance quota the average quality score and the total number of inspections.
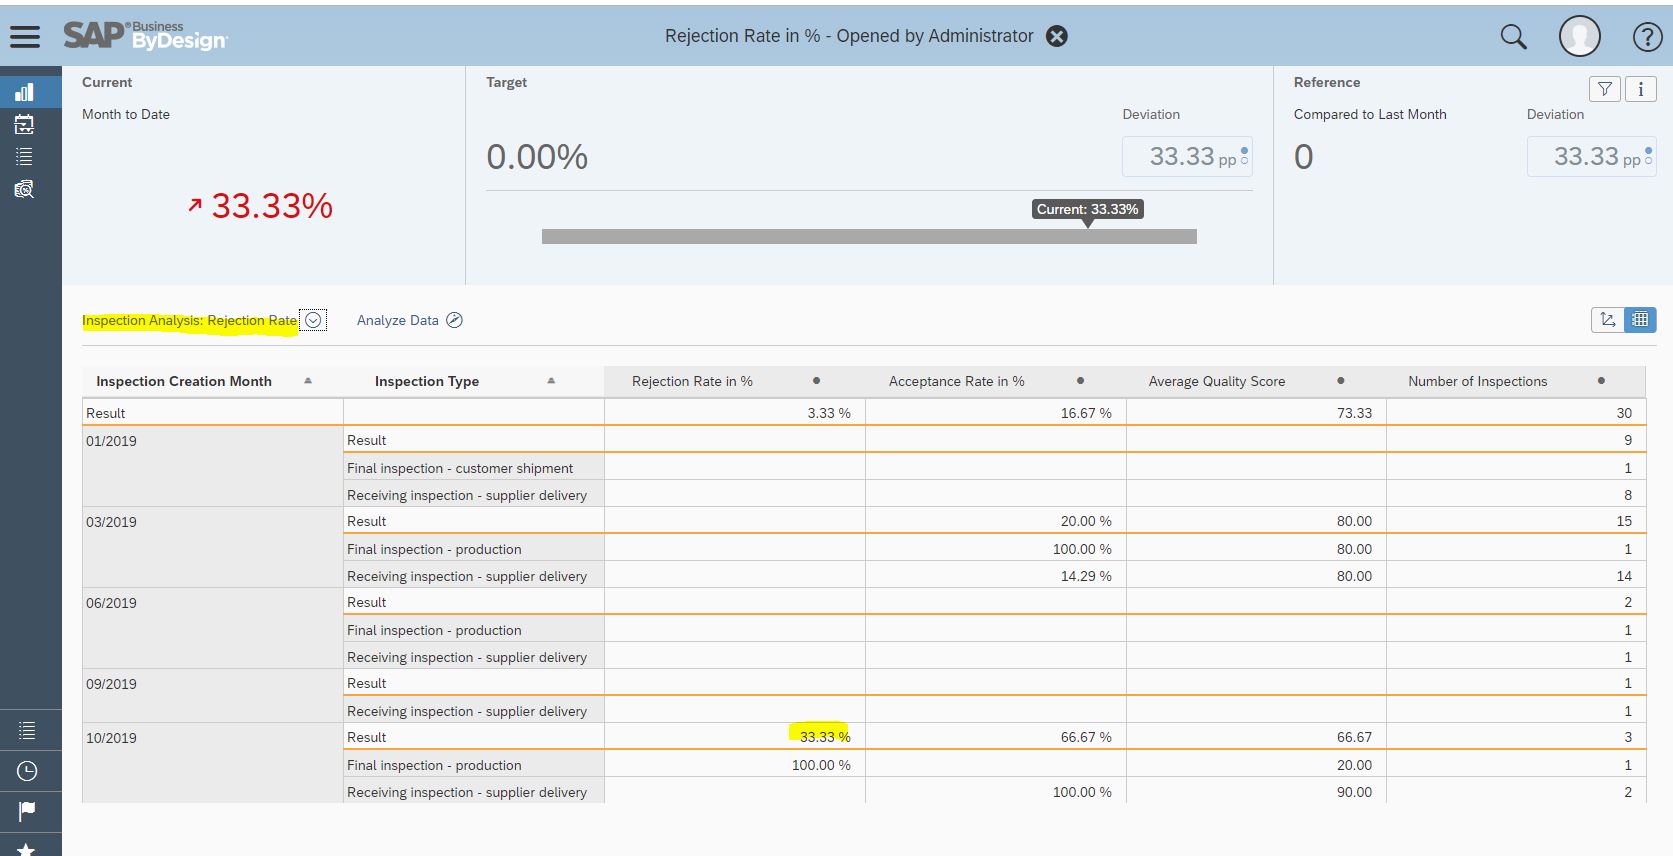
With the Analyze Data Button, you can display the data under many more aspects, e.g. of the product category or the supplier - just to mention some.
Following some background info of the KPI ‘Rejection Quota’:
The KPI is based on the ‘Inspection Analysis‘ standard report (PLMQINU01_Q0002) with the key figure Rejection Quota which you can find in the “Quality Control” work center for quality engineers. In order to adapt the report views and selections for your needs you can do the changes in the “Business Analytics” work center in the Design Reports view.

In the Business Analytics work center under the Design KPI’s view, you can also create and change KPIs. In the following can you see the settings for the Rejection Rate in % KPI:
a.) General Tab: Here you use the views and selections from the newly created report such as the selection for the current month to today’s date.

b.) Values and Thresholds:

Below an example how it could look like: we used fixed values for target and reference values but you can also get values from the report.
The target is set here to 0,05 (5 %), a warning is displayed over 0,055 (5,5 %) and alerts beyond 0,075 (7,5 %).

c.) Additional Contexts: These are additional report views for example to display also a table view in the KPI.

d) Filter: If you want to use KPI Filters for variants to create KPI variants, the site is a proposal.
This blog post is part of a series of blog posts introducing KPIs for process monitoring and optimization purposes
Process Monitoring and Optimization KPI’s.
