
- SAP Community
- Products and Technology
- Technology
- Technology Blogs by Members
- Sentiment Analysis using SAP Analytics Cloud + Goo...
Technology Blogs by Members
Explore a vibrant mix of technical expertise, industry insights, and tech buzz in member blogs covering SAP products, technology, and events. Get in the mix!
Turn on suggestions
Auto-suggest helps you quickly narrow down your search results by suggesting possible matches as you type.
Showing results for
eaksiri
Explorer
Options
- Subscribe to RSS Feed
- Mark as New
- Mark as Read
- Bookmark
- Subscribe
- Printer Friendly Page
- Report Inappropriate Content
11-21-2018
3:51 PM
Introduction
SAP Analytics Cloud (SAC) is such a powerful tool for analytics and creates compelling data visualizations. And I intend to write this blog for studying if I can add the sentiment analysis capability through the pre-trained machine learning models from Google Cloud Natural Language to SAC.
Assuming you have an online ticketing system for customer support. After some time, you want to measure the quality of service that you have been providing through customer’s feedback. So we will use the sentiment analysis to determine the overall attitude (either positive or negative) based on the feedback provided.
Ultimately the ticket data will be enriched with the sentiment score to define on how well is your support.
Table of Contents
- Prerequisites
- Process Flow
- Enable Cloud Natural Language API on Google Cloud Platform
- Build the integration scenario on SAP Cloud Integration
- Create a dashboard on SAP Analytics Cloud
- Conclusion
Prerequisites
- SAP Analytics Cloud account
- SAP Cloud Integration account
- Google Cloud Platform account
Process Flow

The dashboard gets data feed from SAP Cloud Integration (SCI) via OData. SCI then gets feedback data from the ticketing system with the REST API. After that, the sentiment score is determined based on individual sentence that a customer puts in the ticket response using Google Cloud Natural Language API.
Finally the processed data will be sent back to SAC to generate the dashboard.
Enable Cloud Natural Language API on Google Cloud Platform
Create a new project
Login to Google Cloud Platform Console. Then create a new project by going to Manage Resources Page and click on CREATE PROJECT.

Put a project name and click CREATE. Also make sure that you enable billing for your account.

Enable the Cloud Natural Language API
Go to the Dashboard menu and click on APIs & Services. Then click on Enable APIS AND SERVICES.

Create an API Key
Go to the Credentials section of APIs & services. Then click Create credentials drop-down and select API Key.

The pop-up window will be shown with the generated API key. Copy the API key and save it.

Testing: Call the API to perform Sentiment Analysis
You may have to check if your configuration is correct. I usually use Postman for testing the REST APIs.
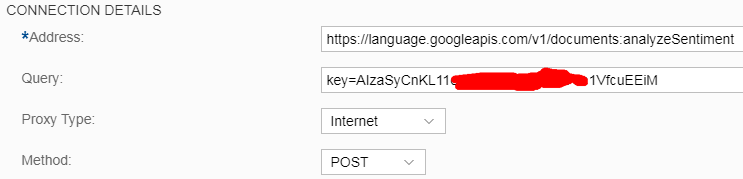
We use the following endpoint to send the request along with the API key from the above step to the API.
The Natural Language API is a REST API consisting of JSON request and response. A simple JSON request is as follows:
{

 "document": {

  "content": "Very good support.",

  "type": "PLAIN_TEXT"

 },

 "encodingType": "UTF8"

}
Document contains the data for this request, which consists of the following fields:
- content – contains the text to evaluate
- type – document type (HTML or PLAIN_TEXT)
- encodingType – character encoding
Let’s try it on Postman.

You can get the sentiment score based on the provided sentence. The Sentiment score ranges from -1 (very bad) to +1 (very good). From the above response, the sentiment score is 0.8 which means quite good.
Build the integration scenario on SAP Cloud Integration

(1) OData Sender Adapter
The OData sender adapter is to be triggered from SAP Analytics Cloud with the following entity set structure.
| Entity Set | Entity | Description |
| ContentSet | SurveyID | Survey ID |
| Content | Feedback data from the users | |
| Group | Group of support team | |
| SentimentScore | Sentiment score ranges from -1 to +1 |
(2) Process Call: Support Ticket API
This step is to retrieve feedback data from the support ticketing system (in my case, I use Freshdesk as an example). I’m not going to focus the details here because you may use different ticket tools such as Jira or Salesforce. Anyway, most of the ticketing systems offer the data access through REST API. So you can use your own and easily follow through the rest of the blog.
Sample XML data from the Freshdesk API:
   <element>

      <agent_id/>

      <feedback>Very good support</feedback>

      <group_id>Customer Support</group_id>

      <id>44000002882</id>

      <survey_id>44000001495</survey_id>

      <ticket_id>5</ticket_id>

      <updated_at>2018-11-15T06:33:07Z</updated_at>

      <user_id>44000067346</user_id>

   </element>
(3) Iterating Splitter
To split multiple feedback data into a single element because the Google Cloud Natural Language Processing (NLP) API can only receive only one input at a time.

(4) Content Modifier: Save feedback data for further processing
We will use the split feedback data (from the prior step) later to be combined with the returned sentiment score taken from the Google NLP API. The feedback data is saved in the property called FeedbackData.

(5) Message Mapping: Construct a request for sentiment analysis API
The Google Cloud NLP API’ sentiment analysis is using the following JSON request.
"document":{

  "content": <TEXT>,

  "type":"PLAIN_TEXT"

}
So we need to map the incoming feedback data to the request data in the XML format first. Then convert it to the JSON format in the later step.

(6) XML To JSON Converter
Convert the XML data (from the prior step) and suppress the JSON root element.

(7) Request Reply: HTTP Request
Make a call to the sentiment analysis API.
(8) Groovy script: Add a root node in JSON
Since HCI doesn’t support multiple root members processing for the JSON to XML converter. It must contain exactly one member. So we have to add a root node in the JSON data.
import com.sap.gateway.ip.core.customdev.util.Message;

import java.util.HashMap;

import groovy.json.*


def Message processData(Message message) {

    //Body

    def jsonOP = message.getBody(String.class);

    jsonOP=jsonOP.toString()


    def json_to_str=jsonOP.substring(1, jsonOP.length()- 1);

    json_to_str="{\"Root\": {"+json_to_str+"}"


    message.setBody(json_to_str);

    return message;

}
(9) JSON To XML Converter
To convert the returned sentiment data in the JSON format to the XML format for further processing.
(10) Filter: Node documentSentiment
As we focus only the sentiment score, so we’ll filter the rest of the message out.


(11) Content Modifier: Combine feedback data with sentiment score
This step is to combine feedback data (from the step 4) and the returned sentiment score (from the step 10).

<root>

  <document>

    <documentSentiment>

      <magnitude>0.9</magnitude>

      <score>0.9</score>

    </documentSentiment>

    <element>

      <agent_id null="true"/>

      <created_at>2018-11-15T06:33:07Z</created_at>

      <feedback>Very good support</feedback>

      <group_id>Customer Support</group_id>

      <id>44000002882</id>

      <ratings>

        <default_question>103</default_question>

      </ratings>

      <survey_id>44000001495</survey_id>

      <ticket_id>5</ticket_id>

      <updated_at>2018-11-15T06:33:07Z</updated_at>

      <user_id>44000067346</user_id>

    </element>

  </document>

</root>
(12) Gather: Collect data among the iteration steps

(13) Filter: Remove Multimap node
To remove the unnecessary Multimap node from the Gather step.


(14) Groovy script: Add a root node in JSON
It’s as same as the step 8.
(15) Message Mapping: Construct the OData output
Almost there! Map the outcome to the sender’s OData structure.

(16) Last Step
Once the end message is reached, the processed data will automatically be sent back to the sender.
Last but not least, you need the OData endpoint to be called from SAP Analytics Cloud. You can get it from Manage Integration Content as highlighted.

Create a dashboard on SAP Analytics Cloud
Create a connection
Login to SAP Analytics Cloud. Then open the dashboard menu and select Connection.

After that click the plus button and select Import Data Connection --> OData Services.

Put the connection name and the data service URL with the OData endpoint from the prior section.

Create a story
Open the dashboard menu again, and select Create --> Story.

Select the Dashboard template.

Now we going to use data from our integration scenario. Select the Data from the top-left panel.

Choose Data acquired from a datasource.

Pick OData Services as a datasource.

Choose the connection that you created from the earlier step.

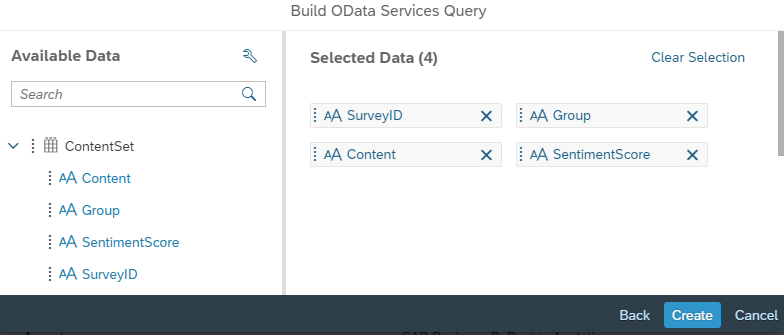
Next, name your query and select the query set (it’s your entity set that you use in the SCI’s OData sender step).

You can then select the data you are interested in to build a query.
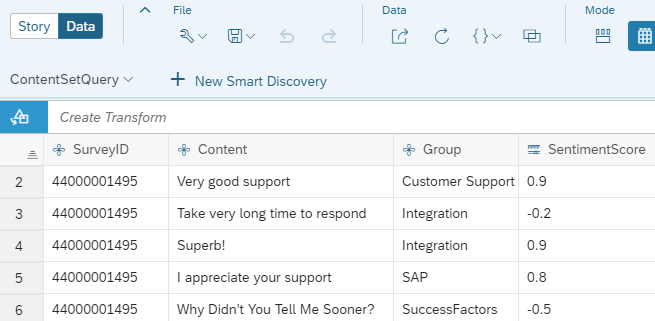
After your query is created, data will be retrieved from your integration scenario via OData and gets previewed in the subsequent screen.
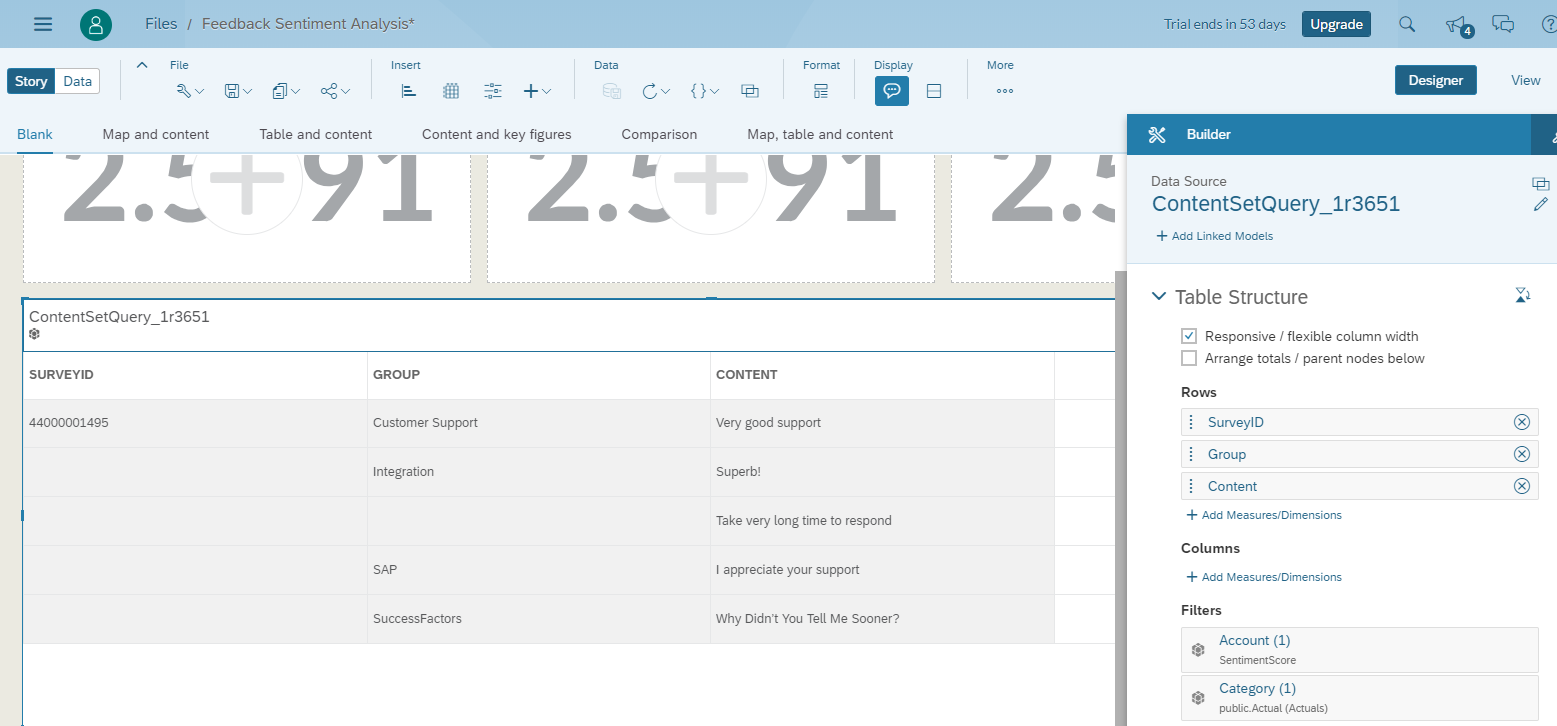
Now we are going to build a dashboard. Select Story from the top-left panel. In this blog, I use the predefined layout Table and content. Or you can select another layout as you wish and then click Apply.

The layout Table and content is composed of 3 indicators on the top and one table below.

I use the table to display the raw data I get from the integration content. There are 3 rows selected—SurveyID, Group, and Content—considering as dimensions. And the SentimentScore is considered as a measurement.
The first indicator (on the top-left corner) I’ll use it for presenting the average sentiment score based on multiple supporting tickets.
The indicator I use is Numeric Point. To calculate the score average, select Create Calculation under Primary Values.

In Calculation Editor, choose the operation AVERAGE with the measurement SentimentScore.

The average sentiment score will then be shown on your dashboard.

To make it easier to determine whether your received feedback is positive or negative, we are going to colorize the indicator, says green for positive and red for negative.
Select Add Thresholds under Color. Define the number range between 0 and 1 for the positive feedback and the negative feedback will be ranged between -1 to 0.

Click Apply and check out the real-time result.

Now I’m going to build a second indicator for checking the feedback from different support groups—e.g. Customer Support, Integration, SAP, and SuccessFactors.
Select the comparison Bar/Column. Then select the measurement Sentiment with the dimension Group. You can also try to colorize the indicator as you like.

Here you go, you get the average feedback score as well as the sentiment score for each support group.

You can play around with the last indicator as you wish.

Conclusion
SAP Analytics Cloud also has a build-in machine learning feature called Smart Discovery. Its feature is to find correlations among your dataset and uncover valuable information. But it cannot identify emotional opinion within the text or sentence to determine where it’s positive or negative.
Perhaps I’m using a trial account so that feature is not available for me. Anyway I think it’s still exciting and fun to play around with other options available in the market, don’t you think?
I hope this blog is helpful in one way or another.
- SAP Managed Tags:
- SAP Analytics Cloud,
- SAP Integration Suite,
- Cloud Integration
1 Comment
You must be a registered user to add a comment. If you've already registered, sign in. Otherwise, register and sign in.
Labels in this area
-
"automatische backups"
1 -
"regelmäßige sicherung"
1 -
"TypeScript" "Development" "FeedBack"
1 -
505 Technology Updates 53
1 -
ABAP
14 -
ABAP API
1 -
ABAP CDS Views
2 -
ABAP CDS Views - BW Extraction
1 -
ABAP CDS Views - CDC (Change Data Capture)
1 -
ABAP class
2 -
ABAP Cloud
2 -
ABAP Development
5 -
ABAP in Eclipse
1 -
ABAP Platform Trial
1 -
ABAP Programming
2 -
abap technical
1 -
absl
2 -
access data from SAP Datasphere directly from Snowflake
1 -
Access data from SAP datasphere to Qliksense
1 -
Accrual
1 -
action
1 -
adapter modules
1 -
Addon
1 -
Adobe Document Services
1 -
ADS
1 -
ADS Config
1 -
ADS with ABAP
1 -
ADS with Java
1 -
ADT
2 -
Advance Shipping and Receiving
1 -
Advanced Event Mesh
3 -
AEM
1 -
AI
7 -
AI Launchpad
1 -
AI Projects
1 -
AIML
9 -
Alert in Sap analytical cloud
1 -
Amazon S3
1 -
Analytical Dataset
1 -
Analytical Model
1 -
Analytics
1 -
Analyze Workload Data
1 -
annotations
1 -
API
1 -
API and Integration
3 -
API Call
2 -
API security
1 -
Application Architecture
1 -
Application Development
5 -
Application Development for SAP HANA Cloud
3 -
Applications and Business Processes (AP)
1 -
Artificial Intelligence
1 -
Artificial Intelligence (AI)
5 -
Artificial Intelligence (AI) 1 Business Trends 363 Business Trends 8 Digital Transformation with Cloud ERP (DT) 1 Event Information 462 Event Information 15 Expert Insights 114 Expert Insights 76 Life at SAP 418 Life at SAP 1 Product Updates 4
1 -
Artificial Intelligence (AI) blockchain Data & Analytics
1 -
Artificial Intelligence (AI) blockchain Data & Analytics Intelligent Enterprise
1 -
Artificial Intelligence (AI) blockchain Data & Analytics Intelligent Enterprise Oil Gas IoT Exploration Production
1 -
Artificial Intelligence (AI) blockchain Data & Analytics Intelligent Enterprise sustainability responsibility esg social compliance cybersecurity risk
1 -
ASE
1 -
ASR
2 -
ASUG
1 -
Attachments
1 -
Authorisations
1 -
Automating Processes
1 -
Automation
2 -
aws
2 -
Azure
1 -
Azure AI Studio
1 -
Azure API Center
1 -
Azure API Management
1 -
B2B Integration
1 -
Backorder Processing
1 -
Backup
1 -
Backup and Recovery
1 -
Backup schedule
1 -
BADI_MATERIAL_CHECK error message
1 -
Bank
1 -
BAS
1 -
basis
2 -
Basis Monitoring & Tcodes with Key notes
2 -
Batch Management
1 -
BDC
1 -
Best Practice
1 -
bitcoin
1 -
Blockchain
3 -
bodl
1 -
BOP in aATP
1 -
BOP Segments
1 -
BOP Strategies
1 -
BOP Variant
1 -
BPC
1 -
BPC LIVE
1 -
BTP
12 -
BTP Destination
2 -
Business AI
1 -
Business and IT Integration
1 -
Business application stu
1 -
Business Application Studio
1 -
Business Architecture
1 -
Business Communication Services
1 -
Business Continuity
1 -
Business Data Fabric
3 -
Business Partner
12 -
Business Partner Master Data
10 -
Business Technology Platform
2 -
Business Trends
4 -
CA
1 -
calculation view
1 -
CAP
4 -
Capgemini
1 -
CAPM
1 -
Catalyst for Efficiency: Revolutionizing SAP Integration Suite with Artificial Intelligence (AI) and
1 -
CCMS
2 -
CDQ
12 -
CDS
2 -
Cental Finance
1 -
Certificates
1 -
CFL
1 -
Change Management
1 -
chatbot
1 -
chatgpt
3 -
CL_SALV_TABLE
2 -
Class Runner
1 -
Classrunner
1 -
Cloud ALM Monitoring
1 -
Cloud ALM Operations
1 -
cloud connector
1 -
Cloud Extensibility
1 -
Cloud Foundry
4 -
Cloud Integration
6 -
Cloud Platform Integration
2 -
cloudalm
1 -
communication
1 -
Compensation Information Management
1 -
Compensation Management
1 -
Compliance
1 -
Compound Employee API
1 -
Configuration
1 -
Connectors
1 -
Consolidation Extension for SAP Analytics Cloud
2 -
Control Indicators.
1 -
Controller-Service-Repository pattern
1 -
Conversion
1 -
Cosine similarity
1 -
cryptocurrency
1 -
CSI
1 -
ctms
1 -
Custom chatbot
3 -
Custom Destination Service
1 -
custom fields
1 -
Customer Experience
1 -
Customer Journey
1 -
Customizing
1 -
cyber security
3 -
cybersecurity
1 -
Data
1 -
Data & Analytics
1 -
Data Aging
1 -
Data Analytics
2 -
Data and Analytics (DA)
1 -
Data Archiving
1 -
Data Back-up
1 -
Data Flow
1 -
Data Governance
5 -
Data Integration
2 -
Data Quality
12 -
Data Quality Management
12 -
Data Synchronization
1 -
data transfer
1 -
Data Unleashed
1 -
Data Value
8 -
database tables
1 -
Datasphere
3 -
datenbanksicherung
1 -
dba cockpit
1 -
dbacockpit
1 -
Debugging
2 -
Defender
1 -
Delimiting Pay Components
1 -
Delta Integrations
1 -
Destination
3 -
Destination Service
1 -
Developer extensibility
1 -
Developing with SAP Integration Suite
1 -
Devops
1 -
digital transformation
1 -
Documentation
1 -
Dot Product
1 -
DQM
1 -
dump database
1 -
dump transaction
1 -
e-Invoice
1 -
E4H Conversion
1 -
Eclipse ADT ABAP Development Tools
2 -
edoc
1 -
edocument
1 -
ELA
1 -
Embedded Consolidation
1 -
Embedding
1 -
Embeddings
1 -
Employee Central
1 -
Employee Central Payroll
1 -
Employee Central Time Off
1 -
Employee Information
1 -
Employee Rehires
1 -
Enable Now
1 -
Enable now manager
1 -
endpoint
1 -
Enhancement Request
1 -
Enterprise Architecture
1 -
ESLint
1 -
ETL Business Analytics with SAP Signavio
1 -
Euclidean distance
1 -
Event Dates
1 -
Event Driven Architecture
1 -
Event Mesh
2 -
Event Reason
1 -
EventBasedIntegration
1 -
EWM
1 -
EWM Outbound configuration
1 -
EWM-TM-Integration
1 -
Existing Event Changes
1 -
Expand
1 -
Expert
2 -
Expert Insights
2 -
Exploits
1 -
Fiori
14 -
Fiori Elements
2 -
Fiori SAPUI5
12 -
Flask
1 -
Full Stack
8 -
Funds Management
1 -
General
1 -
General Splitter
1 -
Generative AI
1 -
Getting Started
1 -
GitHub
8 -
Grants Management
1 -
GraphQL
1 -
groovy
1 -
GTP
1 -
HANA
6 -
HANA Cloud
2 -
Hana Cloud Database Integration
2 -
HANA DB
2 -
HANA XS Advanced
1 -
Historical Events
1 -
home labs
1 -
HowTo
1 -
HR Data Management
1 -
html5
8 -
HTML5 Application
1 -
Identity cards validation
1 -
idm
1 -
Implementation
1 -
input parameter
1 -
instant payments
1 -
Integration
3 -
Integration Advisor
1 -
Integration Architecture
1 -
Integration Center
1 -
Integration Suite
1 -
intelligent enterprise
1 -
iot
1 -
Java
1 -
job
1 -
Job Information Changes
1 -
Job-Related Events
1 -
Job_Event_Information
1 -
joule
4 -
Journal Entries
1 -
Just Ask
1 -
Kerberos for ABAP
8 -
Kerberos for JAVA
8 -
KNN
1 -
Launch Wizard
1 -
Learning Content
2 -
Life at SAP
5 -
lightning
1 -
Linear Regression SAP HANA Cloud
1 -
Loading Indicator
1 -
local tax regulations
1 -
LP
1 -
Machine Learning
2 -
Marketing
1 -
Master Data
3 -
Master Data Management
14 -
Maxdb
2 -
MDG
1 -
MDGM
1 -
MDM
1 -
Message box.
1 -
Messages on RF Device
1 -
Microservices Architecture
1 -
Microsoft Universal Print
1 -
Middleware Solutions
1 -
Migration
5 -
ML Model Development
1 -
Modeling in SAP HANA Cloud
8 -
Monitoring
3 -
MTA
1 -
Multi-Record Scenarios
1 -
Multiple Event Triggers
1 -
Myself Transformation
1 -
Neo
1 -
New Event Creation
1 -
New Feature
1 -
Newcomer
1 -
NodeJS
3 -
ODATA
2 -
OData APIs
1 -
odatav2
1 -
ODATAV4
1 -
ODBC
1 -
ODBC Connection
1 -
Onpremise
1 -
open source
2 -
OpenAI API
1 -
Oracle
1 -
PaPM
1 -
PaPM Dynamic Data Copy through Writer function
1 -
PaPM Remote Call
1 -
PAS-C01
1 -
Pay Component Management
1 -
PGP
1 -
Pickle
1 -
PLANNING ARCHITECTURE
1 -
Popup in Sap analytical cloud
1 -
PostgrSQL
1 -
POSTMAN
1 -
Prettier
1 -
Process Automation
2 -
Product Updates
4 -
PSM
1 -
Public Cloud
1 -
Python
4 -
python library - Document information extraction service
1 -
Qlik
1 -
Qualtrics
1 -
RAP
3 -
RAP BO
2 -
Record Deletion
1 -
Recovery
1 -
recurring payments
1 -
redeply
1 -
Release
1 -
Remote Consumption Model
1 -
Replication Flows
1 -
research
1 -
Resilience
1 -
REST
1 -
REST API
2 -
Retagging Required
1 -
Risk
1 -
Rolling Kernel Switch
1 -
route
1 -
rules
1 -
S4 HANA
1 -
S4 HANA Cloud
1 -
S4 HANA On-Premise
1 -
S4HANA
3 -
S4HANA_OP_2023
2 -
SAC
10 -
SAC PLANNING
9 -
SAP
4 -
SAP ABAP
1 -
SAP Advanced Event Mesh
1 -
SAP AI Core
8 -
SAP AI Launchpad
8 -
SAP Analytic Cloud Compass
1 -
Sap Analytical Cloud
1 -
SAP Analytics Cloud
4 -
SAP Analytics Cloud for Consolidation
3 -
SAP Analytics Cloud Story
1 -
SAP analytics clouds
1 -
SAP API Management
1 -
SAP BAS
1 -
SAP Basis
6 -
SAP BODS
1 -
SAP BODS certification.
1 -
SAP BTP
21 -
SAP BTP Build Work Zone
2 -
SAP BTP Cloud Foundry
6 -
SAP BTP Costing
1 -
SAP BTP CTMS
1 -
SAP BTP Innovation
1 -
SAP BTP Migration Tool
1 -
SAP BTP SDK IOS
1 -
SAP Build
11 -
SAP Build App
1 -
SAP Build apps
1 -
SAP Build CodeJam
1 -
SAP Build Process Automation
3 -
SAP Build work zone
10 -
SAP Business Objects Platform
1 -
SAP Business Technology
2 -
SAP Business Technology Platform (XP)
1 -
sap bw
1 -
SAP CAP
2 -
SAP CDC
1 -
SAP CDP
1 -
SAP CDS VIEW
1 -
SAP Certification
1 -
SAP Cloud ALM
4 -
SAP Cloud Application Programming Model
1 -
SAP Cloud Integration for Data Services
1 -
SAP cloud platform
8 -
SAP Companion
1 -
SAP CPI
3 -
SAP CPI (Cloud Platform Integration)
2 -
SAP CPI Discover tab
1 -
sap credential store
1 -
SAP Customer Data Cloud
1 -
SAP Customer Data Platform
1 -
SAP Data Intelligence
1 -
SAP Data Migration in Retail Industry
1 -
SAP Data Services
1 -
SAP DATABASE
1 -
SAP Dataspher to Non SAP BI tools
1 -
SAP Datasphere
9 -
SAP DRC
1 -
SAP EWM
1 -
SAP Fiori
3 -
SAP Fiori App Embedding
1 -
Sap Fiori Extension Project Using BAS
1 -
SAP GRC
1 -
SAP HANA
1 -
SAP HCM (Human Capital Management)
1 -
SAP HR Solutions
1 -
SAP IDM
1 -
SAP Integration Suite
9 -
SAP Integrations
4 -
SAP iRPA
2 -
SAP LAGGING AND SLOW
1 -
SAP Learning Class
1 -
SAP Learning Hub
1 -
SAP Master Data
1 -
SAP Odata
2 -
SAP on Azure
2 -
SAP PartnerEdge
1 -
sap partners
1 -
SAP Password Reset
1 -
SAP PO Migration
1 -
SAP Prepackaged Content
1 -
SAP Process Automation
2 -
SAP Process Integration
2 -
SAP Process Orchestration
1 -
SAP S4HANA
2 -
SAP S4HANA Cloud
1 -
SAP S4HANA Cloud for Finance
1 -
SAP S4HANA Cloud private edition
1 -
SAP Sandbox
1 -
SAP STMS
1 -
SAP successfactors
3 -
SAP SuccessFactors HXM Core
1 -
SAP Time
1 -
SAP TM
2 -
SAP Trading Partner Management
1 -
SAP UI5
1 -
SAP Upgrade
1 -
SAP Utilities
1 -
SAP-GUI
8 -
SAP_COM_0276
1 -
SAPBTP
1 -
SAPCPI
1 -
SAPEWM
1 -
sapmentors
1 -
saponaws
2 -
SAPS4HANA
1 -
SAPUI5
5 -
schedule
1 -
Script Operator
1 -
Secure Login Client Setup
8 -
security
9 -
Selenium Testing
1 -
Self Transformation
1 -
Self-Transformation
1 -
SEN
1 -
SEN Manager
1 -
service
1 -
SET_CELL_TYPE
1 -
SET_CELL_TYPE_COLUMN
1 -
SFTP scenario
2 -
Simplex
1 -
Single Sign On
8 -
Singlesource
1 -
SKLearn
1 -
Slow loading
1 -
soap
1 -
Software Development
1 -
SOLMAN
1 -
solman 7.2
2 -
Solution Manager
3 -
sp_dumpdb
1 -
sp_dumptrans
1 -
SQL
1 -
sql script
1 -
SSL
8 -
SSO
8 -
Substring function
1 -
SuccessFactors
1 -
SuccessFactors Platform
1 -
SuccessFactors Time Tracking
1 -
Sybase
1 -
system copy method
1 -
System owner
1 -
Table splitting
1 -
Tax Integration
1 -
Technical article
1 -
Technical articles
1 -
Technology Updates
14 -
Technology Updates
1 -
Technology_Updates
1 -
terraform
1 -
Threats
2 -
Time Collectors
1 -
Time Off
2 -
Time Sheet
1 -
Time Sheet SAP SuccessFactors Time Tracking
1 -
Tips and tricks
2 -
toggle button
1 -
Tools
1 -
Trainings & Certifications
1 -
Transformation Flow
1 -
Transport in SAP BODS
1 -
Transport Management
1 -
TypeScript
3 -
ui designer
1 -
unbind
1 -
Unified Customer Profile
1 -
UPB
1 -
Use of Parameters for Data Copy in PaPM
1 -
User Unlock
1 -
VA02
1 -
Validations
1 -
Vector Database
2 -
Vector Engine
1 -
Visual Studio Code
1 -
VSCode
2 -
VSCode extenions
1 -
Vulnerabilities
1 -
Web SDK
1 -
work zone
1 -
workload
1 -
xsa
1 -
XSA Refresh
1
- « Previous
- Next »
Related Content
- IoT - Ultimate Data Cyber Security - with Enterprise Blockchain and SAP BTP 🚀 in Technology Blogs by Members
- 10+ ways to reshape your SAP landscape with SAP Business Technology Platform – Blog 4 in Technology Blogs by SAP
- What’s New in SAP Analytics Cloud Release 2024.07 in Technology Blogs by SAP
- Exploring Integration Options in SAP Datasphere with the focus on using SAP extractors in Technology Blogs by SAP
- Possible Use Cases Of ECC & S/4HANA Connection With SAP Datasphere. in Technology Q&A
Top kudoed authors
| User | Count |
|---|---|
| 8 | |
| 5 | |
| 5 | |
| 4 | |
| 4 | |
| 4 | |
| 3 | |
| 3 | |
| 3 | |
| 3 |