SAP HANA 2.0 SPS 00 What's New: Performance Monito...
Technology Blogs by SAP
Learn how to extend and personalize SAP applications. Follow the SAP technology blog for insights into SAP BTP, ABAP, SAP Analytics Cloud, SAP HANA, and more.
In the upcoming weeks, we will be posting new videos to the SAP HANA Academy to show new features and functionality introduced with SAP HANA 2.0 Support Package Stack (SPS) 00.
The topic of this blog is performance monitoring and analysis.
In the previous blog post about system administration, we have already discussed the new SAP HANA cockpit 2.0. As part of the new release, most of the performance management tools have received enhancements. This includes the following tools:
Performance Monitor
Monitor Statements
Threads
Sessions
Expensive Statements
SQL Plan Cache
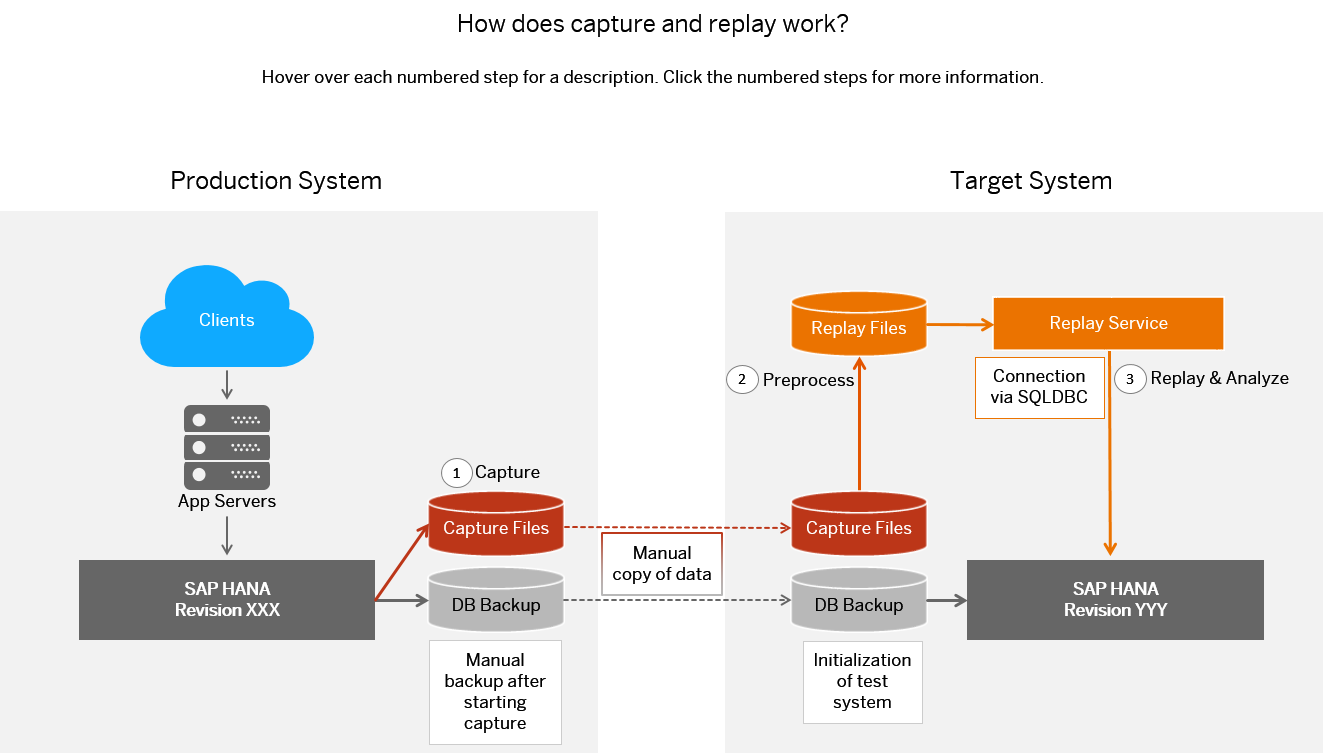
Capture and Replay
Capture and replay workloads can help you evaluate potential impacts on performance or stability after a change in hardware or software configuration. This feature was introduced with SAP HANA 1.0 SPS 12 and has been enhanced for SAP HANA 2.0.
For those not familiar with capture and replay, there is a video on the SAP HANA Administration playlist that provides a brief introduction (we will update the video for SAP HANA 2.0 soon):
The new features for the capture and replay tool are:
Capture Overwrite
Compare Replayed Workloads
Replay Report and Load
Capture overwrite enables to set the condition, either on time or on disk usage, for capture overwrite to occur. This allows you, for example, to capture the daily workload but only keep and process the capture under exceptional circumstances.
Capture compare allows you to compare a target capture against a baseline, per SQL statement and with a graph for the system load.
The Load graph shows for a large number of KPI's system workload statistics.
SQL Analyzer
The new SQL Analyzer tool shows detailed information for selected SQL queries to help you tune or troubleshoot performance.
You access the tool from the new Database Explorer or from the Monitor Expensive Statement / Plan Trace.
Workload Analyzer
In SAP HANA 2.0, we now have two different workload analyzers:
Based on Thread Samples (enhanced)
Based on Engine Instrumentation (new)
The new analyzer works with the captures from capture and replay. The workload analyzer based on thread samples uses more recent system statistics.
The analysis can be performed on a broad number of dimensions and services and a large number of KPIs.
The SAP HANA Academy provides free online video tutorials for the developers, consultants, partners and customers of SAP HANA.
Topics range from practical how-to instructions on administration, data loading and modeling, and integration with other SAP solutions, to more conceptual projects to help build out new solutions using mobile applications or predictive analysis.