- SAP Community
- Products and Technology
- Technology
- Technology Blogs by SAP
- Kyma Integration with SAP Cloud Logging. Part 1: I...
- Subscribe to RSS Feed
- Mark as New
- Mark as Read
- Bookmark
- Subscribe
- Printer Friendly Page
- Report Inappropriate Content
Welcome to the first blog in our three-part series, where we will explore how Kyma can seamlessly integrate with the SAP Cloud Logging service. By enabling the three pillars of observability - logs, traces, and metrics - Kyma developers and operators can effectively troubleshoot issues, identify root causes, investigate performance bottlenecks, and gain a comprehensive understanding of system behavior.
In this initial blog post, we will delve into the following topics:
SAP Cloud Logging: An Overview
- Learn about the SAP Cloud Logging service and its significance in the context of Kyma integration.
- Discover how to provision an instance of SAP Cloud Logging.
Shipping Logs to SAP Cloud Logging
- Explore the step-by-step process of shipping logs from applications deployed on SAP BTP, Kyma runtime to SAP Cloud Logging.
In the subsequent blogs, we will continue our exploration by discussing the integration of traces and metrics.
What is SAP Cloud Logging?
The SAP Discovery Center description says:
SAP Cloud Logging service is an instance-based observability service that builds upon OpenSearch to store, visualize, and analyze application logs, metrics, and traces from SAP BTP Cloud Foundry, Kyma, Kubernetes, and other runtime environments.
For Cloud Foundry and Kyma, SAP Cloud Logging offers an easy integration by providing predefined content to investigate the load, latency, and error rates of the observed applications based on their requests and correlate them with additional data.
To get started with SAP Cloud Logging, visit the Discovery Center where you will find more detailed information about its features and capabilities.
Pricing for the SAP Cloud Logging service can be determined using the SAP Cloud Logging Capacity Unit Estimator. It is important to note that for Kyma, the "Ingest Otel" option needs to be enabled, which should be taken into account when estimating pricing. This option is used for shipping traces and metrics.
Provision an Instance of SAP Cloud Logging
Now, let's explore how we can leverage SAP Cloud Logging to ingest logs from applications deployed on SAP BTP, Kyma runtime.
Prerequisites
- SAP BTP, Kyma runtime instance
- Entitlement added for SAP Cloud Logging
- kubectl and command line support
Procedure
You can refer to the official SAP documentation to create an SAP Cloud Logging service instance for details.
- Export your namespace's name as an environment variable.
export NS={your-namespace}
- Create an instance of SAP Cloud Logging and a service binding:
kubectl -n ${NS} apply -f https://raw.githubusercontent.com/SAP-samples/kyma-runtime-extension-samples/main/sap-cloud-logging/k8s/cls-instance.yaml
For reference, this is the service instance specification:
apiVersion: services.cloud.sap.com/v1
kind: ServiceInstance
metadata:
    name: my-cls
spec:
    serviceOfferingName: cloud-logging
    servicePlanName: dev
    parameters:
      retentionPeriod: 7
      esApiEnabled: false
      ingest_otlp:
        enabled: true
This is the corresponding service binding.
apiVersion: services.cloud.sap.com/v1
kind: ServiceBinding
metadata:
    name: my-cls-binding
spec:
  serviceInstanceName: my-cls
  credentialsRotationPolicy:
    enabled: true
    rotationFrequency: "720h"
    rotatedBindingTTL: "24h"
The service binding specifies the credentials' rotation policy.
It is a great developer experience that the Telemetry module intelligently switches to new credentials once they are rotated. This does not require any action from the developer.
NOTE: The same instance will be reused for configuring tracing and monitoring.
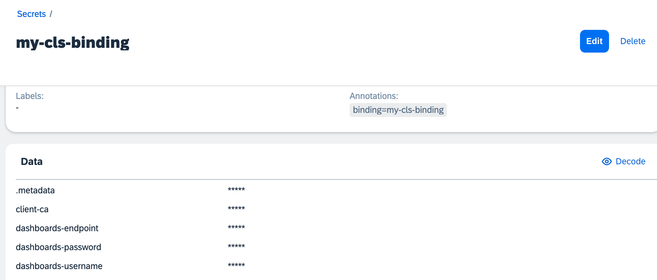
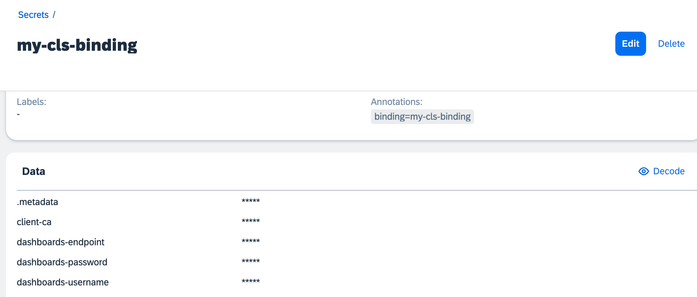
The service binding also generates a Secret with the same name. It contains the details to access the dashboard of the SAP Cloud Logging instance previously created.
Ship your application logs to SAP Cloud Logging
To ship your logs to SAP Cloud Logging, create LogPipeline custom resources (CRs).
Your application running in SAP BTP, Kyma runtime will send logs to stdout. The Telemetry module based on the LogPipeline will capture and ship them to SAP Cloud Logging.
Create a LogPipeline CR for Your Application Logs
To create the LogPipeline, run:
kubectl apply -f https://raw.githubusercontent.com/SAP-samples/kyma-runtime-extension-samples/main/sap-cloud-logging/k8s/logging/logs-pipeline-application-logs.yaml
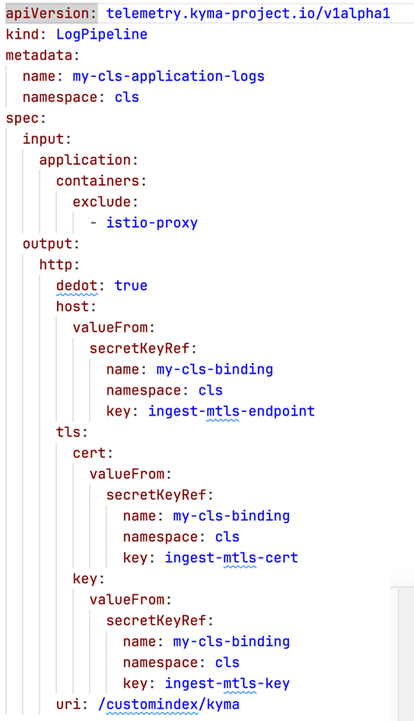
In the LogPipeline, configure the details about shipping the logs to SAP Cloud Logging. Include major configurations such as:
- Input: From which applications, containers, and namespaces the logs should be shipped
- Output: The access details of the SAP Cloud Logging instance to which logs will be shipped
You can learn about all the parameters in detail from the official Telemetry LogPipeline documentation.
This is an example of the LogPipeline configuration used for this blog post:
Create a LogPipeline CR for the Istio access logs
Referred from kyma-project.io documentation about istio access logs.
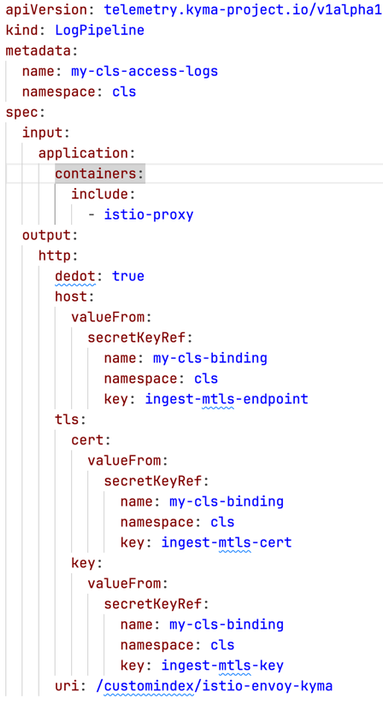
Istio access logs provide fine-grained details about the traffic when accessing the workloads that are part of Istio service mesh. The only prerequisite is to enable Istio sidecar injection for your workloads. The Istio access logs provide useful information relating to 4 golden signals, such as latency, traffic, errors, and saturation as well as any troubleshooting anomalies.
To create the LogPipeline, run:
kubectl apply -f https://raw.githubusercontent.com/SAP-samples/kyma-runtime-extension-samples/main/sap-cloud-logging/k8s/logging/logs-pipeline-istio-access-logs.yaml
This is an example of the LogPipeline configuration used for this blog post:
View the logs
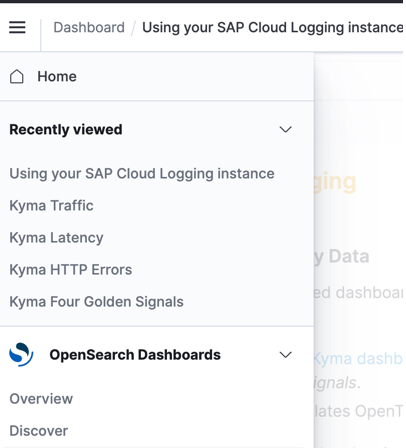
You can access the SAP Cloud Logging instance dashboard. The access details are available in the Secret generated by the service binding.
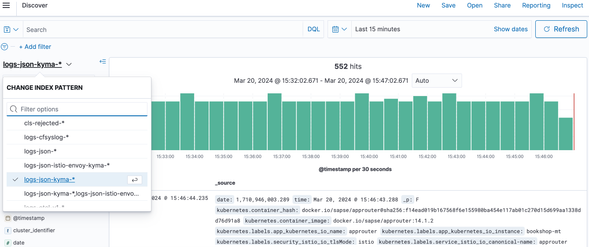
The simplest way to start exploring the logs is to navigate to Discover and choose the appropriate index.
You can choose the index pattern to view the relevant logs, apply a filter or search term to narrow down your search or use other Open Search capabilities.
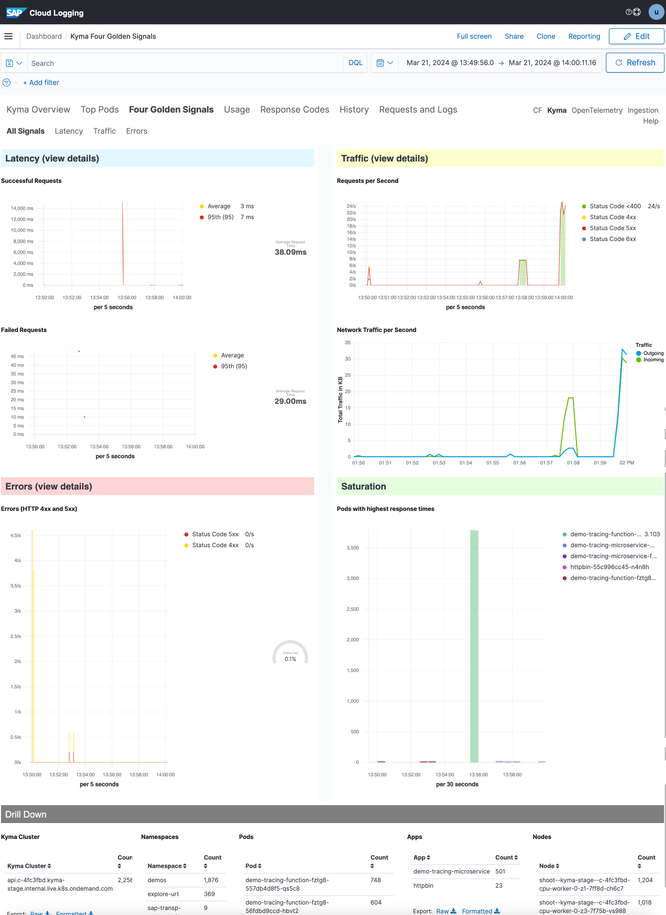
We will talk more about metrics in one of the next blog posts. However, I would like to bring your attention to the Four Golden Signals dashboard. It is provided out of the box and is based on the Istio access logs which we configured previously.
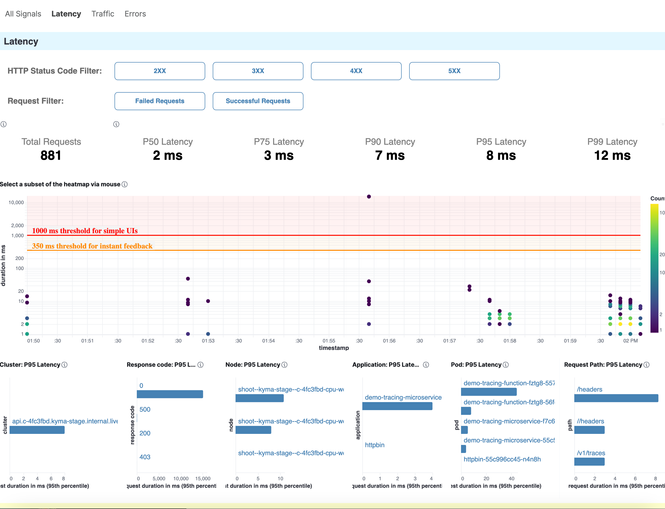
For reference, check out the generic and latency dashboards.
Now you can start exploring your application as well as the access logs.
Stay tuned for the next blog post about shipping traces from SAP BTP, Kyma runtime to SAP Cloud Logging.
- SAP Managed Tags:
- SAP BTP, Kyma runtime
You must be a registered user to add a comment. If you've already registered, sign in. Otherwise, register and sign in.
-
ABAP CDS Views - CDC (Change Data Capture)
2 -
AI
1 -
Analyze Workload Data
1 -
BTP
1 -
Business and IT Integration
2 -
Business application stu
1 -
Business Technology Platform
1 -
Business Trends
1,658 -
Business Trends
93 -
CAP
1 -
cf
1 -
Cloud Foundry
1 -
Confluent
1 -
Customer COE Basics and Fundamentals
1 -
Customer COE Latest and Greatest
3 -
Customer Data Browser app
1 -
Data Analysis Tool
1 -
data migration
1 -
data transfer
1 -
Datasphere
2 -
Event Information
1,400 -
Event Information
67 -
Expert
1 -
Expert Insights
177 -
Expert Insights
301 -
General
1 -
Google cloud
1 -
Google Next'24
1 -
GraphQL
1 -
Kafka
1 -
Life at SAP
780 -
Life at SAP
13 -
Migrate your Data App
1 -
MTA
1 -
Network Performance Analysis
1 -
NodeJS
1 -
PDF
1 -
POC
1 -
Product Updates
4,577 -
Product Updates
346 -
Replication Flow
1 -
REST API
1 -
RisewithSAP
1 -
SAP BTP
1 -
SAP BTP Cloud Foundry
1 -
SAP Cloud ALM
1 -
SAP Cloud Application Programming Model
1 -
SAP Datasphere
2 -
SAP S4HANA Cloud
1 -
SAP S4HANA Migration Cockpit
1 -
Technology Updates
6,873 -
Technology Updates
430 -
Workload Fluctuations
1
- SAP BW/4 - revamp and true to the line 2024 in Technology Blogs by Members
- Exploring GraphQL and REST for SAP Developers in Technology Blogs by SAP
- SAP Datasphere's updated Pricing & Packaging: Lower Costs & More Flexibility in Technology Blogs by Members
- External System Integration in DMC in Technology Blogs by Members
- PM Notification Configuration from DMC to ERP in Technology Blogs by Members
| User | Count |
|---|---|
| 29 | |
| 17 | |
| 15 | |
| 13 | |
| 11 | |
| 9 | |
| 8 | |
| 8 | |
| 8 | |
| 7 |
