
- SAP Community
- Products and Technology
- Technology
- Technology Blogs by SAP
- Analyze Expensive ABAP Workload in the Cloud with ...
- Subscribe to RSS Feed
- Mark as New
- Mark as Read
- Bookmark
- Subscribe
- Printer Friendly Page
- Report Inappropriate Content
As an administrator or developer in the ABAP environment in the cloud, you need to keep track of the workload that kept your system busy throughout the day or at specific points in time. You want to check how many of your work processes are or were occupied with what kind of workload, consuming how much ABAP CPU time and main memory. Finally, you want to find out which ABAP coding was responsible for the high consumption of these resources.
In this blog post, I’d like to show you how you can use the Sampled Work Process Data app to analyze concurrent workload and resource consumption and to find the root cause of a performance problem.
Sampled Work Process Data App vs. Other Tools
Maybe you are already familiar with the System Workload app that provides an overview of the ABAP workload in your system. The following blog post gives you an insight with examples:
Analyzing Performance Degradations in the ABAP Environment in the Cloud
The ABAP system provides two data capturing mechanisms for the ABAP workload: ABAP statistics records and ABAP work process samples. The different strategies for data collection and timing aspects are explained in the following documentation on SAP Help Portal:
Monitoring the System Workload: Data Collection and Focus of Available Apps | SAP Help Portal
Both data capturing strategies are designed to cover different scenarios. You can read more about the supported monitoring use cases in the following documentation on SAP Help Portal:
Monitoring the System Workload: Apps and Their Use Cases | SAP Help Portal
The ABAP statistics data of the System Workload app is persisted after the respective processing step has finished. In addition, the data on CPU time and main memory consumption is only available for the entire processing step, so you can’t determine if any interesting "hotspot" is hiding somewhere in the ABAP coding, let alone where they’re precisely located in the code.
You might also have heard about - or already used - the ABAP Profiler, which creates ABAP traces that provide detailed insights into your program, its resource consumption and potential "hotspots" in your coding. However, using the ABAP Profiler requires you to explicitly activate it before running any specific program or application. This means that retrospective analysis is not possible. Furthermore, the results are usually limited to your application only, or at best a subset of the workload in the system. Other software running concurrently, which may cause resource bottlenecks, is not considered. For more information about the ABAP Profiler, please refer to the following documentation on SAP Help Portal:
Profiling ABAP Code | SAP Help Portal
If you want to detect a large resource consumption immediately or detect the responsible code location without activating any tracing, you’d rather use the Sampled Work Process Data app.
Get an Overview of the ABAP CPU Time Consumption
On the SAP Fiori launchpad of the ABAP environment in SAP BTP, I went to the Technical Monitoring area and chose the Sampled Work Process Data app. This app is available for administrator and developer roles.
On the entry screen of the app, I get an overview of the ABAP CPU time consumption for the last 24 hours with a resolution of ten minutes. I can easily adjust the time range and the resolution using the time slider at the top.

I can even change to a granularity of single seconds. Of course, this only makes sense for a total time range of much less than 24 hours, such as 1 minute, for instance.
In the upper part of the screen, there’s a graphical overview drilled down by the Request Entry Type (for example, OData v4 or SQL Service). In the lower part of the screen, there’s a table that lists the top 10 consumers with more detailed characteristics, such as the Request Entry Name. Additionally, there’s a metric that indicates the overall ABAP CPU utilization as a percentage over time. This is represented by the black line in the screenshot below, with a scale located on the right side.
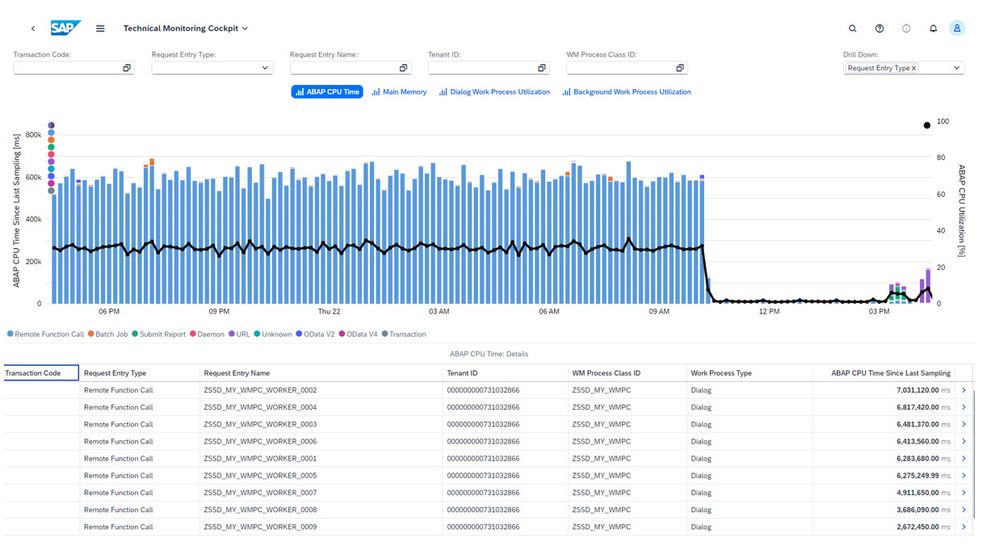
Analyze Concurrent Workload and Resource Consumption
The entry screen provides four different metrics to depict resource consumption. These metrics include ABAP CPU time, main memory, and dialog and background work process utilization. Speaking of filters, you can use the filters for Transaction Code, Request Entry Type, Request Entry Name, Tenant ID and WM Process Class ID to focus on what you are really interested in:

Filter values can be precise values or wildcards.
When it comes to drilldown, you might be interested in drilling down according to other characteristics or a more fine-grained resolution of the depicted workload. On the upper right, you can define the set of characteristics that the drilldown is based on:

By default, this is only the Request Entry Type. However, you can also select the Transaction Code, Request Entry Name, Tenant ID and WM Process Class ID, either individually or in any combination that is appropriate for your specific use case. This allows you to investigate concurrent resource consumption in different dimensions. In the chart below, the top values of your drilldown characteristics (in this case, just the Request Entry Name) are displayed accordingly:
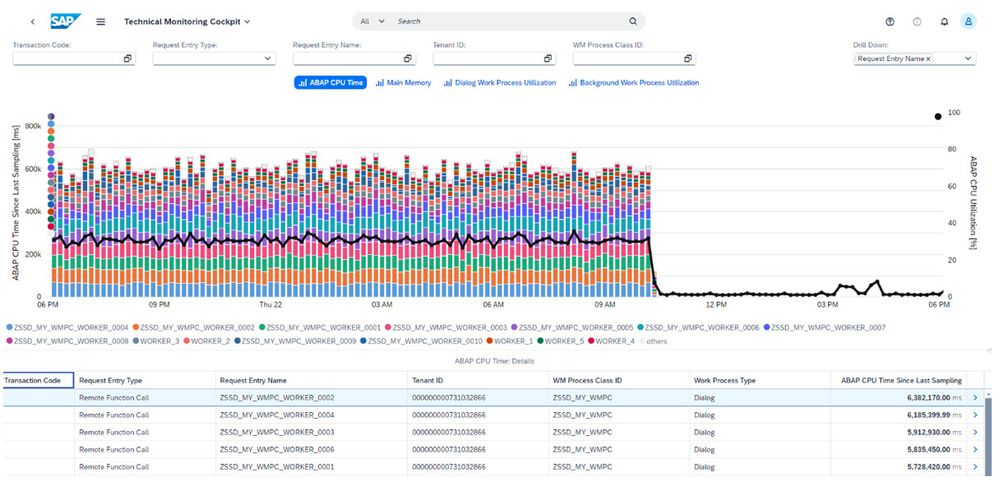
In the chart, you can clearly identify which types of workloads are competing concurrently for resources within the same 10 minutes interval. By adjusting the time slider, you can also choose much finer granularities.
Note: Please be aware that the work process sampling is, as the name suggests, based on samples (snapshots) of the work process data provided by the ABAP kernel that are taken once per second. The ABAP CPU time consumption is then calculated as the delta between consecutive samples. This means that only expensive workloads running for more than a second are displayed as relevant ABAP CPU time consumers.
Reveal the Root Cause of Performance Problems
Now let’s assume that we don’t have a uniform distribution of the workload as in the example above. Instead, one of the Request Entry Name values is popping up again and again, for example, around 09:30 a.m.:

I click on the bar in the chart as shown in the above screenshot (which filters for the respective Request Entry Name and time interval) and then on the Details arrow on the right of a table row. This takes me to the Request Entry Point screen for the ABAP CPU time. (If I had switched to the Main Memory or another aspect before, I would arrive at a corresponding detail view for that metric, of course.) Since I have also selected a specific time interval, I get a zoomed-in view with a resolution of single seconds, here for the time range between 09:20 and 09:30:
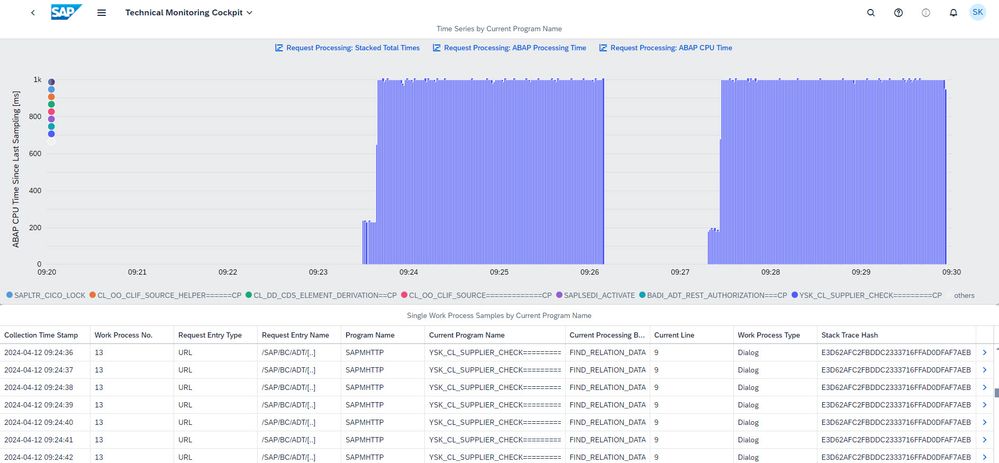
This screens also offers a graphical overview over time, along with further details in the table. However, the drilldown characteristic in the chart is the Current Program Name, that is the name of the coding artifact (typically a class name) that was being executed when the sample was created. This chart may already give you a pretty good understanding of which parts of your application (on a technical level in terms of ABAP coding that is run) are expensive and where you may find optimization potential (as shown in the screenshot below). Clicking on the legend or directly on the chart filters the table data accordingly. You can zoom in and zoom out, as on the previous screens. The lower part of the screen shows a list of single work process samples, which include detailed characteristics and metrics describing the work process at specific points in time.
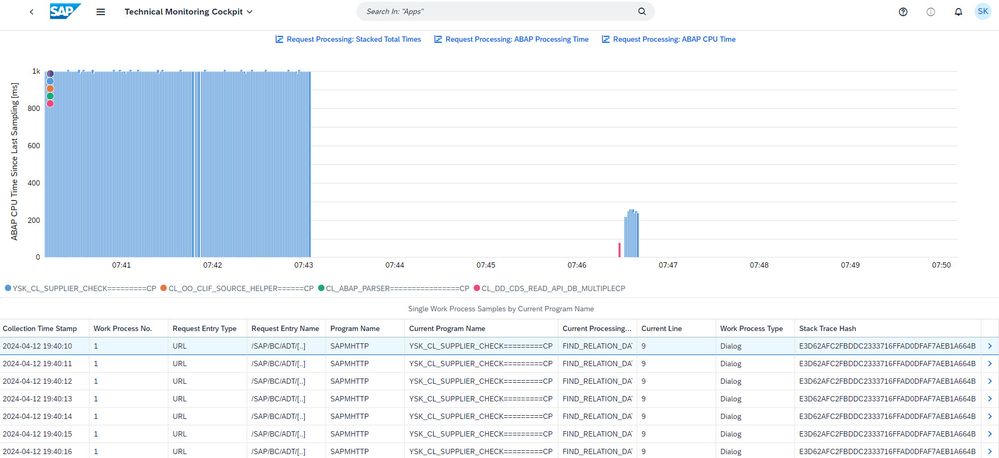
In this case, we can recognize two executions of the same workload that were both running for two and a half minutes. During the execution, the CPU time consumption per second was often close to 1000 milliseconds.
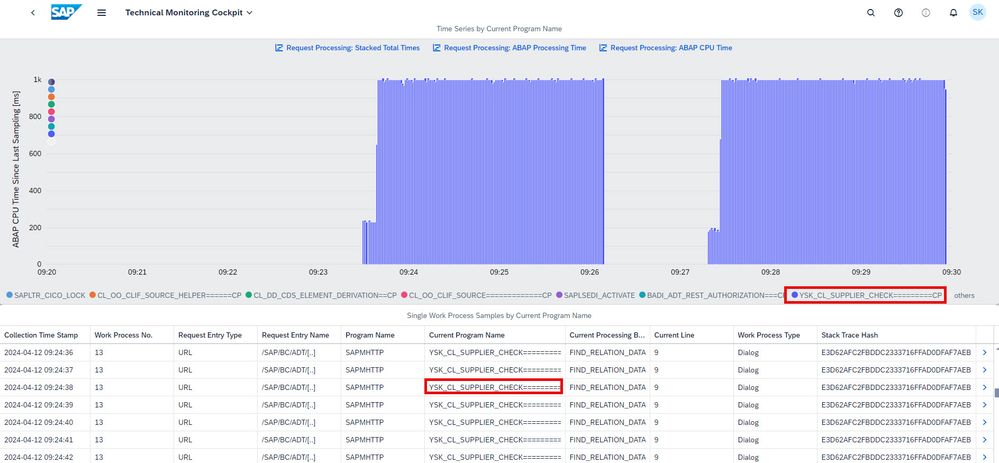
Now I click on the Details arrow at the end of a row in the table, which leads me to the Single Work Process Sample object page with even more details:
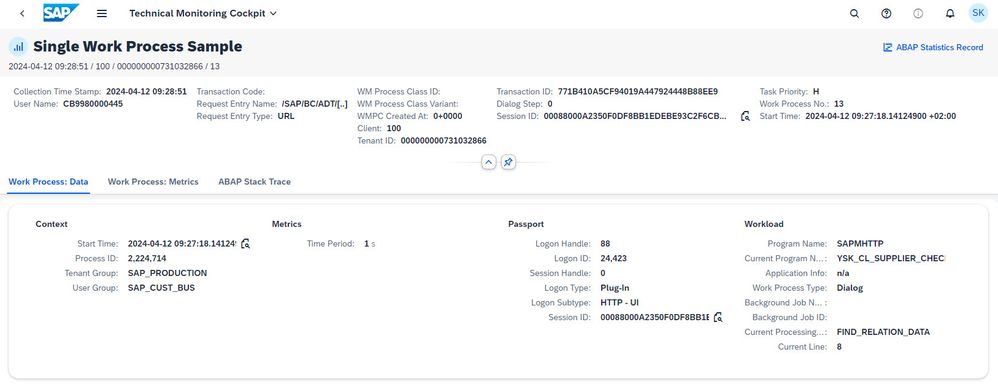
For a database-intensive scenario, you have the option to navigate further to the ABAP statistics record using the link on the upper right of the screen. On the ABAP Statistics Record screen, you can find – among other things – detailed data about the HANA processing time and the single expensive SQL statements, as explained in the blog post about the System Workload app mentioned at the beginning of this blog post.
Now let’s go back to the Single Work Process Sample object page. Here, I can also switch to the Work Process: Metrics tab page of the object page to learn, for instance, about the number of table entries transferred between the application server and the database within the last second before this sample was taken:
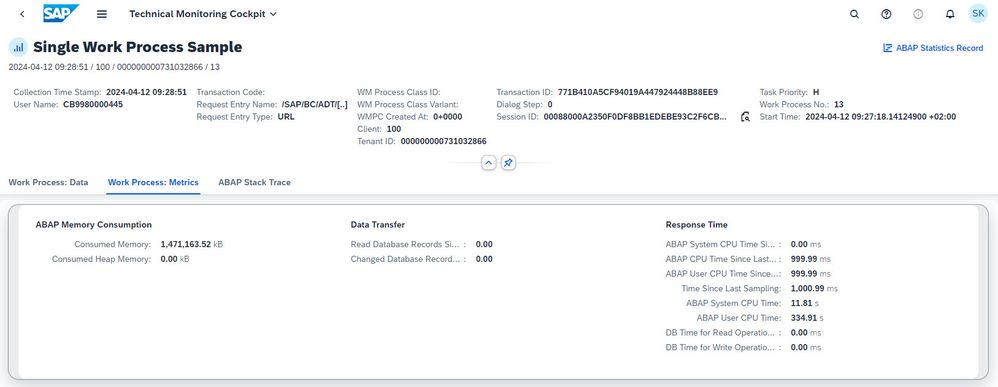
In this ABAP CPU-intensive scenario , work process sampling can help directly identify whether there’s room for improvement. You can recognize that your application is CPU-intensive if many single samples have a CPU time consumption that’s not too far from 1 second, as is the case here.
Typical defects include expensive operations on large internal tables. On the ABAP Stack Trace tab page of the object page, I can check whether this is the reason for poor performance:
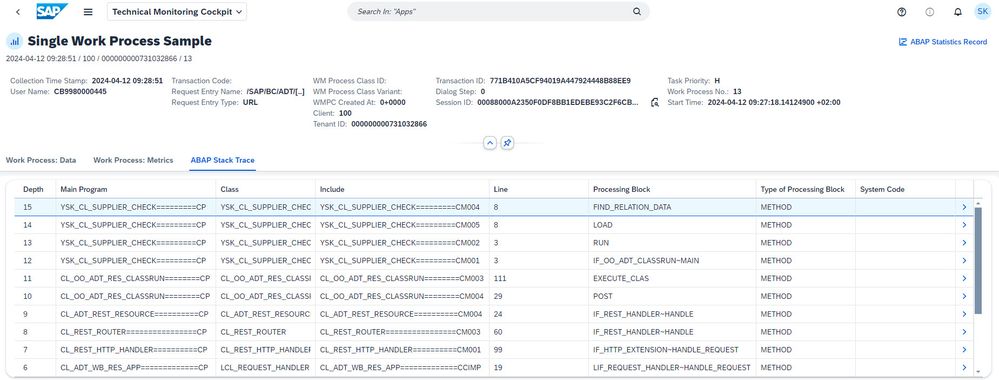
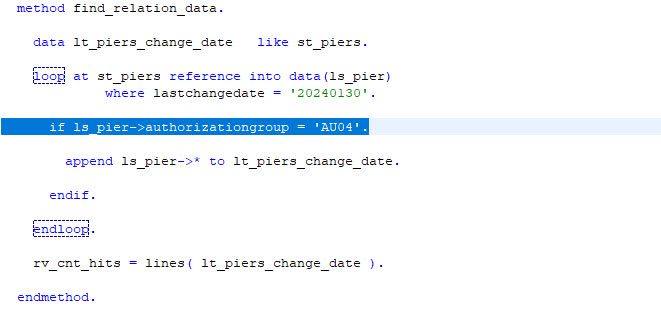
By navigating from here to ABAP development tools for Eclipse (ADT) or an HTML viewer (by clicking on the Details arrow next to a line in the table), I can easily jump to the respective code where, in our simple example, a LOOP statement is executed on an internal table.
Note: In the case of single expensive statements (typically a READ TABLE or a LOOP statement, as in our example here, or a long-running Open SQL statement), the ABAP kernel – when regaining control and returning a stack trace –usually points to the next statement (the one directly following the really expensive one). Thus, we shouldn’t be concerned about the IF statement, but rather the LOOP statement.
Verify the Impact of Performance Improvements
In this simple example, the performance of the statement can be significantly improved by introducing a secondary key. In addition, we slightly adjust the LOOP statement by referring to the secondary key:


We can assess the impact of this tiny change by inspecting the time interval from 10:00 to 10:10 a.m., during which the same workload was run again. This can be done on both the Sampled Work Process Data entry screen ...
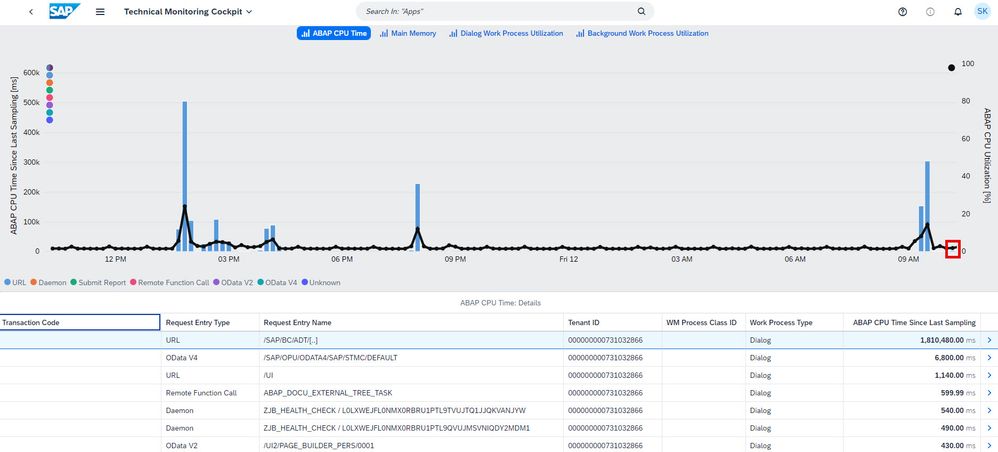
...and the Request Entry Point screen by selecting the respective time interval.
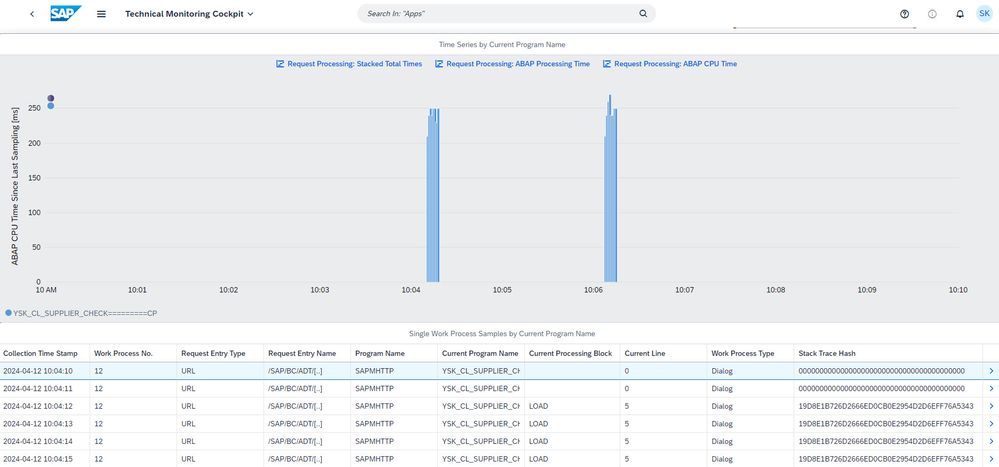
We can clearly recognize that now two executions of the same workload finish within seconds and that the FIND_RELATION_DATA method does not even show up in any of the collected work process samples anymore. Here are both versions of the workload in direct comparison on the Request Entry Point screen:
Conclusion
The Sampled Work Process Data app in the Technical Monitoring area of the SAP Fiori launchpad in an ABAP environment in the cloud gives you a lot of insights into concurrent workload in your system and lets you glance under the hood of ABAP CPU or memory intensive applications. It bridges the gap between apps based on ABAP statistics records and tracing tools like the ABAP Profiler.
I’d like to thank everyone who contributed to this blogpost, especially my colleagues anke.griesbaum, christian.cop, steffen.siegmund, ingrid.mautes, karen.kuck and sabine.reich.
For more information, refer to the following documentation on SAP Help Portal:
Sampled Work Process Data | SAP Help Portal
- SAP Managed Tags:
- SAP BTP, ABAP environment,
- SAP S/4HANA Cloud ABAP Environment,
- ABAP Development,
- Cloud Operations
You must be a registered user to add a comment. If you've already registered, sign in. Otherwise, register and sign in.
-
ABAP CDS Views - CDC (Change Data Capture)
2 -
AI
1 -
Analyze Workload Data
1 -
BTP
1 -
Business and IT Integration
2 -
Business application stu
1 -
Business Technology Platform
1 -
Business Trends
1,658 -
Business Trends
101 -
CAP
1 -
cf
1 -
Cloud Foundry
1 -
Confluent
1 -
Customer COE Basics and Fundamentals
1 -
Customer COE Latest and Greatest
3 -
Customer Data Browser app
1 -
Data Analysis Tool
1 -
data migration
1 -
data transfer
1 -
Datasphere
2 -
Event Information
1,400 -
Event Information
69 -
Expert
1 -
Expert Insights
177 -
Expert Insights
318 -
General
1 -
Google cloud
1 -
Google Next'24
1 -
GraphQL
1 -
Kafka
1 -
Life at SAP
780 -
Life at SAP
13 -
Migrate your Data App
1 -
MTA
1 -
Network Performance Analysis
1 -
NodeJS
1 -
PDF
1 -
POC
1 -
Product Updates
4,576 -
Product Updates
366 -
Replication Flow
1 -
REST API
1 -
RisewithSAP
1 -
SAP BTP
1 -
SAP BTP Cloud Foundry
1 -
SAP Cloud ALM
1 -
SAP Cloud Application Programming Model
1 -
SAP Datasphere
2 -
SAP S4HANA Cloud
1 -
SAP S4HANA Migration Cockpit
1 -
Technology Updates
6,873 -
Technology Updates
452 -
Workload Fluctuations
1
- Capture Your Own Workload Statistics in the ABAP Environment in the Cloud in Technology Blogs by SAP
- Explore Business Continuity Options for SAP workload using AWS Elastic DisasterRecoveryService (DRS) in Technology Blogs by Members
- Workload Analysis for HANA Platform Series - 3. Identify the Memory Consumption in Technology Blogs by SAP
- Workload Analysis for HANA Platform Series - 1. Define and Understand the Workload Pattern in Technology Blogs by SAP
| User | Count |
|---|---|
| 21 | |
| 12 | |
| 10 | |
| 8 | |
| 8 | |
| 8 | |
| 7 | |
| 6 | |
| 6 | |
| 6 |