The latest update of SAP HANA Cloud Platform is probably the biggest so far in terms of number of released features - one can count as many as 20 entries in the Release Notes for SAP HANA Cloud Platform on 19 December 2013. So it is quite possible that amongst all the great stuff like WebSocket support and SDK artifacts in Maven Central, you might have missed some "smaller" features. But what does "smaller" actually mean? A feature is as big as your need and demand for it, isn't it? :wink: In this blog post I'd like to bring to your attention and show how you can use some of those features. It's about several capabilities and methods for troubleshooting Java applications on SAP HCP that were made available recently.
Debugging
Connecting a debugger and inspecting the runtime state and behavior of an applications is one of the most common techniques used when the application behaves erroneously or not as expected. Unfortunately, it's not so common feature of cloud platforms - mainly because the combination of the really verbose JDWP debug protocol and remote network latency makes for a miserable user experience and renders it practically unusable. Well, it's not the case with HANA Cloud Platform. You can debug your application on the cloud and have (almost) the same experience as if it's running on your local machine!
It's that simple. In the Eclipse IDE set the breakpoints you want. Then right click on the class (e.g. MyServlet) and from the context menu select Debug As > Debug on Server:

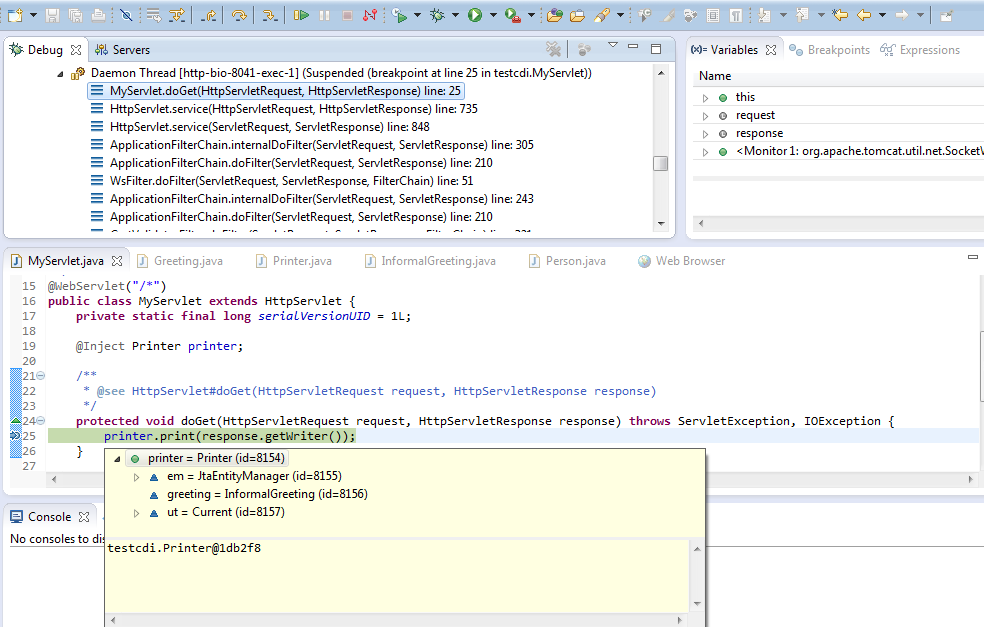
In the wizard that opens, choose a cloud server or create a new one, and when it gets started the execution will stop at the breakpoint and you'll be able to examine contents of variables, step through the code and do all the usual debugging tasks:
And what's even better - since cloud servers are running on SAP JVM, if your server has already been started it will not restart when switching to debug mode, and you'll just see its state changing from Started to Debugging in the Servers view. How cool is that? :cool:
Profiling
OK, you have identified and fixed the functional errors in your application but you are still not that happy as there are also resource-related problems - e.g. it might consume a lot of memory, or execution of certain operations could take more time than set in the requirements. You know you have to find the root cause for these issues and optimize, but you have no clue where to start from? Well, here the SAP JVM Profiler comes to help. It's a very handy tool that allows you to do exactly those kinds of analysis and it's now integrated with SAP HCP.
To start the Profiler, go to the Servers view and from the server context menu choose Profile (if the server is stopped) or Restart in Profile (if it is started):

Note again that if the server is started it will not actually restart but just the Profiler will be attached to it and its state will change to Profiling. When it changes, the profiling session will be also open in the editor space:

Now open or switch to the Profiling perspective (currently, it cannot be switched automatically and you have to do this manually):

From here, you can start several different types of analysis. For example, if you want to optimize memory consumption, you can start Allocation Analysis to find the largest objects and the methods where they have been allocated. After you have started the analysis, trigger some work load on your application and create snapshots of the profiling data:

Now you can analyze the results and do all different kinds of drill-downs into it:

For more information about the available analysis options (including examples and tutorials), consult the SAP JVM Profiler documentation in the Eclipse IDE by going to Help > Help Contents > SAP JVM Profiler.
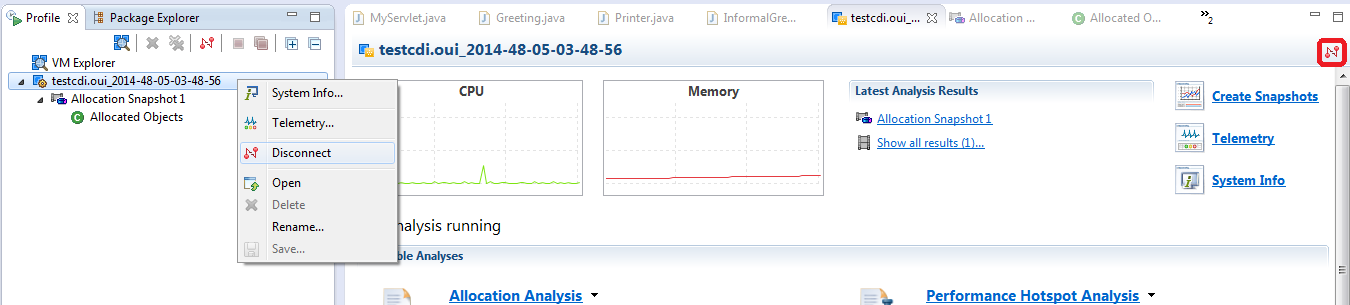
When you have finished with the profiling session, you can stop it either by selecting Disconnect from its context menu in the Profile view or by clicking on the corresponding button in the top right corner:
Logging
Logging related features (managing log levels and retrieving log files) have been around for quite some time, but with the latest platform update a new convenience functionality was added. Imagine that as part of the troubleshooting process you have changed multiple log levels for your application. Now that you have identified and fixed the issues, you would like to revert them back to their initial state so that redundant logs are not written any longer. To achieve that, you can use the new reset-log-levels console client command:

Restart is required because once created Log4j loggers cannot be removed while the JVM is running. After a restart, the custom loggers above are not present in the output of the list-loggers command:

Final Words
I hope you find this overview and the presented features helpful. Have fun coding and troubleshooting with SAP HANA Cloud Platform! And do let us know if you have any feedback or questions.
