
- SAP Community
- Products and Technology
- Technology
- Technology Blogs by Members
- JOIN's in an Imperfect World
Technology Blogs by Members
Explore a vibrant mix of technical expertise, industry insights, and tech buzz in member blogs covering SAP products, technology, and events. Get in the mix!
Turn on suggestions
Auto-suggest helps you quickly narrow down your search results by suggesting possible matches as you type.
Showing results for
Former Member
Options
- Subscribe to RSS Feed
- Mark as New
- Mark as Read
- Bookmark
- Subscribe
- Printer Friendly Page
- Report Inappropriate Content
11-28-2013
4:48 AM
In the following blog I compare the run-time performance of the Join Engine, Calculation Engine and SQL Engine as DATA grows from 1 million to 99 Million rows across several tables.
e.g.
Below you will also find links to sample procedures for generating data and recording query run-time stats.
I skipped the OLAP Engine as the following background may explain.
In a Perfect World:
- All your main data is on 1 table and requires very few joins with small master data tables.
- You only need to use a single field in JOIN rules.
- You can safely use INNER JOINS.
- All your data would sits on 1 Node and wouldn't be partitioned across Nodes.
- No one else is running other jobs on your HANA box :wink:
In a perfect world HANA returns aggregated results, of millions/billions of records, in blisteringly fast time.
If you can design your reports to run off a single table or off a single Fact Table with limited joins (e.g. with Analytic View - OLAP Engine) then you will have some very very
happy users.
We always strive to live in the perfect world, but sometimes user requirements get in the way. :shock:
This may be particular true when you don't have control of the table structures (e.g. if using ECC Tables) and as your data volume grows.
An Imperfect World:
Imagine reports that need to:
- join Financial documents with Material Movement Documents
- join Sales Order Contracts with Billing Documents and Accounts Receivable Open items
In this murky world:
- Values / Quantities are in more than one Fact Table.
- JOIN rules are usually on more than one field.
- INNER JOIN can rarely be used reliably
- Data may be partitioned across Nodes
- User selection Criteria is unlikely to exist on all tables being joined
(E,g, Company Code, Year, Period, Profit Center, Account etc.)
Why is that important? For performance it's typically best to push your user selections down to the table level before a join)
I don't think there is one simple answer how best to do complex joins. I think each requirement needs careful analysis and testing.
I've written this blog to simply share some testings I've done on a very limited scenario.
I welcome people to give comments,tips, tricks and enhancement suggestions. Constructive criticism is most definitely welcome. :smile:
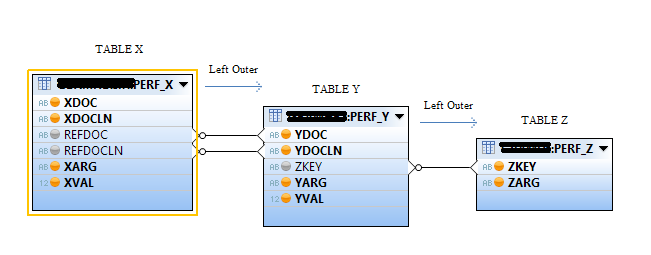
Testing Joins on Three Tables
To test out the implications of more complex joins on an increasing data set I've created 3 test tables, 3 different views joining the data, procedures to generate test data, execute test queries and store results.
I then used the procedures to gradually load 99 million records (in the 2 main tables X & Y) and periodically execute the queries and store results as data volumes increased. All the SQL code for you to replicate this test is shared in links at the end.
3 Tables:
Values are stored in Table X and Table Y, and Table Z has a additional information user may need to use in selection criteria.
3 Views:
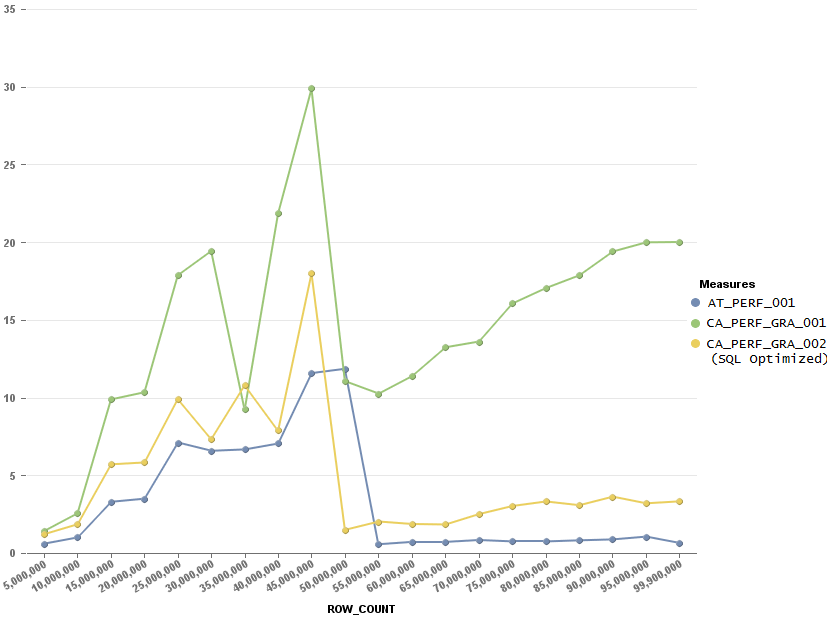
1) AT_PERF_001 Attribute View (JOIN Engine) joining all 3 tables [Heresy some people will say, but HANA didn't stop me :smile: ]
2) CA_PERF_GRA_001 Calculation View (Calculation Engine) joining all 3 tables
3) CA_PERF_GRA_002 Calculation View joining all 3 tables with the following setting:
NOTE: Analytic view can't be used because values/measures are on more than 1 table. There is quite a few other ways I could have done these joins but I thought this was a good start, but if you think you can build a faster model then look at my example below and please try it out and provide feedback.
3 Procedures:
1) PERF_GEN_CHUNK randomly generates test data for the 3 tables (e.g. 100k rows in X, 100k in Y, 10k in Z)
2) PERF_GET_REPORT_STATS executes the 3 queries and captures their runtime results in table PERF_RESULTS
Execute query aggregates SUM( XVAL) & SUM(YVAL) and is executed 3 times with different WHERE clause
a) NO Where Clause
b) WHERE Z TABLE.ZARG = 'Z01' (of ~10 possible values) [Restriction is in last Join Table]
c) WHERE X TABLE.XARG = 'X050' (of ~100 possible values) [Restriction is in first Join Table]
3) PERF_SCALE_TEST which provides input parameter to choose how much data to generate, then executes loops executing 1) & 2)
Run the Test:
I then ran PERF_SCALE_TEST 99 times to generate 99Million rows in Table X, Table Y and 10m in Table X.
I ran as follows:
call PERF_SCALE_TEST(10,10,'YES',1);
-- Parameters Explained( 10: Loop 10 times: Run Reports on 10th iteration, YES: Delete tables,1: iteration number) -- Loads first Million
call PERF_SCALE_TEST(10,10,'NO',11); -- Loads second Million
call PERF_SCALE_TEST(10,10,'NO',21); -- Loads third Million
.....
call PERF_SCALE_TEST(9,9,'NO',991); -- Loads 99th Million
NOTE: Hana Studio auto commit was switched off, and merge delta executed between each CALL statement. Commit & Merge Delta inside Procedure seemed to have NO effect and blew out run times.
Query Test Results [HANA REV 67 - Tables all on same node / NO PARTITIONING]:
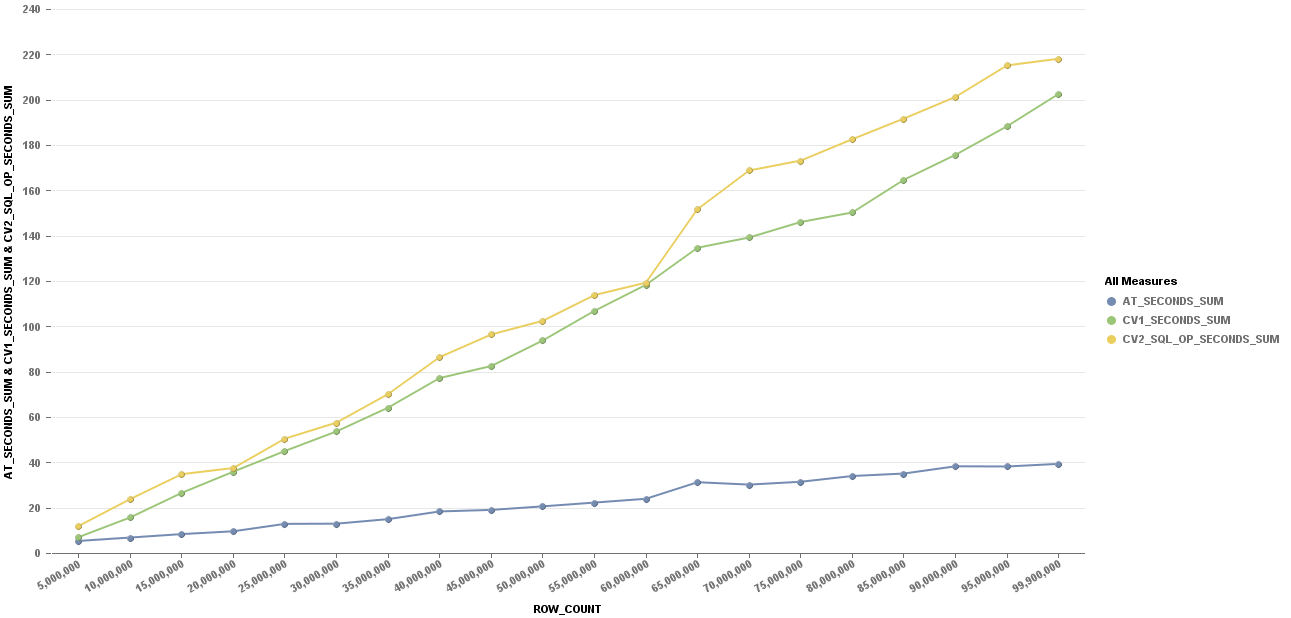
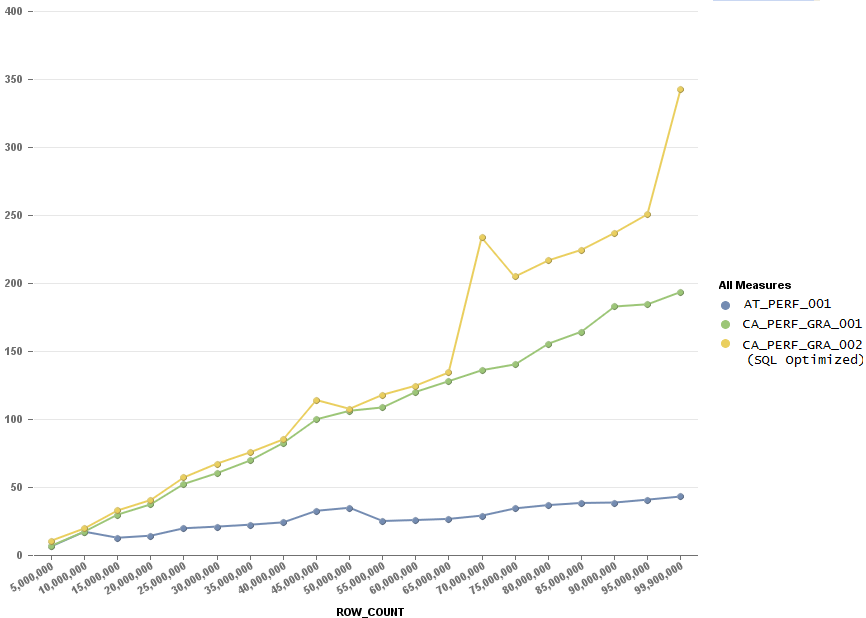
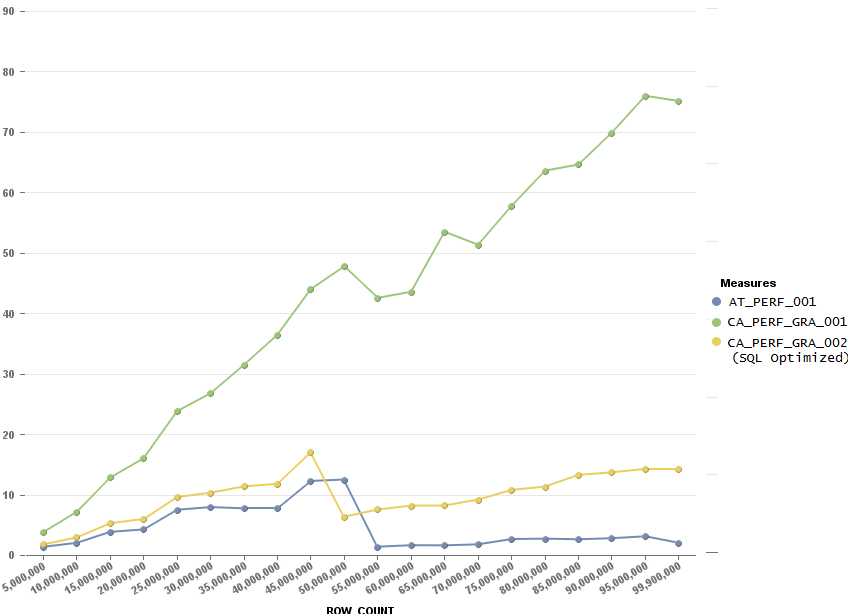
The following graphs show the impact of different query run-times as data grows in the tables.
NO Where Restriction (Run-time in Seconds)
Where ZARG = 'Z050' (Run-time in Seconds)
Where XARG = 'X01' (Run-time in Seconds)
NOTE: Loading the 99 million records with the Procedure took approx 7 hours. During the load of the first 55 Million records the Node used was actively being used by others. I've re-run during a quiet period and you see a much more uniform line up to 55Million rows, but I thought including the graphs with heavy usage during the 1st half of the load was more dramatic and shows how system load can impact run-time differently as well.
If you want to see the graphs with minimal other processes running then see
https://docs.google.com/document/d/1SjMxxPsx-v6RAHMj_M_X9c0e6OqdshIeCsHC-_8WIus/edit?usp=sharing
All the SQL Code for creating this data and executing the queries is supplied here:
https://docs.google.com/document/d/1Ep89BtWhdgUagTLiPkAFd66wgKVtwcy5_Pg8xe_i31I/edit?usp=sharing
The detailed test results for the above graphs are available here:
https://docs.google.com/spreadsheet/ccc?key=0Ahydpie8Km_fdEpBOERmZXpDNGtTZFRfSmtNZXhOTnc&usp=sharing
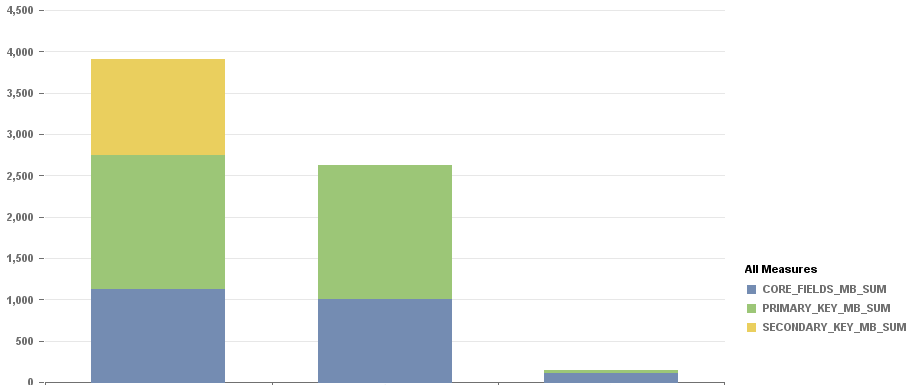
As an additional observation the memory usage of the tables are:
Memory usage (MB) of 100 Million Rows in Table X & Y
Table X Table Y Table Z
100m 100m 10m
These size stats are taken from M_CS_ALL_COULMNS:
CORE FIELDS (internal_attribute_type is null)
PRIMARY KEY (internal_attribute_type in ('TREX_EXTERNAL_KEY','TREX_UDIV','ROWID')
SECONDARY KEY (internal_attribute_type = 'ROWID')
It's interesting that the Primary Key (plus a few other HANA system fields) and the Seconday Key (created by HANA automatically to support the Join between NON-KEY fields in Table X with Key Fields in Table Y) take up more than 1/2 of the memory used by Table X & Y.
For more detailed explanation of M_CS_ALL_COLUMNS and how joins on NON Keys fields impact memory see Lars Breddemann 's excellent blog "Playing with SAP HANA" http://scn.sap.com/docs/DOC-46329
Summary:
So if you are lucky and the tables you need to join just happen to look exactly like Table X, Y & Z and your data set is similar then you now know which way to model your joins: Attribute Views Won. [But wait isn't that just meant for master data joins? It felt so wrong to use but it worked so well]
In the more likely event that the tables you need to join, in the real world, are different from my examples then just consider that there is always more than one way to do the joins, and your choice may need to change as data volumes increase.
- SAP Managed Tags:
- SAP HANA
2 Comments
You must be a registered user to add a comment. If you've already registered, sign in. Otherwise, register and sign in.
Labels in this area
-
"automatische backups"
1 -
"regelmäßige sicherung"
1 -
"TypeScript" "Development" "FeedBack"
1 -
505 Technology Updates 53
1 -
ABAP
14 -
ABAP API
1 -
ABAP CDS Views
2 -
ABAP CDS Views - BW Extraction
1 -
ABAP CDS Views - CDC (Change Data Capture)
1 -
ABAP class
2 -
ABAP Cloud
2 -
ABAP Development
5 -
ABAP in Eclipse
1 -
ABAP Platform Trial
1 -
ABAP Programming
2 -
abap technical
1 -
absl
2 -
access data from SAP Datasphere directly from Snowflake
1 -
Access data from SAP datasphere to Qliksense
1 -
Accrual
1 -
action
1 -
adapter modules
1 -
Addon
1 -
Adobe Document Services
1 -
ADS
1 -
ADS Config
1 -
ADS with ABAP
1 -
ADS with Java
1 -
ADT
2 -
Advance Shipping and Receiving
1 -
Advanced Event Mesh
3 -
AEM
1 -
AI
7 -
AI Launchpad
1 -
AI Projects
1 -
AIML
9 -
Alert in Sap analytical cloud
1 -
Amazon S3
1 -
Analytical Dataset
1 -
Analytical Model
1 -
Analytics
1 -
Analyze Workload Data
1 -
annotations
1 -
API
1 -
API and Integration
3 -
API Call
2 -
Application Architecture
1 -
Application Development
5 -
Application Development for SAP HANA Cloud
3 -
Applications and Business Processes (AP)
1 -
Artificial Intelligence
1 -
Artificial Intelligence (AI)
5 -
Artificial Intelligence (AI) 1 Business Trends 363 Business Trends 8 Digital Transformation with Cloud ERP (DT) 1 Event Information 462 Event Information 15 Expert Insights 114 Expert Insights 76 Life at SAP 418 Life at SAP 1 Product Updates 4
1 -
Artificial Intelligence (AI) blockchain Data & Analytics
1 -
Artificial Intelligence (AI) blockchain Data & Analytics Intelligent Enterprise
1 -
Artificial Intelligence (AI) blockchain Data & Analytics Intelligent Enterprise Oil Gas IoT Exploration Production
1 -
Artificial Intelligence (AI) blockchain Data & Analytics Intelligent Enterprise sustainability responsibility esg social compliance cybersecurity risk
1 -
ASE
1 -
ASR
2 -
ASUG
1 -
Attachments
1 -
Authorisations
1 -
Automating Processes
1 -
Automation
2 -
aws
2 -
Azure
1 -
Azure AI Studio
1 -
B2B Integration
1 -
Backorder Processing
1 -
Backup
1 -
Backup and Recovery
1 -
Backup schedule
1 -
BADI_MATERIAL_CHECK error message
1 -
Bank
1 -
BAS
1 -
basis
2 -
Basis Monitoring & Tcodes with Key notes
2 -
Batch Management
1 -
BDC
1 -
Best Practice
1 -
bitcoin
1 -
Blockchain
3 -
bodl
1 -
BOP in aATP
1 -
BOP Segments
1 -
BOP Strategies
1 -
BOP Variant
1 -
BPC
1 -
BPC LIVE
1 -
BTP
12 -
BTP Destination
2 -
Business AI
1 -
Business and IT Integration
1 -
Business application stu
1 -
Business Application Studio
1 -
Business Architecture
1 -
Business Communication Services
1 -
Business Continuity
1 -
Business Data Fabric
3 -
Business Partner
12 -
Business Partner Master Data
10 -
Business Technology Platform
2 -
Business Trends
4 -
CA
1 -
calculation view
1 -
CAP
3 -
Capgemini
1 -
CAPM
1 -
Catalyst for Efficiency: Revolutionizing SAP Integration Suite with Artificial Intelligence (AI) and
1 -
CCMS
2 -
CDQ
12 -
CDS
2 -
Cental Finance
1 -
Certificates
1 -
CFL
1 -
Change Management
1 -
chatbot
1 -
chatgpt
3 -
CL_SALV_TABLE
2 -
Class Runner
1 -
Classrunner
1 -
Cloud ALM Monitoring
1 -
Cloud ALM Operations
1 -
cloud connector
1 -
Cloud Extensibility
1 -
Cloud Foundry
4 -
Cloud Integration
6 -
Cloud Platform Integration
2 -
cloudalm
1 -
communication
1 -
Compensation Information Management
1 -
Compensation Management
1 -
Compliance
1 -
Compound Employee API
1 -
Configuration
1 -
Connectors
1 -
Consolidation Extension for SAP Analytics Cloud
2 -
Control Indicators.
1 -
Controller-Service-Repository pattern
1 -
Conversion
1 -
Cosine similarity
1 -
cryptocurrency
1 -
CSI
1 -
ctms
1 -
Custom chatbot
3 -
Custom Destination Service
1 -
custom fields
1 -
Customer Experience
1 -
Customer Journey
1 -
Customizing
1 -
cyber security
3 -
cybersecurity
1 -
Data
1 -
Data & Analytics
1 -
Data Aging
1 -
Data Analytics
2 -
Data and Analytics (DA)
1 -
Data Archiving
1 -
Data Back-up
1 -
Data Flow
1 -
Data Governance
5 -
Data Integration
2 -
Data Quality
12 -
Data Quality Management
12 -
Data Synchronization
1 -
data transfer
1 -
Data Unleashed
1 -
Data Value
8 -
database tables
1 -
Datasphere
3 -
datenbanksicherung
1 -
dba cockpit
1 -
dbacockpit
1 -
Debugging
2 -
Delimiting Pay Components
1 -
Delta Integrations
1 -
Destination
3 -
Destination Service
1 -
Developer extensibility
1 -
Developing with SAP Integration Suite
1 -
Devops
1 -
digital transformation
1 -
Documentation
1 -
Dot Product
1 -
DQM
1 -
dump database
1 -
dump transaction
1 -
e-Invoice
1 -
E4H Conversion
1 -
Eclipse ADT ABAP Development Tools
2 -
edoc
1 -
edocument
1 -
ELA
1 -
Embedded Consolidation
1 -
Embedding
1 -
Embeddings
1 -
Employee Central
1 -
Employee Central Payroll
1 -
Employee Central Time Off
1 -
Employee Information
1 -
Employee Rehires
1 -
Enable Now
1 -
Enable now manager
1 -
endpoint
1 -
Enhancement Request
1 -
Enterprise Architecture
1 -
ETL Business Analytics with SAP Signavio
1 -
Euclidean distance
1 -
Event Dates
1 -
Event Driven Architecture
1 -
Event Mesh
2 -
Event Reason
1 -
EventBasedIntegration
1 -
EWM
1 -
EWM Outbound configuration
1 -
EWM-TM-Integration
1 -
Existing Event Changes
1 -
Expand
1 -
Expert
2 -
Expert Insights
2 -
Exploits
1 -
Fiori
14 -
Fiori Elements
2 -
Fiori SAPUI5
12 -
Flask
1 -
Full Stack
8 -
Funds Management
1 -
General
1 -
General Splitter
1 -
Generative AI
1 -
Getting Started
1 -
GitHub
8 -
Grants Management
1 -
GraphQL
1 -
groovy
1 -
GTP
1 -
HANA
6 -
HANA Cloud
2 -
Hana Cloud Database Integration
2 -
HANA DB
2 -
HANA XS Advanced
1 -
Historical Events
1 -
home labs
1 -
HowTo
1 -
HR Data Management
1 -
html5
8 -
HTML5 Application
1 -
Identity cards validation
1 -
idm
1 -
Implementation
1 -
input parameter
1 -
instant payments
1 -
Integration
3 -
Integration Advisor
1 -
Integration Architecture
1 -
Integration Center
1 -
Integration Suite
1 -
intelligent enterprise
1 -
iot
1 -
Java
1 -
job
1 -
Job Information Changes
1 -
Job-Related Events
1 -
Job_Event_Information
1 -
joule
4 -
Journal Entries
1 -
Just Ask
1 -
Kerberos for ABAP
8 -
Kerberos for JAVA
8 -
KNN
1 -
Launch Wizard
1 -
Learning Content
2 -
Life at SAP
5 -
lightning
1 -
Linear Regression SAP HANA Cloud
1 -
Loading Indicator
1 -
local tax regulations
1 -
LP
1 -
Machine Learning
2 -
Marketing
1 -
Master Data
3 -
Master Data Management
14 -
Maxdb
2 -
MDG
1 -
MDGM
1 -
MDM
1 -
Message box.
1 -
Messages on RF Device
1 -
Microservices Architecture
1 -
Microsoft Universal Print
1 -
Middleware Solutions
1 -
Migration
5 -
ML Model Development
1 -
Modeling in SAP HANA Cloud
8 -
Monitoring
3 -
MTA
1 -
Multi-Record Scenarios
1 -
Multiple Event Triggers
1 -
Myself Transformation
1 -
Neo
1 -
New Event Creation
1 -
New Feature
1 -
Newcomer
1 -
NodeJS
2 -
ODATA
2 -
OData APIs
1 -
odatav2
1 -
ODATAV4
1 -
ODBC
1 -
ODBC Connection
1 -
Onpremise
1 -
open source
2 -
OpenAI API
1 -
Oracle
1 -
PaPM
1 -
PaPM Dynamic Data Copy through Writer function
1 -
PaPM Remote Call
1 -
PAS-C01
1 -
Pay Component Management
1 -
PGP
1 -
Pickle
1 -
PLANNING ARCHITECTURE
1 -
Popup in Sap analytical cloud
1 -
PostgrSQL
1 -
POSTMAN
1 -
Process Automation
2 -
Product Updates
4 -
PSM
1 -
Public Cloud
1 -
Python
4 -
Qlik
1 -
Qualtrics
1 -
RAP
3 -
RAP BO
2 -
Record Deletion
1 -
Recovery
1 -
recurring payments
1 -
redeply
1 -
Release
1 -
Remote Consumption Model
1 -
Replication Flows
1 -
research
1 -
Resilience
1 -
REST
1 -
REST API
2 -
Retagging Required
1 -
Risk
1 -
Rolling Kernel Switch
1 -
route
1 -
rules
1 -
S4 HANA
1 -
S4 HANA Cloud
1 -
S4 HANA On-Premise
1 -
S4HANA
3 -
S4HANA_OP_2023
2 -
SAC
10 -
SAC PLANNING
9 -
SAP
4 -
SAP ABAP
1 -
SAP Advanced Event Mesh
1 -
SAP AI Core
8 -
SAP AI Launchpad
8 -
SAP Analytic Cloud Compass
1 -
Sap Analytical Cloud
1 -
SAP Analytics Cloud
4 -
SAP Analytics Cloud for Consolidation
3 -
SAP Analytics Cloud Story
1 -
SAP analytics clouds
1 -
SAP BAS
1 -
SAP Basis
6 -
SAP BODS
1 -
SAP BODS certification.
1 -
SAP BTP
21 -
SAP BTP Build Work Zone
2 -
SAP BTP Cloud Foundry
6 -
SAP BTP Costing
1 -
SAP BTP CTMS
1 -
SAP BTP Innovation
1 -
SAP BTP Migration Tool
1 -
SAP BTP SDK IOS
1 -
SAP Build
11 -
SAP Build App
1 -
SAP Build apps
1 -
SAP Build CodeJam
1 -
SAP Build Process Automation
3 -
SAP Build work zone
10 -
SAP Business Objects Platform
1 -
SAP Business Technology
2 -
SAP Business Technology Platform (XP)
1 -
sap bw
1 -
SAP CAP
2 -
SAP CDC
1 -
SAP CDP
1 -
SAP CDS VIEW
1 -
SAP Certification
1 -
SAP Cloud ALM
4 -
SAP Cloud Application Programming Model
1 -
SAP Cloud Integration for Data Services
1 -
SAP cloud platform
8 -
SAP Companion
1 -
SAP CPI
3 -
SAP CPI (Cloud Platform Integration)
2 -
SAP CPI Discover tab
1 -
sap credential store
1 -
SAP Customer Data Cloud
1 -
SAP Customer Data Platform
1 -
SAP Data Intelligence
1 -
SAP Data Migration in Retail Industry
1 -
SAP Data Services
1 -
SAP DATABASE
1 -
SAP Dataspher to Non SAP BI tools
1 -
SAP Datasphere
9 -
SAP DRC
1 -
SAP EWM
1 -
SAP Fiori
3 -
SAP Fiori App Embedding
1 -
Sap Fiori Extension Project Using BAS
1 -
SAP GRC
1 -
SAP HANA
1 -
SAP HCM (Human Capital Management)
1 -
SAP HR Solutions
1 -
SAP IDM
1 -
SAP Integration Suite
9 -
SAP Integrations
4 -
SAP iRPA
2 -
SAP LAGGING AND SLOW
1 -
SAP Learning Class
1 -
SAP Learning Hub
1 -
SAP Odata
2 -
SAP on Azure
1 -
SAP PartnerEdge
1 -
sap partners
1 -
SAP Password Reset
1 -
SAP PO Migration
1 -
SAP Prepackaged Content
1 -
SAP Process Automation
2 -
SAP Process Integration
2 -
SAP Process Orchestration
1 -
SAP S4HANA
2 -
SAP S4HANA Cloud
1 -
SAP S4HANA Cloud for Finance
1 -
SAP S4HANA Cloud private edition
1 -
SAP Sandbox
1 -
SAP STMS
1 -
SAP successfactors
3 -
SAP SuccessFactors HXM Core
1 -
SAP Time
1 -
SAP TM
2 -
SAP Trading Partner Management
1 -
SAP UI5
1 -
SAP Upgrade
1 -
SAP Utilities
1 -
SAP-GUI
8 -
SAP_COM_0276
1 -
SAPBTP
1 -
SAPCPI
1 -
SAPEWM
1 -
sapmentors
1 -
saponaws
2 -
SAPS4HANA
1 -
SAPUI5
5 -
schedule
1 -
Script Operator
1 -
Secure Login Client Setup
8 -
security
9 -
Selenium Testing
1 -
Self Transformation
1 -
Self-Transformation
1 -
SEN
1 -
SEN Manager
1 -
service
1 -
SET_CELL_TYPE
1 -
SET_CELL_TYPE_COLUMN
1 -
SFTP scenario
2 -
Simplex
1 -
Single Sign On
8 -
Singlesource
1 -
SKLearn
1 -
Slow loading
1 -
soap
1 -
Software Development
1 -
SOLMAN
1 -
solman 7.2
2 -
Solution Manager
3 -
sp_dumpdb
1 -
sp_dumptrans
1 -
SQL
1 -
sql script
1 -
SSL
8 -
SSO
8 -
Substring function
1 -
SuccessFactors
1 -
SuccessFactors Platform
1 -
SuccessFactors Time Tracking
1 -
Sybase
1 -
system copy method
1 -
System owner
1 -
Table splitting
1 -
Tax Integration
1 -
Technical article
1 -
Technical articles
1 -
Technology Updates
14 -
Technology Updates
1 -
Technology_Updates
1 -
terraform
1 -
Threats
2 -
Time Collectors
1 -
Time Off
2 -
Time Sheet
1 -
Time Sheet SAP SuccessFactors Time Tracking
1 -
Tips and tricks
2 -
toggle button
1 -
Tools
1 -
Trainings & Certifications
1 -
Transformation Flow
1 -
Transport in SAP BODS
1 -
Transport Management
1 -
TypeScript
2 -
ui designer
1 -
unbind
1 -
Unified Customer Profile
1 -
UPB
1 -
Use of Parameters for Data Copy in PaPM
1 -
User Unlock
1 -
VA02
1 -
Validations
1 -
Vector Database
2 -
Vector Engine
1 -
Visual Studio Code
1 -
VSCode
1 -
Vulnerabilities
1 -
Web SDK
1 -
work zone
1 -
workload
1 -
xsa
1 -
XSA Refresh
1
- « Previous
- Next »
Related Content
- SAP Datasphere Catalogue in Technology Q&A
- How to develop on SAP S/4 HANA in Technology Blogs by Members
- Unveiling SAP BusinessObjects BI 4.3 SP04 ! in Technology Blogs by SAP
- XSA Blog Series - Virtual modeling in Technology Blogs by Members
- Sap Datasphere Data Flow Series – Script Operator Part 1 in Technology Blogs by Members
Top kudoed authors
| User | Count |
|---|---|
| 8 | |
| 5 | |
| 5 | |
| 4 | |
| 4 | |
| 4 | |
| 4 | |
| 4 | |
| 3 | |
| 3 |