
- SAP Community
- Products and Technology
- Technology
- Technology Blogs by Members
- Internal marketing efforts - promoting your BI
Technology Blogs by Members
Explore a vibrant mix of technical expertise, industry insights, and tech buzz in member blogs covering SAP products, technology, and events. Get in the mix!
Turn on suggestions
Auto-suggest helps you quickly narrow down your search results by suggesting possible matches as you type.
Showing results for
MGrob
Active Contributor
Options
- Subscribe to RSS Feed
- Mark as New
- Mark as Read
- Bookmark
- Subscribe
- Printer Friendly Page
- Report Inappropriate Content
09-05-2013
5:18 PM
In my last blog, I described some of the most important milestones in developing and implementing a BI solution that not just functions with integrity, but also becomes known, used and respected across your whole organization.
Unless you are a BI strategy consultant the following points often get neglected, or are not part of any workpackages of a "classic" BI developer. Nevertheless, marketing is quite an important piece, especially if you try to get budget approved and you are internally responsible for BI.
Once you and your team have completed the identity component of the process (see chapter identity) and found a logo and an acronym for your BI landscape, it is important to make sure all your communication is branded with your BI department logo / sign. In our case all of our communication associated with the tool contains the same eye that defines our BI logo (also found within the tool itself).
Now you may be wondering how to effectively market your BI tool? How do you get your BI user community take notice of your solution and also instantly recognize that the output is from your tool?
Marketing to achieve user "buy-in" and widespread acceptance/adoption is just as important as ease-of-use and data integrity. This is especially important if you are trying to build a successful solution at the headquarter level and some of your local entities already have a local, functioning solution (probably even with the same product). Don't underestimate the need to separate your tool from the others, making it unique and recognizable. All promotion pieces need to be connected with your BI solution - cohesive branding through consistent messaging and reuse of key visual images/phrases is key to achieve your goal of being the "go-to" tool for information.
There are 5 instruments as part of our strategies we currently use.
Newsletters
Create regular newsletters with your BI branded design.
Inform your community on a regular basis - they will receive a newsletter from your department - and deliver the newsletters when promised! Use these communications to explain any significant planned changes, but also highlight what is new and improved in your BI application, based on the latest feedback you received from key stakeholders. Providing a lookout on upcoming improvements or recently answered business questions, connects you to your users and the newsletter almost becomes a two-way dialogue. Think of your audience! These type of updates should not necessarily be written from a "technical-only" perspective, but from a business enduser standpoint. Your job is to ensure their questions are answered. If your BI department is not sitting within the finance group or any other active business department, have someone closer to business needs of your organization and gear your newsletter to address those needs.
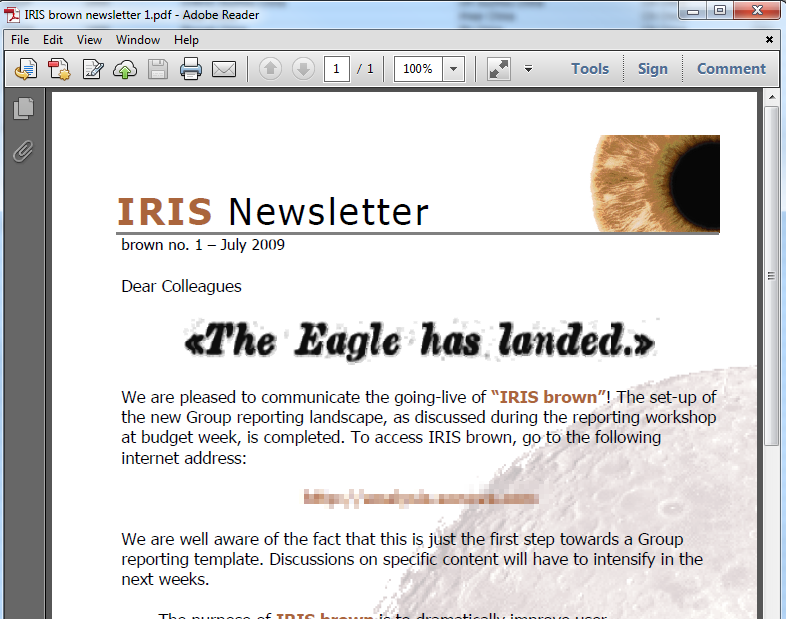
First ever sent newsletter communicating the golive of our platform.
Give-Aways
Loyalty programs, contents and prize-driven promotions are everywhere these days because they work! The effort of making something people can take with them is time well spent when it is done properly. It doesn't have to complex - but can be as simple as creating a "give away" card with some of the most important BI navigation steps explained in a unique or clever way. We created a "safety on board" card (mirroring those found on planes) that was printed on the same flame-retardant used for actual in-flight cards. They now regularly appear on a lot our users desks. Not only were they a source of ongoing promotion of the tool, but they have almost turned into a collector's item as everyone wanted to have one!
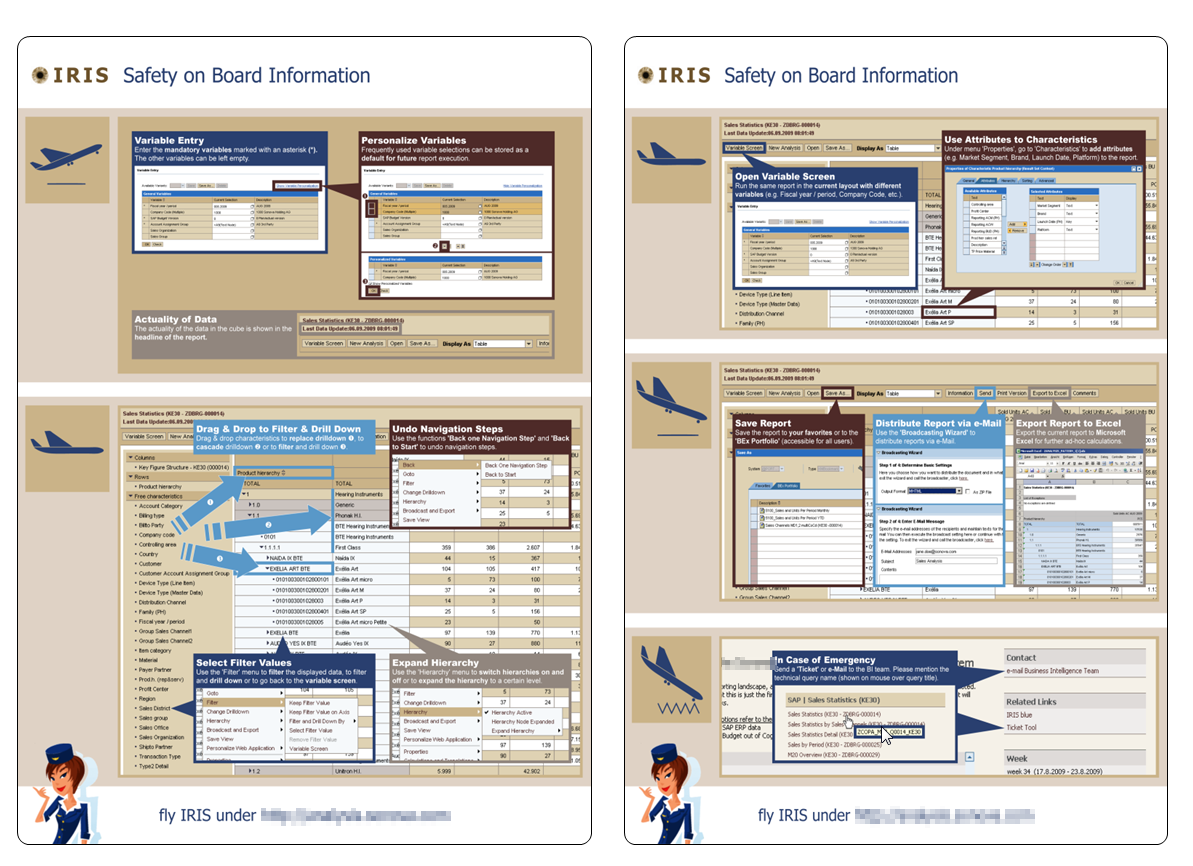
We had a lot of fun creating this one.. :smile:
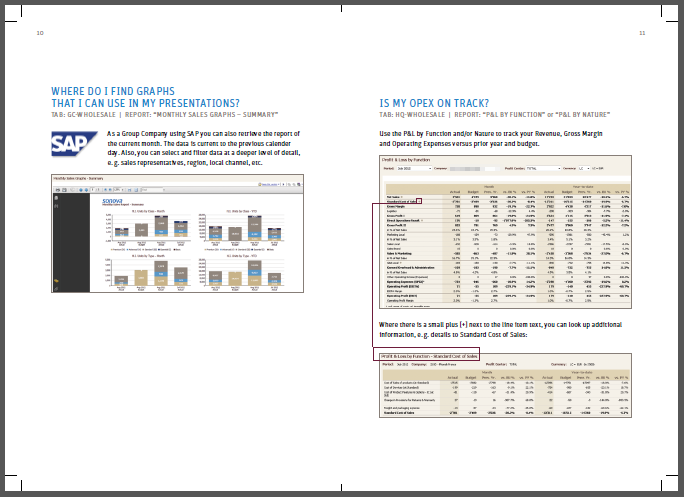
Management Booklet
Information needs must be addressed differently, depending on the profile of the various stakeholders. Top management often likes to receive information in a polished and "high glossy" way. With limited time and competing demands for attention, solutions must be presented at an appropriately high level and contain only the relevant information needed to address their immediate request or present information needs. That is not to discount the need and importance of long term BI strategy discussions and planning meetings with Senior Management, (another point in this blog) however, here I am focusing on routine communications and marketing initiatives.

For example, we designed a booklet and had it printed professionally for senior management. The booklet had limited introduction content, but instead was written as a series of questions and answers, designed to help them find the information they need on a day-to-day business. We explained answers to questions such as "where do I find my sales to operating expenses ratio?" which is a KPI that is regularly monitored or "where is the report we use for the monthly sales performance call?" These questions were designed to be directly applicable to the management group and explained in simple steps where they could find the relevant reports in our BI, as we have standardized formatted reports for this group. With management empowered with a tool to help them obtain their own reports, the management group use of the system (and thus system "buy-in") dramatically improved. In general, there is no self service BI or BEx reporting for top management as it has not been designed for use at that level.
You don't want to go down that road and try to explain C-level members what they need to select and filter to get the desired figures. Most often their attention would be long gone by then.
WIKI and Report Definitions
With easy access to sharepoint linked into our solution, the analytics user group can access all of the KPI definitions. This is efficient for both the user and the BI team, as it solves many questions before they even reach your BI team. When a user is unclear between what (for example) is the difference between Net and Gross sales? A quick click on the key figure text and it pulls both the definition and all of the restrictions that are applied in the background.

Similarly, with access to the report definitions endusers can easily lookup each characteristic that is available - including origin and how they are filtered. Also the report explains the business purpose and describes the report target group and how frequently the cycle the update occurs.
One last point I'm not elaborating further here are the good training document/material for your "BI self service" user group. This to avoid the question if BI self service is a really good thing.
thanks for reading
Martin
(c) by the author on all screenshots
- SAP Managed Tags:
- SAP BusinessObjects Business Intelligence platform
34 Comments
You must be a registered user to add a comment. If you've already registered, sign in. Otherwise, register and sign in.
Labels in this area
-
"automatische backups"
1 -
"regelmäßige sicherung"
1 -
"TypeScript" "Development" "FeedBack"
1 -
505 Technology Updates 53
1 -
ABAP
14 -
ABAP API
1 -
ABAP CDS Views
2 -
ABAP CDS Views - BW Extraction
1 -
ABAP CDS Views - CDC (Change Data Capture)
1 -
ABAP class
2 -
ABAP Cloud
2 -
ABAP Development
5 -
ABAP in Eclipse
1 -
ABAP Platform Trial
1 -
ABAP Programming
2 -
abap technical
1 -
absl
1 -
access data from SAP Datasphere directly from Snowflake
1 -
Access data from SAP datasphere to Qliksense
1 -
Accrual
1 -
action
1 -
adapter modules
1 -
Addon
1 -
Adobe Document Services
1 -
ADS
1 -
ADS Config
1 -
ADS with ABAP
1 -
ADS with Java
1 -
ADT
2 -
Advance Shipping and Receiving
1 -
Advanced Event Mesh
3 -
AEM
1 -
AI
7 -
AI Launchpad
1 -
AI Projects
1 -
AIML
9 -
Alert in Sap analytical cloud
1 -
Amazon S3
1 -
Analytical Dataset
1 -
Analytical Model
1 -
Analytics
1 -
Analyze Workload Data
1 -
annotations
1 -
API
1 -
API and Integration
3 -
API Call
2 -
Application Architecture
1 -
Application Development
5 -
Application Development for SAP HANA Cloud
3 -
Applications and Business Processes (AP)
1 -
Artificial Intelligence
1 -
Artificial Intelligence (AI)
4 -
Artificial Intelligence (AI) 1 Business Trends 363 Business Trends 8 Digital Transformation with Cloud ERP (DT) 1 Event Information 462 Event Information 15 Expert Insights 114 Expert Insights 76 Life at SAP 418 Life at SAP 1 Product Updates 4
1 -
Artificial Intelligence (AI) blockchain Data & Analytics
1 -
Artificial Intelligence (AI) blockchain Data & Analytics Intelligent Enterprise
1 -
Artificial Intelligence (AI) blockchain Data & Analytics Intelligent Enterprise Oil Gas IoT Exploration Production
1 -
Artificial Intelligence (AI) blockchain Data & Analytics Intelligent Enterprise sustainability responsibility esg social compliance cybersecurity risk
1 -
ASE
1 -
ASR
2 -
ASUG
1 -
Attachments
1 -
Authorisations
1 -
Automating Processes
1 -
Automation
1 -
aws
2 -
Azure
1 -
Azure AI Studio
1 -
B2B Integration
1 -
Backorder Processing
1 -
Backup
1 -
Backup and Recovery
1 -
Backup schedule
1 -
BADI_MATERIAL_CHECK error message
1 -
Bank
1 -
BAS
1 -
basis
2 -
Basis Monitoring & Tcodes with Key notes
2 -
Batch Management
1 -
BDC
1 -
Best Practice
1 -
bitcoin
1 -
Blockchain
3 -
BOP in aATP
1 -
BOP Segments
1 -
BOP Strategies
1 -
BOP Variant
1 -
BPC
1 -
BPC LIVE
1 -
BTP
11 -
BTP Destination
2 -
Business AI
1 -
Business and IT Integration
1 -
Business application stu
1 -
Business Application Studio
1 -
Business Architecture
1 -
Business Communication Services
1 -
Business Continuity
1 -
Business Data Fabric
3 -
Business Partner
12 -
Business Partner Master Data
10 -
Business Technology Platform
2 -
Business Trends
1 -
CA
1 -
calculation view
1 -
CAP
3 -
Capgemini
1 -
CAPM
1 -
Catalyst for Efficiency: Revolutionizing SAP Integration Suite with Artificial Intelligence (AI) and
1 -
CCMS
2 -
CDQ
12 -
CDS
2 -
Cental Finance
1 -
Certificates
1 -
CFL
1 -
Change Management
1 -
chatbot
1 -
chatgpt
3 -
CL_SALV_TABLE
2 -
Class Runner
1 -
Classrunner
1 -
Cloud ALM Monitoring
1 -
Cloud ALM Operations
1 -
cloud connector
1 -
Cloud Extensibility
1 -
Cloud Foundry
4 -
Cloud Integration
6 -
Cloud Platform Integration
2 -
cloudalm
1 -
communication
1 -
Compensation Information Management
1 -
Compensation Management
1 -
Compliance
1 -
Compound Employee API
1 -
Configuration
1 -
Connectors
1 -
Consolidation Extension for SAP Analytics Cloud
1 -
Controller-Service-Repository pattern
1 -
Conversion
1 -
Cosine similarity
1 -
cryptocurrency
1 -
CSI
1 -
ctms
1 -
Custom chatbot
3 -
Custom Destination Service
1 -
custom fields
1 -
Customer Experience
1 -
Customer Journey
1 -
Customizing
1 -
Cyber Security
2 -
Data
1 -
Data & Analytics
1 -
Data Aging
1 -
Data Analytics
2 -
Data and Analytics (DA)
1 -
Data Archiving
1 -
Data Back-up
1 -
Data Governance
5 -
Data Integration
2 -
Data Quality
12 -
Data Quality Management
12 -
Data Synchronization
1 -
data transfer
1 -
Data Unleashed
1 -
Data Value
8 -
database tables
1 -
Datasphere
2 -
datenbanksicherung
1 -
dba cockpit
1 -
dbacockpit
1 -
Debugging
2 -
Delimiting Pay Components
1 -
Delta Integrations
1 -
Destination
3 -
Destination Service
1 -
Developer extensibility
1 -
Developing with SAP Integration Suite
1 -
Devops
1 -
digital transformation
1 -
Documentation
1 -
Dot Product
1 -
DQM
1 -
dump database
1 -
dump transaction
1 -
e-Invoice
1 -
E4H Conversion
1 -
Eclipse ADT ABAP Development Tools
2 -
edoc
1 -
edocument
1 -
ELA
1 -
Embedded Consolidation
1 -
Embedding
1 -
Embeddings
1 -
Employee Central
1 -
Employee Central Payroll
1 -
Employee Central Time Off
1 -
Employee Information
1 -
Employee Rehires
1 -
Enable Now
1 -
Enable now manager
1 -
endpoint
1 -
Enhancement Request
1 -
Enterprise Architecture
1 -
ETL Business Analytics with SAP Signavio
1 -
Euclidean distance
1 -
Event Dates
1 -
Event Driven Architecture
1 -
Event Mesh
2 -
Event Reason
1 -
EventBasedIntegration
1 -
EWM
1 -
EWM Outbound configuration
1 -
EWM-TM-Integration
1 -
Existing Event Changes
1 -
Expand
1 -
Expert
2 -
Expert Insights
1 -
Fiori
14 -
Fiori Elements
2 -
Fiori SAPUI5
12 -
Flask
1 -
Full Stack
8 -
Funds Management
1 -
General
1 -
Generative AI
1 -
Getting Started
1 -
GitHub
8 -
Grants Management
1 -
groovy
1 -
GTP
1 -
HANA
5 -
HANA Cloud
2 -
Hana Cloud Database Integration
2 -
HANA DB
1 -
HANA XS Advanced
1 -
Historical Events
1 -
home labs
1 -
HowTo
1 -
HR Data Management
1 -
html5
8 -
HTML5 Application
1 -
Identity cards validation
1 -
idm
1 -
Implementation
1 -
input parameter
1 -
instant payments
1 -
Integration
3 -
Integration Advisor
1 -
Integration Architecture
1 -
Integration Center
1 -
Integration Suite
1 -
intelligent enterprise
1 -
Java
1 -
job
1 -
Job Information Changes
1 -
Job-Related Events
1 -
Job_Event_Information
1 -
joule
4 -
Journal Entries
1 -
Just Ask
1 -
Kerberos for ABAP
8 -
Kerberos for JAVA
8 -
Launch Wizard
1 -
Learning Content
2 -
Life at SAP
1 -
lightning
1 -
Linear Regression SAP HANA Cloud
1 -
local tax regulations
1 -
LP
1 -
Machine Learning
2 -
Marketing
1 -
Master Data
3 -
Master Data Management
14 -
Maxdb
2 -
MDG
1 -
MDGM
1 -
MDM
1 -
Message box.
1 -
Messages on RF Device
1 -
Microservices Architecture
1 -
Microsoft Universal Print
1 -
Middleware Solutions
1 -
Migration
5 -
ML Model Development
1 -
Modeling in SAP HANA Cloud
8 -
Monitoring
3 -
MTA
1 -
Multi-Record Scenarios
1 -
Multiple Event Triggers
1 -
Neo
1 -
New Event Creation
1 -
New Feature
1 -
Newcomer
1 -
NodeJS
2 -
ODATA
2 -
OData APIs
1 -
odatav2
1 -
ODATAV4
1 -
ODBC
1 -
ODBC Connection
1 -
Onpremise
1 -
open source
2 -
OpenAI API
1 -
Oracle
1 -
PaPM
1 -
PaPM Dynamic Data Copy through Writer function
1 -
PaPM Remote Call
1 -
PAS-C01
1 -
Pay Component Management
1 -
PGP
1 -
Pickle
1 -
PLANNING ARCHITECTURE
1 -
Popup in Sap analytical cloud
1 -
PostgrSQL
1 -
POSTMAN
1 -
Process Automation
2 -
Product Updates
4 -
PSM
1 -
Public Cloud
1 -
Python
4 -
Qlik
1 -
Qualtrics
1 -
RAP
3 -
RAP BO
2 -
Record Deletion
1 -
Recovery
1 -
recurring payments
1 -
redeply
1 -
Release
1 -
Remote Consumption Model
1 -
Replication Flows
1 -
Research
1 -
Resilience
1 -
REST
1 -
REST API
1 -
Retagging Required
1 -
Risk
1 -
Rolling Kernel Switch
1 -
route
1 -
rules
1 -
S4 HANA
1 -
S4 HANA Cloud
1 -
S4 HANA On-Premise
1 -
S4HANA
3 -
S4HANA_OP_2023
2 -
SAC
10 -
SAC PLANNING
9 -
SAP
4 -
SAP ABAP
1 -
SAP Advanced Event Mesh
1 -
SAP AI Core
8 -
SAP AI Launchpad
8 -
SAP Analytic Cloud Compass
1 -
Sap Analytical Cloud
1 -
SAP Analytics Cloud
4 -
SAP Analytics Cloud for Consolidation
2 -
SAP Analytics Cloud Story
1 -
SAP analytics clouds
1 -
SAP BAS
1 -
SAP Basis
6 -
SAP BODS
1 -
SAP BODS certification.
1 -
SAP BTP
20 -
SAP BTP Build Work Zone
2 -
SAP BTP Cloud Foundry
5 -
SAP BTP Costing
1 -
SAP BTP CTMS
1 -
SAP BTP Innovation
1 -
SAP BTP Migration Tool
1 -
SAP BTP SDK IOS
1 -
SAP Build
11 -
SAP Build App
1 -
SAP Build apps
1 -
SAP Build CodeJam
1 -
SAP Build Process Automation
3 -
SAP Build work zone
10 -
SAP Business Objects Platform
1 -
SAP Business Technology
2 -
SAP Business Technology Platform (XP)
1 -
sap bw
1 -
SAP CAP
2 -
SAP CDC
1 -
SAP CDP
1 -
SAP Certification
1 -
SAP Cloud ALM
4 -
SAP Cloud Application Programming Model
1 -
SAP Cloud Integration for Data Services
1 -
SAP cloud platform
8 -
SAP Companion
1 -
SAP CPI
3 -
SAP CPI (Cloud Platform Integration)
2 -
SAP CPI Discover tab
1 -
sap credential store
1 -
SAP Customer Data Cloud
1 -
SAP Customer Data Platform
1 -
SAP Data Intelligence
1 -
SAP Data Migration in Retail Industry
1 -
SAP Data Services
1 -
SAP DATABASE
1 -
SAP Dataspher to Non SAP BI tools
1 -
SAP Datasphere
9 -
SAP DRC
1 -
SAP EWM
1 -
SAP Fiori
2 -
SAP Fiori App Embedding
1 -
Sap Fiori Extension Project Using BAS
1 -
SAP GRC
1 -
SAP HANA
1 -
SAP HCM (Human Capital Management)
1 -
SAP HR Solutions
1 -
SAP IDM
1 -
SAP Integration Suite
9 -
SAP Integrations
4 -
SAP iRPA
2 -
SAP Learning Class
1 -
SAP Learning Hub
1 -
SAP Odata
2 -
SAP on Azure
1 -
SAP PartnerEdge
1 -
sap partners
1 -
SAP Password Reset
1 -
SAP PO Migration
1 -
SAP Prepackaged Content
1 -
SAP Process Automation
2 -
SAP Process Integration
2 -
SAP Process Orchestration
1 -
SAP S4HANA
2 -
SAP S4HANA Cloud
1 -
SAP S4HANA Cloud for Finance
1 -
SAP S4HANA Cloud private edition
1 -
SAP Sandbox
1 -
SAP STMS
1 -
SAP SuccessFactors
2 -
SAP SuccessFactors HXM Core
1 -
SAP Time
1 -
SAP TM
2 -
SAP Trading Partner Management
1 -
SAP UI5
1 -
SAP Upgrade
1 -
SAP-GUI
8 -
SAP_COM_0276
1 -
SAPBTP
1 -
SAPCPI
1 -
SAPEWM
1 -
sapmentors
1 -
saponaws
2 -
SAPUI5
4 -
schedule
1 -
Secure Login Client Setup
8 -
security
9 -
Selenium Testing
1 -
SEN
1 -
SEN Manager
1 -
service
1 -
SET_CELL_TYPE
1 -
SET_CELL_TYPE_COLUMN
1 -
SFTP scenario
2 -
Simplex
1 -
Single Sign On
8 -
Singlesource
1 -
SKLearn
1 -
soap
1 -
Software Development
1 -
SOLMAN
1 -
solman 7.2
2 -
Solution Manager
3 -
sp_dumpdb
1 -
sp_dumptrans
1 -
SQL
1 -
sql script
1 -
SSL
8 -
SSO
8 -
Substring function
1 -
SuccessFactors
1 -
SuccessFactors Time Tracking
1 -
Sybase
1 -
system copy method
1 -
System owner
1 -
Table splitting
1 -
Tax Integration
1 -
Technical article
1 -
Technical articles
1 -
Technology Updates
1 -
Technology Updates
1 -
Technology_Updates
1 -
Threats
1 -
Time Collectors
1 -
Time Off
2 -
Tips and tricks
2 -
Tools
1 -
Trainings & Certifications
1 -
Transport in SAP BODS
1 -
Transport Management
1 -
TypeScript
2 -
unbind
1 -
Unified Customer Profile
1 -
UPB
1 -
Use of Parameters for Data Copy in PaPM
1 -
User Unlock
1 -
VA02
1 -
Validations
1 -
Vector Database
1 -
Vector Engine
1 -
Visual Studio Code
1 -
VSCode
1 -
Web SDK
1 -
work zone
1 -
workload
1 -
xsa
1 -
XSA Refresh
1
- « Previous
- Next »
Related Content
- SAP Datasphere - Space, Data Integration, and Data Modeling Best Practices in Technology Blogs by SAP
- plug and gain 101: #3 What is the Process House? in Technology Blogs by SAP
- Solution for Rubik’s Cube of E-Invoicing in SAP Document and Reporting Compliance in Technology Blogs by Members
- SAP CPQ - The learning Series in Technology Q&A
- Building Resilient Applications using SAP Cloud Application Programming Model (SAP CAP) in Technology Blogs by SAP
Top kudoed authors
| User | Count |
|---|---|
| 11 | |
| 9 | |
| 7 | |
| 6 | |
| 4 | |
| 4 | |
| 3 | |
| 3 | |
| 3 | |
| 3 |