Introduction
As we know that HANA has supported using R as the language for writing a stored procedure.
R is a very powerful language for doing statistical analysis on data, and one of its major features is plotting fancy charts for data visualization. There are lots of functions in R doing data visualization.
Well, the question now is: Can we use these fancy data visualization features in the SQL procedures written in R language, and display the charts when we execute the procedure in HANA studio?
The answer is: Yes!!!

Be patient, we need do some preparations for our machine that installed the HANA studio. Otherwise we’ll only see errors when executing the procedure.
Here is a typical scenario: The HANA is installed on a powerful machine, which let’s call the ‘HANA box’, and the Rserve is installed on another machine to execute the R scripts, which is the ‘R box’. Then, the end user will use another machine, such as a laptop, with ‘HANA studio’ installed, to execute the procedure written in R. We call this machine as the ‘Client machine’. Here is the demonstration:

The magic here is: we use the X Window system in the client machine, to transfer the graphical data through the X Window protocol:

I’ll show you how to achieve this goal step by step.
Prerequisites
Undoubtedly, the R should be installed with graphical feature enabled. This also means that R box should have X Window system installed.
Step 1: Install X Window System on the Client Machine
If your client machine is running Linux, you need to do nothing at all, because the GUI of Linux uses the X Window. If your client machine is running Windows, then you need to install the X Window for Windows. You can install Cygwin to achieve that. During the installation process, make sure the X11 is also installed.
You can refer to this guide on how to install X in Cygwin.
After X Window system is installed on Cygwin, you can start the X in Cygwin console:
$ startxwin
Step 2: Use SSH to Log in to the R Box
Suppose we started the Rserve process with the user ‘ruser’. The next step is to log in to the Rbox from the client machine, using the ‘ruser’. Here we need emphasize this because if you log in to the R box using another user account, the channel doesn’t work.
Then, here comes a key step: When logging on to the R box, you must ensure that the ‘X11 forwarding’ is enabled. For putty settings, you can configure here:
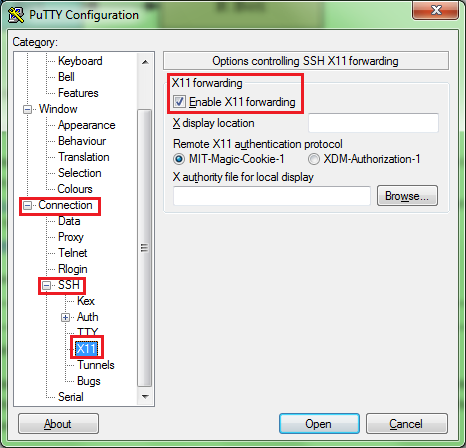
If you use the command line to log in using SSH, you can add the ‘-Y’ option:
$ssh -Y <user_name>@<host_name>
That’s it. You can have a test right now. After you start the X Window in client machine and log in to the R box, you can run the ‘xclock’ in the SSH console. If everything is OK, you can see the clock on your client machine. Surprise, right?

Step 3: Ready to run the code!
OK. Then we are ready to run the procedure now. Here we’ll do a simple demo on using the data visualization features in the R script. It will simply plot the input data frame.
Here is the code:
DROP TYPE DUMMY_INPUT_T;

CREATE TYPE DUMMY_INPUT_T AS TABLE (

    AAA INTEGER,

    BBB DOUBLE

);

DROP TYPE DUMMY_OUTPUT_T;

CREATE TYPE DUMMY_OUTPUT_T AS TABLE(

    AAA INTEGER,

    BBB DOUBLE

);

DROP TABLE DUMMY_INPUT;

CREATE TABLE DUMMY_INPUT (

    AAA INTEGER,

    BBB DOUBLE

);

DROP TABLE DUMMY_OUTPUT;

CREATE TABLE DUMMY_OUTPUT (

    AAA INTEGER,

    BBB DOUBLE

);

DROP PROCEDURE DUMMY_PROC_R;

CREATE PROCEDURE DUMMY_PROC_R (IN input1 DUMMY_INPUT_T, OUT result DUMMY_OUTPUT_T)

LANGUAGE RLANG AS

BEGIN

    result <- input1

    plot(input1)

    Sys.sleep(1)

    while (!is.null(dev.list())){

        Sys.sleep(1);

    }

END;

TRUNCATE TABLE DUMMY_INPUT;

INSERT INTO DUMMY_INPUT VALUES (1, 1.1);

INSERT INTO DUMMY_INPUT VALUES (2, 2.2);

INSERT INTO DUMMY_INPUT VALUES (3, 3.3);

TRUNCATE TABLE DUMMY_OUTPUT;

CALL DUMMY_PROC_R(DUMMY_INPUT, DUMMY_OUTPUT) WITH OVERVIEW;

SELECT * FROM DUMMY_OUTPUT;
When you execute this in the HANA studio now, you can see the chart, right on the HANA studio! :lol:
Let’s look deep into the R script.
First, we can see that we use the ‘plot()’ function. This will draw the input data frame point by point as a print chart.
Furthermore, you can notice that some code snippet is added at the end of the R script:
Sys.sleep(1)

while (!is.null(dev.list())){

    Sys.sleep(1);

}
This code snippet is to ensure that the graphical window is not immediately closed after the script is run to the end.
Summary
By using the X Window system, we can use the data visualization features in the SQL procedure written in R language. The chart can be displayed on the client machine running HANA studio.
This feature is really useful for the data analysts to understand the data more clearly when using HANA and R. It expands the usage area of R integration in HANA.
