
- SAP Community
- Products and Technology
- Technology
- Technology Blogs by SAP
- SAP Lumira: Share experience as a People Manager
Technology Blogs by SAP
Learn how to extend and personalize SAP applications. Follow the SAP technology blog for insights into SAP BTP, ABAP, SAP Analytics Cloud, SAP HANA, and more.
Turn on suggestions
Auto-suggest helps you quickly narrow down your search results by suggesting possible matches as you type.
Showing results for
Former Member
Options
- Subscribe to RSS Feed
- Mark as New
- Mark as Read
- Bookmark
- Subscribe
- Printer Friendly Page
- Report Inappropriate Content
06-04-2013
5:37 PM
As mentioned in a previous Blog, SAP Lumira can be the ideal solution in a context where you need high agility while having no time to spend in technical training and anything you do needs to be reproducible immediately.
In this new blog, I am giving some concrete examples of situations where I have been using SAP Lumira to get and share critical information about the mission of my team toward my customer.
One of my main goals is to satisfy the expectations of my customers, which means setting up a delivery model to optimize the ad equation to the demand, having the right skills and the right capacity for each request, and utilizing the full capacity of the team with all team members 100% allocated to delivery.
In a context where:
- Actual Project time spent is recorded in the ERP
- Initial Project budget is distributed in ERP
- Forecasted Project time is maintained locally in Excel (one small excel file per employee)
… my need is to combine these data into one single view, including all of my team members. Here is the way I have found using SAP Lumira.
1. Actual Time distribution
1.1. Data extraction from ERP
This is a very straight forward step: running the transaction ZDACT, I can get the list for the current period and then extract it into Excel (not more than 3 minutes).


Example of substract from ERP – showing time recorded by the team members everyday on their projects. This of course is not sufficient to get any information about the time distribution of the team members on projects and on other types of activities.
1.2. Analysis and Visualization of Actuals
Importing the excel file as is into SAP Lumira, it takes only a few minutes to create the set of views that I need to have the full transparency on our actual spent time: starting from the raw dataset (see below), after a few steps of manipulations and filtering, and without any technical coding.

Taking the benefit of the semantic enrichment, measures and dates are automatically created and time hierarchy is generated allowing then to immediately move to the analysis of time recorded per period.

In very few steps, I can easily and rapidly create the below views that I need to monitor my team.
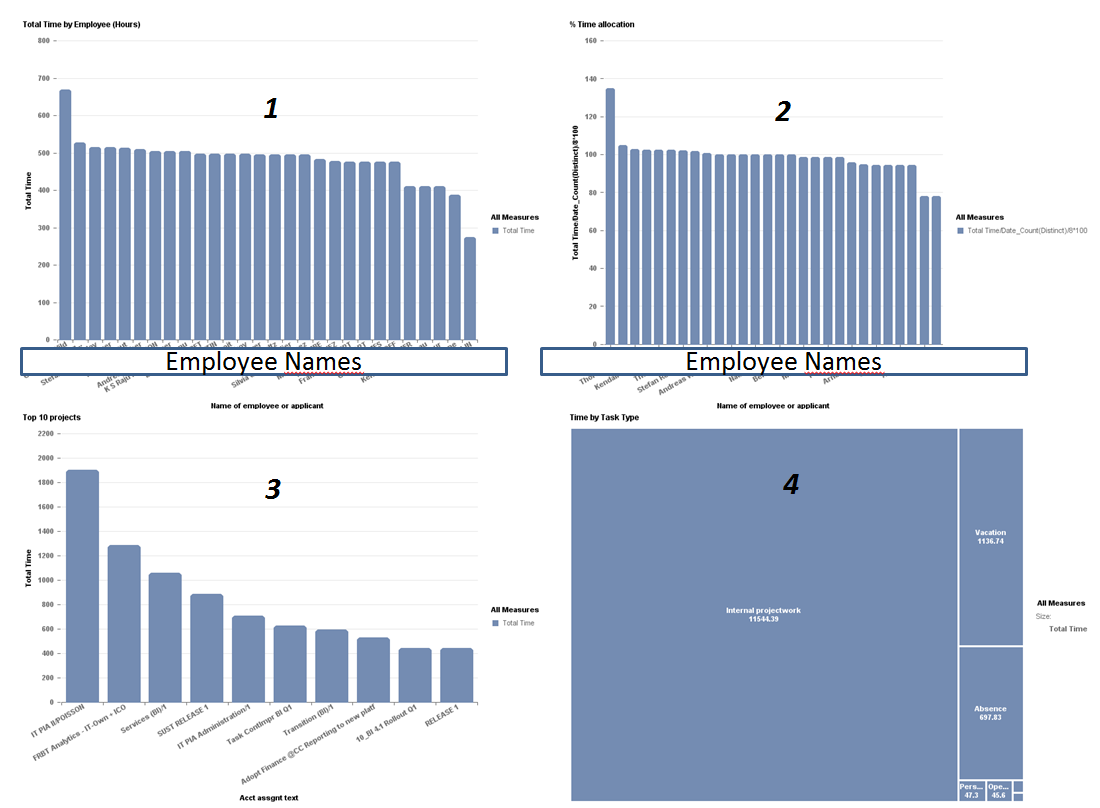
1. Total number of hours recorded by each team member in the quarter.
2. Time recording by employee – making sure everyone has recorded 100 % of his time in the office. We can also see when employees go beyond their quota of hours.
3. Top 10 projects is a key indicator where we spent most of our time – it is extremely important in our interactions with our customers.
4. Time spent by type of task – very important as our engagement is to be as close as possible to 100 % in project time.
With this view, I can monitor the activities of my team members, optimize the delivery model to spend a maximum of time on customer projects, and bring transparency to my customers about the focus areas of my team upon the pipe of demand from all customers!
2. Time forecasted
2.1. Context
This sentimental insight on the progress rate of the project is the link between the initial budget and the estimated real utilization. In an ideal world, Initial Total Budget, Total of Forecast over the months, and final Total number of days spent on the project should concur.
This view is the key to be predictable and anticipate where we will have to increase or decrease our investment to always be full speed in our delivery.
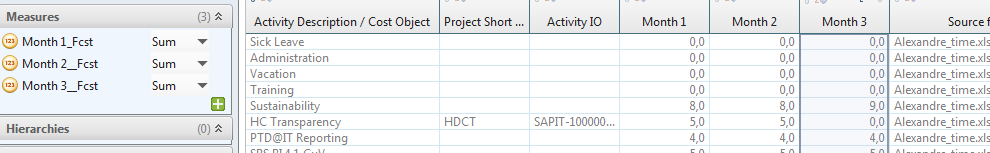
Time forecast is managed by each employee in a separate spreadsheet and reviewed with me at the beginning of each month at a minimum. Below is an example: pretty simple for each team member to fill in data – but tricky to report on it due to the structure and the fact each member has his own file.

2.2 Analysis and visualization via SAP Lumira
Starting point is the incorporation of the individual Forecast Excel files (more than 20) into SAP Lumira using the Append functionality to get one single
dataset.
- Go to the share drive where all files are located, using the multi selection capability...

- Then, check the option to append all sheets from all files.

From there, having all data needed to get this transparency, I am now able to create assets like the ones below.

The initial dataset is unexploitable and requires serious cleaning – mainly filtering data – due to the initial structure of the excel files that I did not change by
purpose. The tool should be able to handle this.

After putting the right filters and hiding the unnecessary columns, the new dataset is now clean and we can proceed with the enhancement.

Note: the Source File and Source sheet, added automatically when importing several sources with the Append option, allow you to identify the data source immediately.
In order to gather the same type of information as for the Actuals, two elements are important and need to be added:
- The name of the employee - derived from the source file
- The type of activity – Project, Support, Absence – derived from the Activity Description column
With the Data Manipulations features, creating these additional columns is very simple. For example, to get the employee name: we can use the “Split column on ‘_’” and the new column with employee name is automatically generated.

To move toward the information I need out of this, the next step is the Semantic Enrichment – very simply, creating the measures corresponding to the Forecasted number of days per month and in total for the Quarter.
The data preparation is now complete and visualization can be created.

1: Time forecasted by employee – showing if employees are indeed 100 % forecasted, as any deviation would require an adjustment
2: Time forecast per activity type, referring back to our commitment to focus at a maximum on customer added value (project time)
With this, not only am I agile … but I can also cover a much larger scope than I had initially planned:
- Operationally - moving from overall Delivery Unit to Individual Project commitments
- Strategically - the additional possibility of reusing this work by simply refreshing the data.
Of course, using it more frequently, I am discovering new functionality and going faster, but the key finding is that whenever a new question comes up, I can help myself when no asset exists to produce a first view, in full autonomy!
- SAP Managed Tags:
- SAP Lumira
2 Comments
You must be a registered user to add a comment. If you've already registered, sign in. Otherwise, register and sign in.
Labels in this area
-
ABAP CDS Views - CDC (Change Data Capture)
2 -
AI
1 -
Analyze Workload Data
1 -
BTP
1 -
Business and IT Integration
2 -
Business application stu
1 -
Business Technology Platform
1 -
Business Trends
1,658 -
Business Trends
93 -
CAP
1 -
cf
1 -
Cloud Foundry
1 -
Confluent
1 -
Customer COE Basics and Fundamentals
1 -
Customer COE Latest and Greatest
3 -
Customer Data Browser app
1 -
Data Analysis Tool
1 -
data migration
1 -
data transfer
1 -
Datasphere
2 -
Event Information
1,400 -
Event Information
66 -
Expert
1 -
Expert Insights
177 -
Expert Insights
299 -
General
1 -
Google cloud
1 -
Google Next'24
1 -
Kafka
1 -
Life at SAP
780 -
Life at SAP
13 -
Migrate your Data App
1 -
MTA
1 -
Network Performance Analysis
1 -
NodeJS
1 -
PDF
1 -
POC
1 -
Product Updates
4,577 -
Product Updates
345 -
Replication Flow
1 -
RisewithSAP
1 -
SAP BTP
1 -
SAP BTP Cloud Foundry
1 -
SAP Cloud ALM
1 -
SAP Cloud Application Programming Model
1 -
SAP Datasphere
2 -
SAP S4HANA Cloud
1 -
SAP S4HANA Migration Cockpit
1 -
Technology Updates
6,873 -
Technology Updates
427 -
Workload Fluctuations
1
Related Content
- Customer & Partner Roundtable for SAP BTP ABAP Environment #12 in Technology Blogs by SAP
- How to use AI services to translate Picklists in SAP SuccessFactors - An example in Technology Blogs by SAP
- SAP Signavio is the highest ranked Leader in the SPARK Matrix™ Digital Twin of an Organization (DTO) in Technology Blogs by SAP
- Best Practice: How to Structure the Shared Document Folder in Technology Blogs by SAP
- Consolidation Extension for SAP Analytics Cloud – Automated Eliminations and Adjustments (part 1) in Technology Blogs by Members
Top kudoed authors
| User | Count |
|---|---|
| 41 | |
| 25 | |
| 17 | |
| 14 | |
| 9 | |
| 7 | |
| 6 | |
| 6 | |
| 6 | |
| 6 |