How is the constrained forecast impacting the profit and loss (P&L) projection? How are the supply chain decisions driving the product profitability? Should the company extend the capacity in-house or outsource to a contract manufacturer? How will the new pricing policy shape the projected sales?
Answering these questions is critical for planners to be able to make the best and most profitable decisions for the business. To get the precise answer, and not just general guidance, planners require to understand the 360-degree implications of their choices. But this is almost impossible when the planning process is fragmented by the line of business, based on isolated data and business assumptions. Solving this challenge of disconnected planning outputs, which usually leads to poor execution, can only be achieved with a harmonized & collaborative enterprise planning process framework.
IBP + SAC better together
SAP’s approach for Collaborative Enterprice Planning consists of two of its best in class solutions:
SAP Integrated Business Planning (IBP) and
SAP Analytics Cloud (SAC). Together they allow enterprises to run an end to end planning process across finance, commercial and supply chain.
I am writing this post to share with you my learnings over the last couple of months on how these two solutions complement each other.
Let`s use an example. Imagine that you are working for the BestRun company, a bicycle manufacturer. You are currently engaged to formulate a long term plan which supports the vision of the company to become the worldwide number one manufacturer of electric bikes by 2025.
Xs + Os insights
To define the strategic initiatives to support the company vision, you are combining experience data with operational data:
- Experience data or X-data will provide insights into the market evolution and trends; customers’ product experience and their perception of your brand.
- Operational data or O-data will help you define how you can respond to X-data. You may need inputs from research and development, demand generation, manufacturing footprint, workforce management etc
Combining this data in SAC will help the business decision process by providing the key ingredients that will lead to actionable insights: analytics, business intelligence and prediction.
Coming back to the BestRun’s long term planning process, before anticipating the future challenges, you look at the current issues. You observe that the second product group by the size of the revenue contribution is behind the targeted growth for the current year. The reason? Customers are not satisfied with the range of models; they don`t find this segment diverse enough in terms of size, motor and price.
 Figure 1 X&O data combined in a SAC story
Using X-data, you can get further insights into the perceived importance and preference of each feature within the product as well as the price elasticity. You can now plan the development of new models so that every customer will find a perfect fit for his / her preferences. You will have special models for APJ market, models that will drive the projected growth target in the next five years.
Let's assume that as an outcome of models’ diversification and other market initiatives to expand in APJ, the market demand revenue view looks great for the upcoming years! But what about the manufacturing view, is the current network able to scale up?
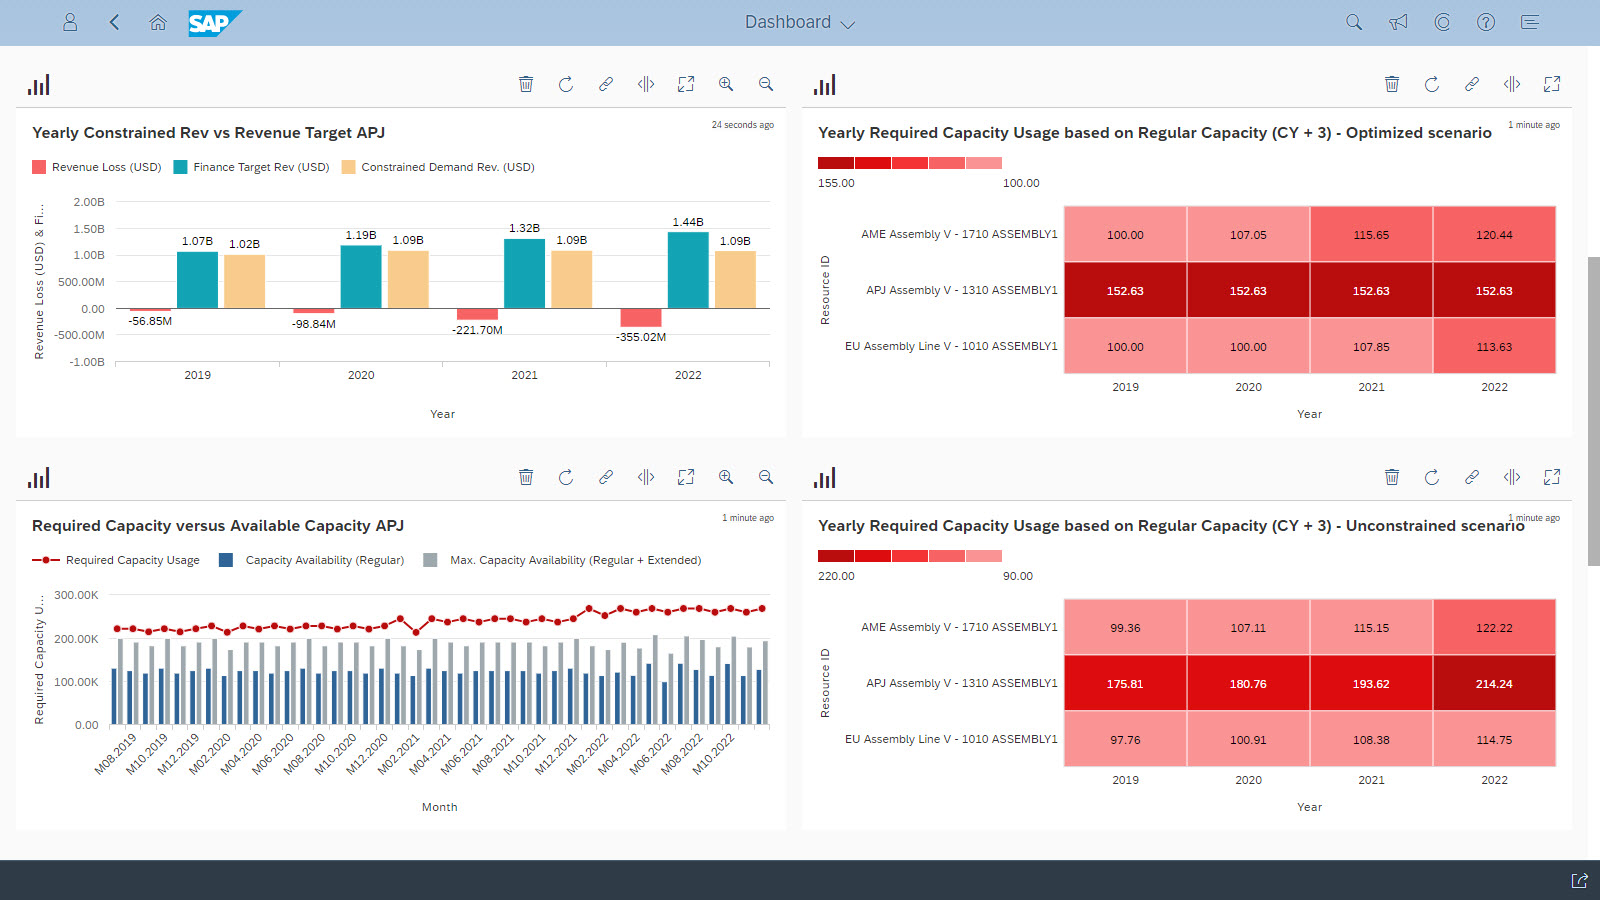
With IBP, you can quickly incorporate changes in the revenue plan, translate value to volume, and evaluate the impact across the entire supply chain, including production, distribution, and procurement.Unfortunately, the result of the supply analysis indicates a high risk of revenue loss due to capped capacity in APJ. Even if the capacity is incremented by increasing the working days per week from 5 to 7, by 2022, the available capacity will be with 40% less than the the required one.
Bringing the results of the supply chain planning into SAC will enable the collaboration with financial planning and analysis.
- If weekend shifts are required to solve the capacity issue in the short term, what will be the impact on the income statement?
- If extra shifts are limited and hence not sustainable in the long term, perhaps a new line investment decision has to be made. How will the investment impact the company’s cashflow and balance sheet?
You can simulate all these in SAC. Checking the results, you can observe that liabilities increased, but the debt to equity ratio looks good. You can take these results and present them in the next executive S&OP meeting.

With this example, I covered a 3 step long-term planning process:
- A long-term value plan was first created in SAC based on X&O data insights and projection. The plan was sent to IBP.
- IBP translated the value plan to volume to create a detailed operating plan for the next 3 yrs. The constrained revenue was sent back to SAC.
- SAC used the input from IBP as a starting point for THE financial planning (e.g. detailed annual Budget – cost assumptions, investments in capacity, etc.)
Hope you will find this example helpful.
If you are interested in the integration between IBP and SAC, please refer to the following two posts:
