
- SAP Community
- Products and Technology
- Technology
- Technology Blogs by SAP
- The OLAP Compiler in #BWonHANA
Technology Blogs by SAP
Learn how to extend and personalize SAP applications. Follow the SAP technology blog for insights into SAP BTP, ABAP, SAP Analytics Cloud, SAP HANA, and more.
Turn on suggestions
Auto-suggest helps you quickly narrow down your search results by suggesting possible matches as you type.
Showing results for
Product and Topic Expert
Options
- Subscribe to RSS Feed
- Mark as New
- Mark as Read
- Bookmark
- Subscribe
- Printer Friendly Page
- Report Inappropriate Content
02-18-2013
8:15 AM
This blog is about a functionality that I consider as one of the crowne jewels of BW-on-HANA. The approach has evolved over many years; early discussions started around the time when the BW accelerator (BWA) got initiated (around 2003, project Euclid) and were ignited by the fact that BWA (and its sequel HANA) provided a layer for processing multiple and sequenced calculations close to the data layer. This has not been possible before as we did not have control over the data processing layer of the standard RDBMS underneath the classic BW. The latter is restrained by SQL as the standard API. This blog – as a side effect – will show in what way SQL limits analytic processing, especially fast analytic processing. Also, it will become apparent that BW's OLAP has converted into a kind of sophisticated compiler for HANA's calculation engine. That combination will be hard to beat when you go beyond demo, "hello world style", single table group-by and other simple analytic examples.
An Example
Let's look at an example which looks as if it was of "hello world style" but which quickly reveals some challenges. In figure 1, a standard OLAP query result is displayed.
- It shows the quantities of sold items per product and country.
- In addition, the number of distinct customers who bought those products can be seen.
- Finally, the quantity relative to the overall number of sold products in a country are presented as percentages.

Figure 1: Example of a result of an OLAP query
Some Challenges in the Example
Now when you carefully look at the example of figure 1 then you see some of the challenges:
- The numbers of distinct customers do not sum up. There are 5 distinct customers buying pencils and 3 buying paper, both in Germany (DE), but only 6 – and not 5+3=8 – buying products in DE. There must be 2 customers that have bought both, pencils and paper. In processing terms this means that the subtotal (e.g. by country) cannot be calculated out of the preceeding aggregation level (e.g. by country and product) but needs to be calculated from the lowest granularity (i.e. by country, product, customer).
- The calculated key figure quantity per country refers to the key figure quantity and sets the latter's values in relation to its subtotals. This means that the quantity key figure and its subtotals has to be calculated prior to calculating key figure quantity per country. This means there is an order of processing imposed by mathematics.

Figure 2: Challenges in the example
What you can do with SQL
In order to calculate the result of figure 1, classic BW (or SQL-based OLAP tools in general) would issue a SQL statement that retrieves a rowset (!) similar to the one shown in figure 3. That rowset constitutes the base set of data from which the result of figure 1 can be calculated. It is not the final result yet but from that data it is possible to calculate the final result as indicated in figure 1. Don't get fooled by the small amount of data shown in figure 3! As you can see, it is necessary to get the details on the customers in order to calculate the distinct customers per group-by level. In real world scenarios – just imagine retailers, mobile phone or utility companies – the customer dimension can be huge, i.e. holding millions of entries. Consequently and caused by real-world combinatorics, the result of the SQL query in figure 3 is likely to be huge in such cases. That "sub-result" needs to be further processed, traditionally in an application server, e.g. BW's ABAP server or the WebIntelligence server. This implies that huge amounts of data have to be transported from the DB server to such an application server or a client tool.

Figure 3: Rowset retrieved by a SQL query to calculate result of figure 1
By the way: BWA 7.0 accelerated exactly this part of OLAP query processing, i.e. the basic data query. Subsequent processing on top has still been executed in the application server. This is not a big issue as long as the OLAP query is dominated by the SQL processing. However, it comes short – as in this example – when the result of the basic SQL query gets huge and requires significant data transport from the DB to the application server and then significant data traversals to calculate the final result.
Now based on the result shown in figure 3 there is a natural sequence of how to calculate the various formulas (behind the calculated key figures) and the various group aggregations (i.e. the subtotals and totals). Many of those subsequent calculations can be considered as SQL queries on top of figure 3's result. Figures 4a and 4b show the resulting dependency graph: LQ is the label for the query of figure 3; L1, L2, ..., L6 are "queries" or calculations on top. BW's OLAP compiler basically derives that graph and sends it down to HANA's optimizer (using a proprietary interface), HANA optimizes and processes that graph and sends back the result. Please beware that the result is not a rowset, at least not in the normal sense. It is heterogeneous sets of rows that are returned and that need to go into the appropriate result line in figure 1. In short: the compiler creates a graph to be sent to HANA and then there is a postprocessing step that receives the result and converts it to the desired result set of the OLAP query (i.e. a cellset as in fig. 1).

Figure 4a: Graph derived for processing the final result (as in fig. 1) from the data in fig. 3
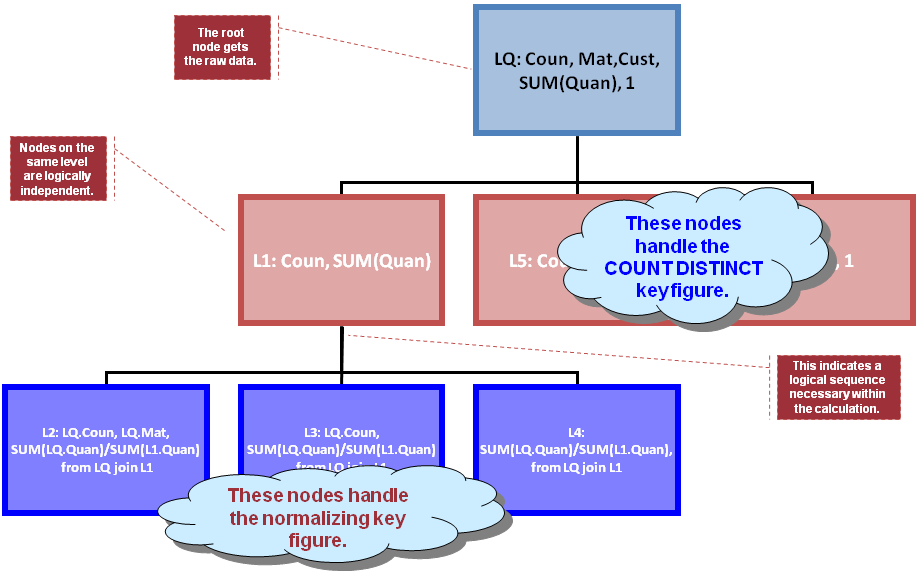
Figure 4b: Structure of the OLAP Calculation Graph
Concluding Remarks
I think there is a few fundamental things that become apparent even by looking at the simple example discussed in this blog:
- Even though individual processing steps can be expressed via SQL, it is in the end a well defined sequence of processing steps that yield the result.
- Accelerating the individual steps helps but falls short. For example, an OLAP client tool can derive an OLAP graph like the one in fig. 4a. One alternative is that it issues for each node in that graph a SQL or SQL-like query. To avoid the data transport, it can materialize intermediate results. However, this constitutes an overhead. As a second alternative (the one frequently met in practice), it is possible to issue only the basic query – labeled "LQ" in fig. 4 – and transport a potentially huge result set over the network to the client in order to calculate the rest on the client level. This is the traditional approach which obviously also suffers from the transportation overhead.
- BW-on-HANA resolves those issues by:
- providing a powerful option to define an OLAP query – i.e. the BEx query – this is a precondition to allow all of that in the first place, sending down the entire "processing graph" to HANA and allowing HANA to optimize and pipeline the individual processing steps, and
- having the capability to assemble the partial results of the processing steps into the final (OLAP) result.
Credits
Let me emphasize that I'm the mere author of this blog. The real credits go to the bright minds behind this approach who sit in BW's OLAP and data manager teams.
This blog is cross-published here. You can follow me on Twitter via @tfxz.
- SAP Managed Tags:
- BW (SAP Business Warehouse),
- SAP HANA
25 Comments
You must be a registered user to add a comment. If you've already registered, sign in. Otherwise, register and sign in.
Labels in this area
-
ABAP CDS Views - CDC (Change Data Capture)
2 -
AI
1 -
Analyze Workload Data
1 -
BTP
1 -
Business and IT Integration
2 -
Business application stu
1 -
Business Technology Platform
1 -
Business Trends
1,658 -
Business Trends
107 -
CAP
1 -
cf
1 -
Cloud Foundry
1 -
Confluent
1 -
Customer COE Basics and Fundamentals
1 -
Customer COE Latest and Greatest
3 -
Customer Data Browser app
1 -
Data Analysis Tool
1 -
data migration
1 -
data transfer
1 -
Datasphere
2 -
Event Information
1,400 -
Event Information
72 -
Expert
1 -
Expert Insights
177 -
Expert Insights
342 -
General
1 -
Google cloud
1 -
Google Next'24
1 -
GraphQL
1 -
Kafka
1 -
Life at SAP
780 -
Life at SAP
14 -
Migrate your Data App
1 -
MTA
1 -
Network Performance Analysis
1 -
NodeJS
1 -
PDF
1 -
POC
1 -
Product Updates
4,575 -
Product Updates
385 -
Replication Flow
1 -
REST API
1 -
RisewithSAP
1 -
SAP BTP
1 -
SAP BTP Cloud Foundry
1 -
SAP Cloud ALM
1 -
SAP Cloud Application Programming Model
1 -
SAP Datasphere
2 -
SAP S4HANA Cloud
1 -
SAP S4HANA Migration Cockpit
1 -
Technology Updates
6,872 -
Technology Updates
473 -
Workload Fluctuations
1
Related Content
- Bex Query/AFO Reports Development tips/tricks & Performance Improvement Techniques. in Technology Blogs by Members
- SAP Data Sphere Business Case Scenarios & Implementation Stratergies. in Technology Blogs by Members
- Faster query execution with lesser memory now also available in SAP HANA Platform SPS07 in Technology Blogs by SAP
- RSRT Query Analysis Statistics in Technology Q&A
- SAP BI 4.3 SP2: What’s New In Web Intelligence and Semantic Layer in Technology Blogs by SAP
Top kudoed authors
| User | Count |
|---|---|
| 17 | |
| 14 | |
| 12 | |
| 10 | |
| 9 | |
| 8 | |
| 7 | |
| 7 | |
| 6 | |
| 6 |