Are you unhappy with your system performance and ask yourself:
- Are my long database response times due to long processing times on the database server or slow communication between the database server and the SAP application server?
- How are the network statistics distributed among the Db2 members and the SAP application servers of my system?
- How long is the network time compared to the server time?
- How long is the average network time per roundtrip and how does this metric react to a changing network load?
Did you know you can use the network statistics in the DBA Cockpit to find out?
Here’s how:
Start the DBA Cockpit (transaction
DBACOCKPIT) and go to the
Network Statistics screen under
Performance. It gives you details of the network communication between SAP application server and database.
Let’s have a look at an example of how you can use the
Network Statistics screen to analyze your network performance:
In the
Selection area, choose a time frame and a few settings for the graphic and for the list view of the statistics.

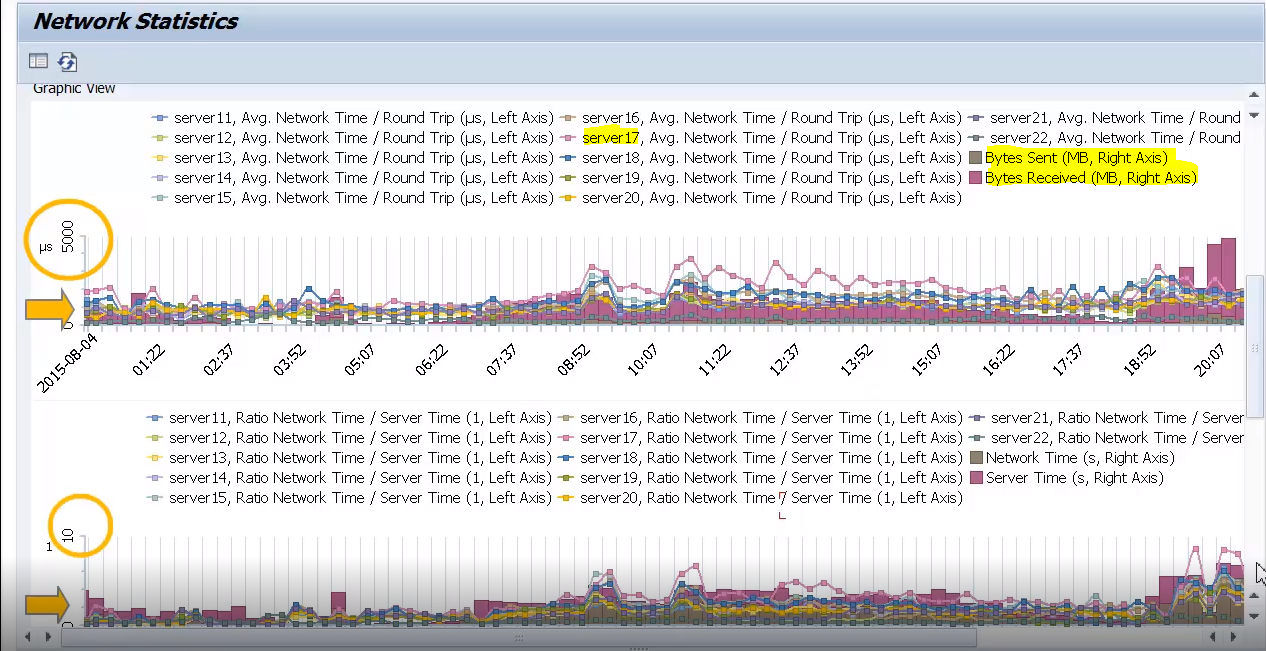
After applying your selection, you get two graphics: The first one shows the average network time per roundtrip for each application server as line graph, and the bytes sent and received as stacked columns.
The line graphs show the values of the drilldown options that you’ve selected (here: application server), the stacked columns show aggregated values for the entire system.
You can already see that the average network time per roundtrip is quite high.
The second graphic shows the ratio of network time/server time as line graphs, and the absolute values of network and server time as stacked columns. Here you can also see that the values are rather high:
As an alternative to the graphics, there’s also a list view for the network statistics. Again, you can see that the ratio network time/server time is quite high. We have a ratio of 2.2 here in our example:

Let’s have a closer look and go back to the
Selection area to drill down for more details about application server no. 17, which has particularly high values:

You can see something’s wrong here:

- The average network time per roundtrip is consistently high and increases up to 4,000 microseconds.
- With a higher load, the network time per roundtrip increases.
- Network times are far too high compared to server times.
Let’s compare these values to the values of a healthy system:

Here in the healthy system, the network statistics are as you’d expect them to be:
- The average network time per roundtrip in this system remains below 750 microseconds. It’s much lower than the up to 4,000 microseconds in our problem system.
- The graph for the average network time per roundtrip remains relatively stable compared to our problem system where the average network time per roundtrip increased with the workload.
- The ratio of network time to server time varies little, and the ratio is low.
So, in our first example, it’s not the system, it’s really a network issue that would need further investigation now.
Let us know in the comments if...
...you found this blog helpful and if you were able to solve performance problems using the network statistics screen in the DBA Cockpit.
This blog’s content is also available in a
video.
