In July 2010, SAP Mentor ivan.femia released the first version of the open source project abap2xlsx that allowed ABAP developers to generate professional spreadsheets from scratch with all the advanced features that stand alone Excel editors provide like: style and cell data formats, drawings support, conditional formatting, formulas, and so on.
This project has improved the user experience compared to excel generated using SAP standard components (such as ABAP ALV, WebDynpro ALV, System menu, etc.) and it has made ABAP developers more freedom adding, for example, the ability to generate an excel from non dialog processes and to include the generated excel as email attachment. At last but not least, this framework allows the use of spreadsheets in an interactive way, making possible to read them via ABAP for further processing.
Time after time, more and more SDN community members joined into the project and improved its functionalities. The abap2xlsx project reaches a large number of contributors, so today it is almost time for the new release that will include many new features such as the use of template files for charts, very hidden sheet, many bug fixes and so on. In this blog we will focus on one of the most important news: the ability to create custom charts from scratch!

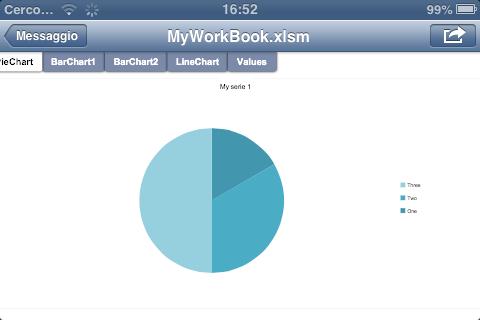
Yes, that's right: with just a few simple ABAP code lines, you can create business graphics within the excel file and send it, for example, to many iPhone/iPad via a push notification or via an html email (as weekly summary for example).


Another interesting way to use abapxlsx charts is to generate them using abap and then catch them as an image in order to show the chart in a WebDynpro or to send it directly to a mobile device! You believe that this is not possible? It is not easy, but you can do it following these steps:
- Generate the excel file with the chart as you wish via ABAP using abap2xlsx
- Add a simple macro to the excel via ABAP using abap2xlsx in order to enable the excel to export the chart in an image file like this:

- Write a simple vbs file via ABAP in order to run the image generation like this:

- Save the excel file and the vbs on the SAP NetWeaver Application Server filesystem via ABAP
* Opening the File
OPEN DATASET lv_filename FOR OUTPUT IN TEXT MODE
MESSAGE lv_msgtxt.
IF SY-SUBRC NE 0.
WRITE: 'File cannot be opened. Reason:', lv_msgtxt.
EXIT.
ENDIF.
* Transferring Data
LOOP AT lt_table.
TRANSFER lt_table-line TO FILENAME.
ENDLOOP.
* Closing the File
CLOSE DATASET lv_filename.
Run the saved VBScript file via ABAP
v_command = 'cscript.exe test.vbs'.
CALL 'SYSTEM' ID 'COMMAND' FIELD v_command.
The chart image has been generated! Get it from the Application Server filesystem via ABAP and display or send it!

