
- SAP Community
- Products and Technology
- Technology
- Technology Blogs by SAP
- Introducing the new CRR Control Center to monitor ...
Technology Blogs by SAP
Learn how to extend and personalize SAP applications. Follow the SAP technology blog for insights into SAP BTP, ABAP, SAP Analytics Cloud, SAP HANA, and more.
Turn on suggestions
Auto-suggest helps you quickly narrow down your search results by suggesting possible matches as you type.
Showing results for
Advisor
Options
- Subscribe to RSS Feed
- Mark as New
- Mark as Read
- Bookmark
- Subscribe
- Printer Friendly Page
- Report Inappropriate Content
01-18-2019
2:00 PM
In this blog I describe the new CRR Control Center to monitor Record & Replay in SUM 2.0 Abstract: From SUM 2.0 SP04, a new UI5-based monitoring tool called CRR Control Center will be available. This blog describes how to use the new tool and also shows the new user interface. |
Scenario
You're running a system update using Software Update Manager 2.0 with the approach near-Zero Downtime Maintenance (nZDM) for ABAP [SAP Note 1678564]. For further information on the difference between SUM 1.0 and SUM 2.0, check the SAP Community blog post SUM in the family way.
nZDM works with the Record & Replay technique that uses the Change Recording and Replication (CRR) framework. This allows you to capture database changes in tables on the production instance during uptime. The Software Update Manager starts the recording of data changes automatically and transfers it to the shadow instance iteratively after the table structure adjustment. During the uptime you'd like to monitor and control the data transfer.
What's new?
Until SUM 2.0 SP03, the Record & Replay was monitored by an ABAP-based monitoring transaction CRR_CONTROL. The transaction needed to be launched in the shadow system to check the replication rate of the CRR framework.
 | From SUM 2.0 SP04, the ABAP transaction CRR_CONTROL will be deprecated and no longer be supported. The successor is a new and fresh UI5-based monitoring tool called CRR Control Center which is part of the SUM Utilities Extended UI. For SUM 1.0, the transaction CRR_CONTROL is still available. |
How can the new CRR Control Center be accessed?
There's two different ways to access the CRR Control Center:
Of course, you can access the tool via the dialog screen in phase MAIN_DTTRANS/DOWNCONF_DTTRANS. For this, just click on the hyperlink Change Recording & Replay Control Center as shown in the next screenshot. This will redirect you to the Current Replication Status view as shown below:
Alternatively, you can access the CRR Control Center at any time via the main screen of the user interface of Software Update Manager: open the More menu and choose Utilities:

From here, navigate to the Process Control Center and further to the CRR Control Center:

Navigating inside of the CRR Control Center
There're the following main elements and features on the dialog:

| # | Name | Description |
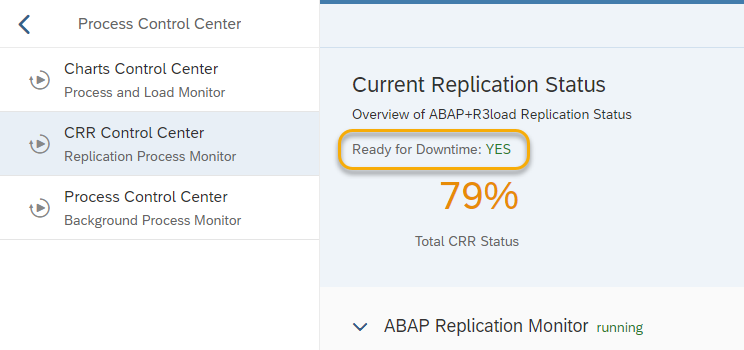
| 1 | Total CRR Status | This view gives an overview of the replication status. The system provides a total CRR status, of both ABAP-based and the R3load-based replication. For nZDM, only the ABAP-based replication is used. R3load-based replication is used in a different downtime-optimization approach. If the CRR status is 75% and higher, and the indicator Ready for Downtime: displays a YES, you can enter the downtime and continue with the update. |
| 2 | ABAP Replication Monitor | The list shows all tables currently processed by the ABAP-based replication and gives additional information. |
| 3 | Number of Batch processes | This monitor displays the number of batch processes that are used for the replication in the shadow instance. You can set the number of batch processes by using the plus- or minus-button or by entering a number directly. Afterwards, you must accept the change to save the new number of processes. Note: The number of batch processes is limited to the defined value for parameter ABAP PROCESSES (UPTIME) which was defined during roadmap step Configuration. The maximum number of processes which can be used for replication depends on the actual available batch processes during start of replication. |
| 4 | Filter buttons for Planned, Idle, Running and Failed | It is possible to use predefined filters for Planned, Idle, Running, and Failed table entries. |
| 5 | Start replication button | The replication process can be started by pressing this button. |
| 6 | Stop replication button | The replication process can be stopped by pressing this button. |
| 7 | Open the log file | Shows more information about the replication processing. |
More details about the Total CRR Status
The main purpose of this figure is to show whether the system is ready to enter the downtime.
If the replication rate is lower than 75%, the system is not ready for downtime. Hence the status Ready for Downtime: displays NO.

Once the replication rate is higher than 75%, the indicator Ready for Downtime displays YES. Now, the system is ready to enter the downtime. However, it's recommended to reach at least a replication rate of 90%.
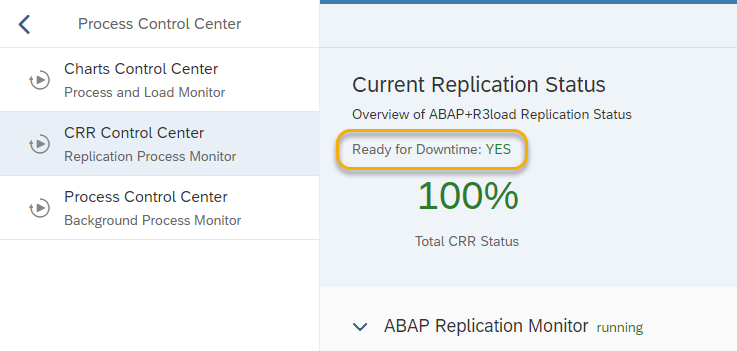
If the replication rate is higher than 95% the key figure for the Total CRR Status changes from orange to green:
Explaining the Process Control Center - Background Process Monitor
The Software Update Manager starts background processes for the replication. They run in parallel beside the SAPup worker process. In general, all registered background processes should have the status running:

This view displays all registered background processes and its status (1).
In addition, you can start, stop, or kill such a background process from here (2).
Further information
- SAP Note 2351880 - SUM 1.0: Downtime-optimized Procedures: Monitor and Control the Data Transfer with Transaction CRR_CONTROL
- SAP Note 2879083 - SUM 2.0: Downtime-optimized Procedures using nZDM or downtime-optimized DMO/downtime-optimized Conversion: additional information on data replication
- SAP Note 1678564 – Restrictions, Database-specific Settings, and Troubleshooting of nZDM for SUM
- SAP Note 2293733 - Prerequisites and Restrictions of downtime-optimized conversion to SAP S/4HANA
- SAP Note 2547309 - Downtime-optimized DMO with SUM 2.0
- Blog: SUM in the family way
- SUM 2.0 guide: Chapter 3.5.4 SUM Utilities (Extended UI) / A.2.25 Error Handling for Replication Process Monitor
Jens Fieger
Product Management SAP SE, Software Logistics
- SAP Managed Tags:
- software logistics toolset,
- Software Logistics - System Maintenance,
- Software Logistics
Labels:
You must be a registered user to add a comment. If you've already registered, sign in. Otherwise, register and sign in.
Labels in this area
-
ABAP CDS Views - CDC (Change Data Capture)
2 -
AI
1 -
Analyze Workload Data
1 -
BTP
1 -
Business and IT Integration
2 -
Business application stu
1 -
Business Technology Platform
1 -
Business Trends
1,661 -
Business Trends
87 -
CAP
1 -
cf
1 -
Cloud Foundry
1 -
Confluent
1 -
Customer COE Basics and Fundamentals
1 -
Customer COE Latest and Greatest
3 -
Customer Data Browser app
1 -
Data Analysis Tool
1 -
data migration
1 -
data transfer
1 -
Datasphere
2 -
Event Information
1,400 -
Event Information
64 -
Expert
1 -
Expert Insights
178 -
Expert Insights
273 -
General
1 -
Google cloud
1 -
Google Next'24
1 -
Kafka
1 -
Life at SAP
784 -
Life at SAP
11 -
Migrate your Data App
1 -
MTA
1 -
Network Performance Analysis
1 -
NodeJS
1 -
PDF
1 -
POC
1 -
Product Updates
4,577 -
Product Updates
326 -
Replication Flow
1 -
RisewithSAP
1 -
SAP BTP
1 -
SAP BTP Cloud Foundry
1 -
SAP Cloud ALM
1 -
SAP Cloud Application Programming Model
1 -
SAP Datasphere
2 -
SAP S4HANA Cloud
1 -
SAP S4HANA Migration Cockpit
1 -
Technology Updates
6,886 -
Technology Updates
403 -
Workload Fluctuations
1
Related Content
- Top Picks: Innovations Highlights from SAP Business Technology Platform (Q1/2024) in Technology Blogs by SAP
- What’s New in SAP Datasphere Version 2024.8 — Apr 11, 2024 in Technology Blogs by Members
- Recap - SAP ALM at SAP Insider Las Vegas 2024 in Technology Blogs by SAP
- SAP Build Code - Speed up your development with Generative AI Assistant - Joule in Technology Blogs by SAP
- SAP Datasphere - Space, Data Integration, and Data Modeling Best Practices in Technology Blogs by SAP
Top kudoed authors
| User | Count |
|---|---|
| 12 | |
| 10 | |
| 10 | |
| 7 | |
| 7 | |
| 7 | |
| 6 | |
| 6 | |
| 5 | |
| 4 |