
- SAP Community
- Products and Technology
- Technology
- Technology Blogs by SAP
- New Business Process Analytics - The filter sequen...
Technology Blogs by SAP
Learn how to extend and personalize SAP applications. Follow the SAP technology blog for insights into SAP BTP, ABAP, SAP Analytics Cloud, SAP HANA, and more.
Turn on suggestions
Auto-suggest helps you quickly narrow down your search results by suggesting possible matches as you type.
Showing results for
Advisor
Options
- Subscribe to RSS Feed
- Mark as New
- Mark as Read
- Bookmark
- Subscribe
- Printer Friendly Page
- Report Inappropriate Content
09-28-2012
10:47 AM
The previous blog New Business Process Analytics features with SolMan 7.1 SP5 gave some overview about all the new features of Business Process Analytics. Within this blog also the new filtering capabilities were mentioned. Meanwhile we got a lot of first customer feedback on the new Business Process Analytics. Besides all the very positive feedback we received, we also heard several times that people are not sure whether the new filtering works correctly or not. At the end everytime it worked correctly, but as mentioned in the previous blog it is important to have an eye on the filter sequence in order to get the expected results! The filter sequence has to be read from left to right.
This blog will give you a practical example to show how different the analysis results can be depending on the filter sequence you have chosen.
Benchmarking without filter
We take the key figure Overdue Outbound Delivery Items as an example (which is also used during the TechEd season 2012), although it is not really of importance which key figure is chosen as the filtering logic is independent of the key figure. In our example we can see that if no filter is set, the number of identified document items is 788 in total. The data can be split per Sales Organization and Delivery Type.

If you visualize the data, then you can easily see that 5 sales organizations are sticking out (1000, 3000, 3020, R100 and R300). The first 3 are mainly related to delivery type LF and the later 2 are only related to delivery type NL (so STO replenishment process and not sales process).

Benchmarking: Filter top5 first
Now we want to set some filters. We want to focus on our top5 sales organizations, i.e. we set the Top N filter for Sales Organization to 5. This reducec the result set from 788 down to 694. In a second step we want to focus only on the sales process and hence filter the Delivery Type on LF and LO. This reduces the final result set to 454.

When we update the graphical chart we only see 3 sales organizations 1000, 3000 and 3200 but not 5, is this correct? Where are the other 2 top sales organizations R100 and R300? Well, everything is correct here. If you remember the un-filtered result set then the sales organizations R100 and R300 were only related to delivery type NL which was filtered-out. These 2 sales organizations are not related to LF and LO, so R100 and R300 are no longer showing up in the final result set.

Benchmarking: Filter top5 last
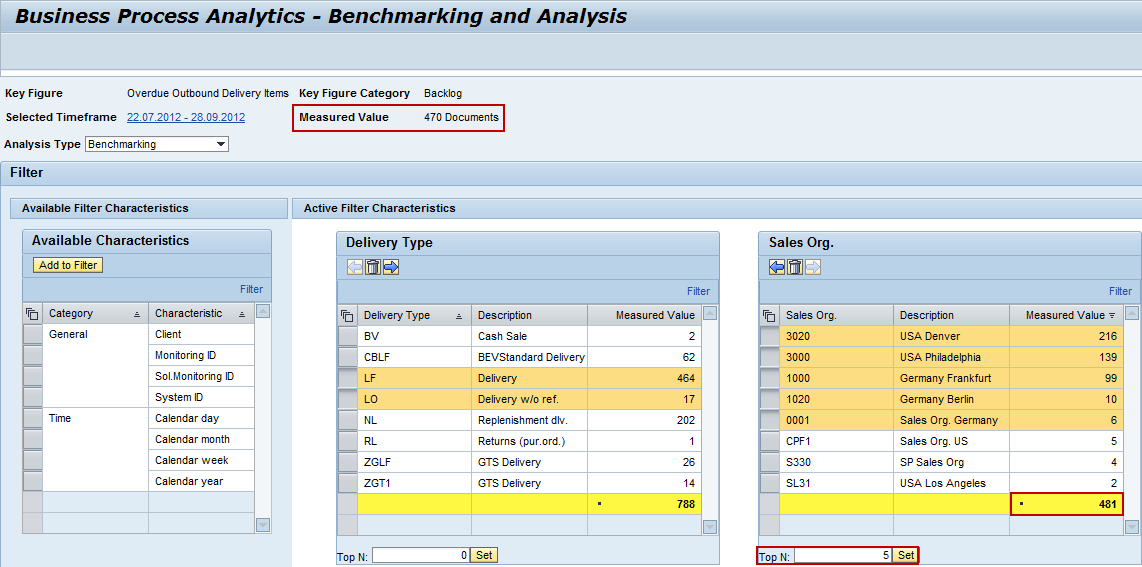
As was mentioned in the introduction - the filter sequence is of importance and filters have to be read from left to right. So we change the sequence and shift the Delivery Type to the left and the Sales Organization to the right. Now we "formally" set the same filters as before, i.e. we filter on delivery types LF and LO (which reduces the result set from 788 to 481) and then set the TOP N filter for Sales Organization to 5. This top5 filter is set only on the remaining 481 document items and further reduces the result set down to 470. So obviously the filtering that looked "formally" the same, is practically not the same because of the different characteristic sequence. The first filtering example brought 454 records back and the second example shows 470 records.
If we update the graphical chart, then we also see that the result set returns a different picture and this time we can really see 5 sales organizations. We now see the top5 sales organizations only for those delivery items with delivery type LF as well as LO and which are overdue. In contrast the first filtering example showed us how many delivery items of type LF and LO belong to the top5 sales organizations with overdue deliveries.

Conclusion
I hope that this simple example helps to understand that the sequence of filters is essential for what you see as a final result set. Always read filters from left to right. Delete filters that you don't need and add more characteristics for filtering if required. In most use cases you probably want to set a Top N filter for the last characteristic to the right. Avoid setting Top N filters for characteristics that stand to the left - otherwise you will encounter "surprising" situations like in the first filtering example where the chart doesn't show all elements from the Top N filter that you initially set.
More Business Process Analytics details on all (new) features and the new authorization objects can be found on the complete (SMP login required) Setup Guide - Business Process Analytics 7.1 SP5 at http://service.sap.com/bpm > Media Library > Technical Information.
More on SAP TechEd 2012
If you want to learn more on the new Business Process Analytics functions and how they can be used for improving business processes you can visit the following sessions during this year's SAP TechEd sessions:
- ALM109 - Improving Your Business Processes with Business Process Analytics (1h lecture)
- ALM267 - A New Generation of Business Process Analytics (2h hands-on)
- ALM802 - Improving Your Business Processes with Business Process Analytics (1h Q&A)
Further information
Frequently Asked Questions about Business Process Monitoring and Business Process Analytics are answered under http://wiki.sdn.sap.com/wiki/display/SM/FAQ+Business+Process+Monitoring and
http://wiki.sdn.sap.com/wiki/display/SM/FAQ+Business+Process+Analytics respectively.
The following blogs (in chronological order) provide further details about Business Process Monitoring / Analytics functionalities within the SAP Solution Manager.
- New Business Process Monitoring functionalities in SAP Solution Manager – ALE / IDoc Monitoring
- New Business Process Monitoring functionalities in SAP Solution Manager – qRFC Monitoring
- New Business Process Monitoring Functionalities in SAP Solution Manager - functionalities For Incons...
- SAP Business Process Monitoring within SAP Solution Manager
- New Business Process Monitoring functionalities in SAP Solution Manager - BPMon Trend Analysis Repor...
- Best Practice: Business Process Monitoring for Manufacturing
- Best Practice: Business Process Monitoring for Procure to Pay
- Best Practice: Business Process Monitoring for Order to Cash
- Business Process Monitoring - Template configuration available for download
- FAQs about Business Process Monitoring
- Typical Use Cases for Business Process Monitoring in SAP Solution Manager
- New Business Process Monitoring functionalities in SAP Solution Manager - Customer Exit
- New key figure catalog for Business Process Monitoring available
- Why SAP offers different tools for Business Process Monitoring & Business Process Optimization
- Create your own auto-reaction messages in Business Process Monitoring via BAdI exit
- Protect your SAP ERP investment & improve your core business processes
- Refresh Solution Landscape cache for Business Process Operation Work Center
- Create your own customer-specific key figure for Business Process Monitoring within 5 minutes
- Best Practice: BW Process Chain monitoring with SAP Solution Manager - Part 1
- Best Practice: BW Process Chain monitoring with SAP Solution Manager - Part 2: Setup Example
- New key figures for Business Process Monitoring in SAP Solution Manager, especially for CRM Marketin...
- New functionality "Business Process Analytics" - how to improve your business processes
- New key figures for Business Process Monitoring in SAP Solution Manager, especially Lead Time measur...
- Traditional Business KPI approach vs Business Process Monitoring
- Systematic errors vs real exceptions or improving efficiency vs effectiveness
- Before you get started with SAP HANA...you should also consider cleaning-up your backend system firs...
- Best Practice: Business Process Monitoring for CRM Sales
- SAP Business Process Operations Extensions at SAP TechEd 2011
- Business Process Operations dashboards - ALL AT A GLANCE
- Business Process Operations dashboards - behind the scenes
- Customer testimonials on Business Process Analytics
- Customer Exit: Create your own key figure for BPMon AND Business Process Analytics
- Heads-up: Setup environment of BPMon & Analytics changes with SolMan 7.1 SP5
- New key figures for BPMon & BP Analytics, especially for working capital improvement
- New Business Process Monitoring functionalities in SAP Solution Manager - BPMon Alert Reporting Anal...
- New Business Process Analytics features with SAP SolMan 7.1 SP5
- SAP Managed Tags:
- SAP Solution Manager
2 Comments
You must be a registered user to add a comment. If you've already registered, sign in. Otherwise, register and sign in.
Labels in this area
-
ABAP CDS Views - CDC (Change Data Capture)
2 -
AI
1 -
Analyze Workload Data
1 -
BTP
1 -
Business and IT Integration
2 -
Business application stu
1 -
Business Technology Platform
1 -
Business Trends
1,658 -
Business Trends
91 -
CAP
1 -
cf
1 -
Cloud Foundry
1 -
Confluent
1 -
Customer COE Basics and Fundamentals
1 -
Customer COE Latest and Greatest
3 -
Customer Data Browser app
1 -
Data Analysis Tool
1 -
data migration
1 -
data transfer
1 -
Datasphere
2 -
Event Information
1,400 -
Event Information
66 -
Expert
1 -
Expert Insights
177 -
Expert Insights
296 -
General
1 -
Google cloud
1 -
Google Next'24
1 -
Kafka
1 -
Life at SAP
780 -
Life at SAP
13 -
Migrate your Data App
1 -
MTA
1 -
Network Performance Analysis
1 -
NodeJS
1 -
PDF
1 -
POC
1 -
Product Updates
4,577 -
Product Updates
342 -
Replication Flow
1 -
RisewithSAP
1 -
SAP BTP
1 -
SAP BTP Cloud Foundry
1 -
SAP Cloud ALM
1 -
SAP Cloud Application Programming Model
1 -
SAP Datasphere
2 -
SAP S4HANA Cloud
1 -
SAP S4HANA Migration Cockpit
1 -
Technology Updates
6,873 -
Technology Updates
420 -
Workload Fluctuations
1
Related Content
- Unify your process and task mining insights: How SAP UEM by Knoa integrates with SAP Signavio in Technology Blogs by SAP
- Consolidation Extension for SAP Analytics Cloud – Automated Eliminations and Adjustments (part 1) in Technology Blogs by Members
- SAP Analytics Cloud Planning - Converting data in Technology Blogs by SAP
- SAP Sustainability Footprint Management: Q1-24 Updates & Highlights in Technology Blogs by SAP
- AI Engineering in Technology Q&A
Top kudoed authors
| User | Count |
|---|---|
| 36 | |
| 25 | |
| 17 | |
| 13 | |
| 8 | |
| 7 | |
| 6 | |
| 6 | |
| 6 | |
| 6 |