
- SAP Community
- Products and Technology
- Technology
- Technology Blogs by Members
- Mobilize ALV Reports - Part 2 Create JQueryMobile ...
Technology Blogs by Members
Explore a vibrant mix of technical expertise, industry insights, and tech buzz in member blogs covering SAP products, technology, and events. Get in the mix!
Turn on suggestions
Auto-suggest helps you quickly narrow down your search results by suggesting possible matches as you type.
Showing results for
basarozgur_kahr
Contributor
Options
- Subscribe to RSS Feed
- Mark as New
- Mark as Read
- Bookmark
- Subscribe
- Printer Friendly Page
- Report Inappropriate Content
09-27-2012
3:26 PM
In my previous blog post we created a restful service that returns with ALV metada and data. Now we will develop a jquerymobile web client that calls this service and represents data in jquery datatables plugin.
Part 1 - Create RESTful service
Part 3 - Visualize ALV Data with Highcharts for iPad
Creating JqueryMobile Web Application
Pre-requisites:
- It is assumed that you are already familiar with HTML and the basic javascript usage
- Check over jquery ajax: http://api.jquery.com/jQuery.ajax
- Check over jquerymobile fundamentals & documentation: http://jquerymobile.com/demos/1.1.1/docs/about/intro.html
- Check over datatables usage: http://datatables.net
Steps:
- Create jquerymobile web page
- Call restful service to get alv data
- Parse alv metadata to create columns of datatables
- Initialize datatables plugin with alv data
index.html
<!DOCTYPE html>
<html>
<!--<html manifest="app.appcache">-->
<head>
<title></title>
<meta http-equiv="Content-Type" content="text/html; charset=UTF-8">
<meta name="apple-mobile-web-app-capable" content="yes"/>
<meta name="viewport" content="width=device-width, minimum-scale=1.0, maximum-scale=1.0, user-scalable=no" />
<link rel="shortcut icon" href="images/mysapreport.jpg" />
<link rel="stylesheet" href="css/jqm/jquery.mobile-1.1.1.min.css" />
<!-- DataTables CSS -->
<link rel="stylesheet" type="text/css" href="css/datatables/jquery.dataTables.css"/>
<link rel="stylesheet" type="text/css" href="css/datatables/ColVisAlt.css"/>
<script src="js/jqm/jquery-1.7.2.min.js"></script>
<script src="js/jqm/jquery.mobile-1.1.1.min.js"></script>
<!-- DataTables -->
<script type="text/javascript" src="js/datatables/jquery.dataTables.min.js"></script>
<script type="text/javascript" src="js/datatables/ColVis.min.js"></script>
<script type="text/javascript" src="js/datatables/TableTools.min.js"></script>
<script type="text/javascript" src="js/settings.js"></script>
<script type="text/javascript" src="js/table.js"></script>
<script>
$.support.cors = true;
jQuery.support.cors = true;
</script>
</head>
<body>
<div data-role="page" id="alv" data-theme="e">
<div data-role="header" data-position="fixed">
<h1>ALV</h1>
<a href="#settings" data-role="button" data-icon="gear" data-theme="b">Settings</a>
</div>
<div data-role="content" >
<div data-role="fieldcontain">
<label for="transaction">Transaction:</label>
<input type="text" name="transaction" id="transaction" value="" />
</div>
<div data-role="fieldcontain">
<label for="variant">Variant:</label>
<input type="text" name="variant" id="variant" value="" />
</div>
<a href="javascript:getALV()" data-role="button" data-icon="grid" data-theme="b">Call Report</a>
<br>
</div>
</div>
<div data-role="dialog" id="settings">
<div data-role="content" >
<label for="connectUrl">Connect to:</label>
<input type="url" name="connectUrl" id="connectUrl" value="" data-mini="true" />
<label for="username">Username:</label>
<input type="text" name="username" id="username" value="" data-mini="true" />
<label for="password">Password:</label>
<input type="password" name="password" id="password" value="" data-mini="true" />
<br>
<a href="javascript:exitSettings()" data-role="button" data-icon="delete">Exit</a>
<a href="javascript:saveSettings()" data-role="button" data-icon="check" data-theme="b">Save</a>
</div>
</div>
<div data-role="page" id="showDatatable" data-theme="e" data-add-back-btn="true" data-dom-cache="true">
<div data-role="header" data-position="fixed">
<h1 id="datatableHeader">ALV</h1>
<div class="ui-btn-right">
<a href="#chartRules" data-role="button" data-icon="star" data-theme="e" data-back="true">Chart</a>
</div>
</div>
<div data-role="content">
<div id="dynamicDatatableDIV" >
<!--<table id="dynamicDatatable" class="tbl_basket_style"></table>-->
</div>
</div>
</div>
</body>
</html>
Call Restful Service:
function getALV(){
alvData = [];
alvMetadata = [];
$.ajax({
type: "GET",
url: 'http://' + $("#username").val() + ':' + $("#password").val() + '@' + $("#connectUrl").val() + '?tcode=' + $("#transaction").val() + '&variant=' + $("#variant").val(),
data: "",
dataType: "jsonp",
contentType: "application/javascript",
username:$("#username").val(),
password:$("#password").val(),
jsonpCallback:"jsonp_success",
crossDomain: true,
cache: false,
timeout: 10000,
xhrFields: {
withCredentials: true
},
beforeSend: function(xhr, settings){
$.mobile.showPageLoadingMsg();
},
complete: function(xhr, textStatus) {
$.mobile.hidePageLoadingMsg();
if (alvMetadata){
createDynamicTable(getColumnData(alvMetadata),alvData);
$.mobile.changePage('#showDatatable');
$('#datatableHeader').text(reportDescription);
}
},
success: function(sys){
},
error: function( result ){
if (result.statusText !== "success"){
alert('Error!! Unable to call ALV Report. Please check your settings & SAP connection');
$.mobile.changePage('#settings');
}
}
}); // Ajax posting
}
function JSONP_SUCCESS(result){
reportDescription = result.description;
alvMetadata = result.alvMetadata;
alvData = result.alvData;
//sort ALV metadata according to col_pos
alvMetadata.sort(function(a,b) {
return (parseInt(a.col_pos) > parseInt(b.col_pos)) ? 1 : ((parseInt(b.col_pos) > parseInt(a.col_pos)) ? -1 : 0);
} );
}
Datatables Columns Creation
function getColumnData(alvMetadata){
var column = new Array();
var type;
var just;
var sclass;
var visible;
var visCount = 0;
for(i=0;i<alvMetadata.length;i++){
type = alvMetadata[i].inttype;
just = alvMetadata[i].just;
visible = alvMetadata[i].no_out;
switch (type){
case 'D':
type = "date";
break;
case 'N':
type = "string";
break;
case 'P':
type = "numeric";
break;
case 'I':
type = "numeric";
break;
case 'F':
type = "numeric";
break;
default:
type = "string";
break;
}
switch (just){
case 'L':
sclass = "left-align";
break;
case 'R':
sclass = "right-align";
break;
case 'C':
sclass = "center-align";
break;
default:
sclass = "left-align";
break;
}
if (visible == 'X' || visCount > 5)
visible = false;
else{
visible = true;
visCount++;
}
column.push({
"mDataProp":alvMetadata[i].fieldname.toLowerCase(),
"sName": alvMetadata[i].fieldname,
"sTitle": alvMetadata[i].seltext,
"sType": type,
"sClass": sclass,
"bVisible": visible
});
}
return column;
}
Initialize Datatables
function createDynamicTable(aColumnData,aDataSet){
$('#dynamicDatatableDIV').html( '<table id="dynamicDatatable" class="tbl_basket_style"></table>' );
var alvTable = $('#dynamicDatatable').dataTable( {
"sDom": 'rfCtip',
"bStateSave": true,//length, filtering, pagination and sorting not change when refresh(cooki)
"sPaginationType": "full_numbers",
"iDisplayLength": 65536,
"oColVis": {
"bRestore": true
},
"bUseRendered": false,
"aaData": aDataSet,
"aoColumns": aColumnData
} );
}
Test
After publishing service on your own system, you can call it only by editing settings in MySapReport . Web client saves your settings on localstorage except password. Password is saved on sessionstorage. So don't need to edit connection url and username in each visit of client application but password is asked for each session.
You can run demo with empty settings.
If you want, you can publish client as BSP pages on sap ITS. For step by step instructions read John Moy's blog .
You can find all sources codes on https://github.com/basarozgur/MySapReport
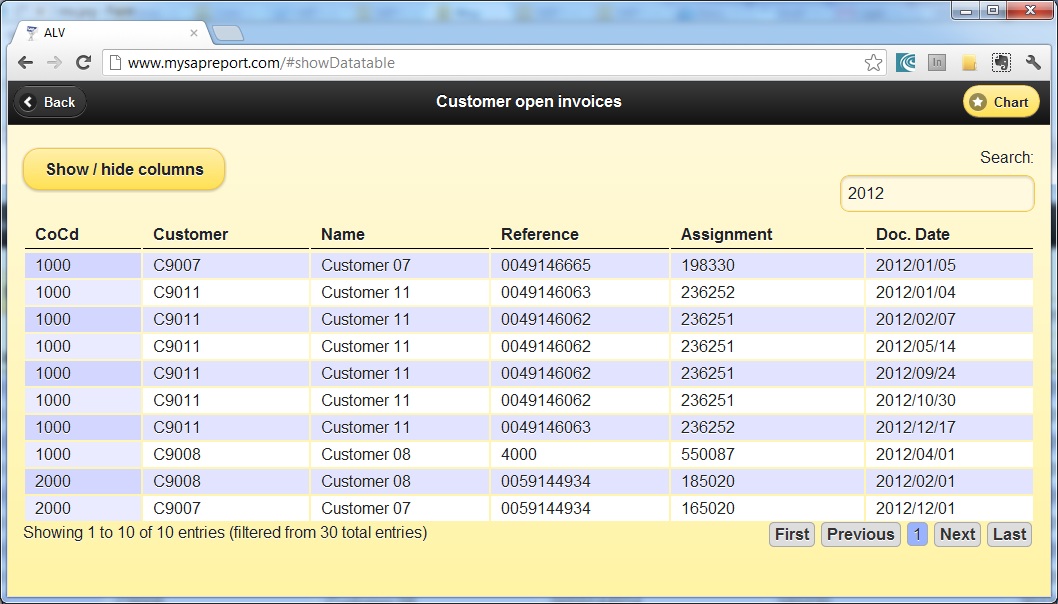
Screen Shots:
Transaction code entry

Settings

Report Data
Datatables Show / Hide Columns

- SAP Managed Tags:
- Mobile
5 Comments
You must be a registered user to add a comment. If you've already registered, sign in. Otherwise, register and sign in.
Labels in this area
-
"automatische backups"
1 -
"regelmäßige sicherung"
1 -
505 Technology Updates 53
1 -
ABAP
14 -
ABAP API
1 -
ABAP CDS Views
2 -
ABAP CDS Views - BW Extraction
1 -
ABAP CDS Views - CDC (Change Data Capture)
1 -
ABAP class
2 -
ABAP Cloud
2 -
ABAP Development
5 -
ABAP in Eclipse
1 -
ABAP Platform Trial
1 -
ABAP Programming
2 -
abap technical
1 -
absl
1 -
access data from SAP Datasphere directly from Snowflake
1 -
Access data from SAP datasphere to Qliksense
1 -
Accrual
1 -
action
1 -
adapter modules
1 -
Addon
1 -
Adobe Document Services
1 -
ADS
1 -
ADS Config
1 -
ADS with ABAP
1 -
ADS with Java
1 -
ADT
2 -
Advance Shipping and Receiving
1 -
Advanced Event Mesh
3 -
AEM
1 -
AI
7 -
AI Launchpad
1 -
AI Projects
1 -
AIML
9 -
Alert in Sap analytical cloud
1 -
Amazon S3
1 -
Analytical Dataset
1 -
Analytical Model
1 -
Analytics
1 -
Analyze Workload Data
1 -
annotations
1 -
API
1 -
API and Integration
3 -
API Call
2 -
Application Architecture
1 -
Application Development
5 -
Application Development for SAP HANA Cloud
3 -
Applications and Business Processes (AP)
1 -
Artificial Intelligence
1 -
Artificial Intelligence (AI)
4 -
Artificial Intelligence (AI) 1 Business Trends 363 Business Trends 8 Digital Transformation with Cloud ERP (DT) 1 Event Information 462 Event Information 15 Expert Insights 114 Expert Insights 76 Life at SAP 418 Life at SAP 1 Product Updates 4
1 -
Artificial Intelligence (AI) blockchain Data & Analytics
1 -
Artificial Intelligence (AI) blockchain Data & Analytics Intelligent Enterprise
1 -
Artificial Intelligence (AI) blockchain Data & Analytics Intelligent Enterprise Oil Gas IoT Exploration Production
1 -
Artificial Intelligence (AI) blockchain Data & Analytics Intelligent Enterprise sustainability responsibility esg social compliance cybersecurity risk
1 -
ASE
1 -
ASR
2 -
ASUG
1 -
Attachments
1 -
Authorisations
1 -
Automating Processes
1 -
Automation
1 -
aws
2 -
Azure
1 -
Azure AI Studio
1 -
B2B Integration
1 -
Backorder Processing
1 -
Backup
1 -
Backup and Recovery
1 -
Backup schedule
1 -
BADI_MATERIAL_CHECK error message
1 -
Bank
1 -
BAS
1 -
basis
2 -
Basis Monitoring & Tcodes with Key notes
2 -
Batch Management
1 -
BDC
1 -
Best Practice
1 -
bitcoin
1 -
Blockchain
3 -
BOP in aATP
1 -
BOP Segments
1 -
BOP Strategies
1 -
BOP Variant
1 -
BPC
1 -
BPC LIVE
1 -
BTP
11 -
BTP Destination
2 -
Business AI
1 -
Business and IT Integration
1 -
Business application stu
1 -
Business Architecture
1 -
Business Communication Services
1 -
Business Continuity
1 -
Business Data Fabric
3 -
Business Partner
12 -
Business Partner Master Data
10 -
Business Technology Platform
2 -
Business Trends
1 -
CA
1 -
calculation view
1 -
CAP
3 -
Capgemini
1 -
CAPM
1 -
Catalyst for Efficiency: Revolutionizing SAP Integration Suite with Artificial Intelligence (AI) and
1 -
CCMS
2 -
CDQ
12 -
CDS
2 -
Cental Finance
1 -
Certificates
1 -
CFL
1 -
Change Management
1 -
chatbot
1 -
chatgpt
3 -
CL_SALV_TABLE
2 -
Class Runner
1 -
Classrunner
1 -
Cloud ALM Monitoring
1 -
Cloud ALM Operations
1 -
cloud connector
1 -
Cloud Extensibility
1 -
Cloud Foundry
3 -
Cloud Integration
6 -
Cloud Platform Integration
2 -
cloudalm
1 -
communication
1 -
Compensation Information Management
1 -
Compensation Management
1 -
Compliance
1 -
Compound Employee API
1 -
Configuration
1 -
Connectors
1 -
Consolidation Extension for SAP Analytics Cloud
1 -
Controller-Service-Repository pattern
1 -
Conversion
1 -
Cosine similarity
1 -
cryptocurrency
1 -
CSI
1 -
ctms
1 -
Custom chatbot
3 -
Custom Destination Service
1 -
custom fields
1 -
Customer Experience
1 -
Customer Journey
1 -
Customizing
1 -
Cyber Security
2 -
Data
1 -
Data & Analytics
1 -
Data Aging
1 -
Data Analytics
2 -
Data and Analytics (DA)
1 -
Data Archiving
1 -
Data Back-up
1 -
Data Governance
5 -
Data Integration
2 -
Data Quality
12 -
Data Quality Management
12 -
Data Synchronization
1 -
data transfer
1 -
Data Unleashed
1 -
Data Value
8 -
database tables
1 -
Datasphere
2 -
datenbanksicherung
1 -
dba cockpit
1 -
dbacockpit
1 -
Debugging
2 -
Delimiting Pay Components
1 -
Delta Integrations
1 -
Destination
3 -
Destination Service
1 -
Developer extensibility
1 -
Developing with SAP Integration Suite
1 -
Devops
1 -
digital transformation
1 -
Documentation
1 -
Dot Product
1 -
DQM
1 -
dump database
1 -
dump transaction
1 -
e-Invoice
1 -
E4H Conversion
1 -
Eclipse ADT ABAP Development Tools
2 -
edoc
1 -
edocument
1 -
ELA
1 -
Embedded Consolidation
1 -
Embedding
1 -
Embeddings
1 -
Employee Central
1 -
Employee Central Payroll
1 -
Employee Central Time Off
1 -
Employee Information
1 -
Employee Rehires
1 -
Enable Now
1 -
Enable now manager
1 -
endpoint
1 -
Enhancement Request
1 -
Enterprise Architecture
1 -
ETL Business Analytics with SAP Signavio
1 -
Euclidean distance
1 -
Event Dates
1 -
Event Driven Architecture
1 -
Event Mesh
2 -
Event Reason
1 -
EventBasedIntegration
1 -
EWM
1 -
EWM Outbound configuration
1 -
EWM-TM-Integration
1 -
Existing Event Changes
1 -
Expand
1 -
Expert
2 -
Expert Insights
1 -
Fiori
14 -
Fiori Elements
2 -
Fiori SAPUI5
12 -
Flask
1 -
Full Stack
8 -
Funds Management
1 -
General
1 -
Generative AI
1 -
Getting Started
1 -
GitHub
8 -
Grants Management
1 -
groovy
1 -
GTP
1 -
HANA
5 -
HANA Cloud
2 -
Hana Cloud Database Integration
2 -
HANA DB
1 -
HANA XS Advanced
1 -
Historical Events
1 -
home labs
1 -
HowTo
1 -
HR Data Management
1 -
html5
8 -
Identity cards validation
1 -
idm
1 -
Implementation
1 -
input parameter
1 -
instant payments
1 -
Integration
3 -
Integration Advisor
1 -
Integration Architecture
1 -
Integration Center
1 -
Integration Suite
1 -
intelligent enterprise
1 -
Java
1 -
job
1 -
Job Information Changes
1 -
Job-Related Events
1 -
Job_Event_Information
1 -
joule
4 -
Journal Entries
1 -
Just Ask
1 -
Kerberos for ABAP
8 -
Kerberos for JAVA
8 -
Launch Wizard
1 -
Learning Content
2 -
Life at SAP
1 -
lightning
1 -
Linear Regression SAP HANA Cloud
1 -
local tax regulations
1 -
LP
1 -
Machine Learning
2 -
Marketing
1 -
Master Data
3 -
Master Data Management
14 -
Maxdb
2 -
MDG
1 -
MDGM
1 -
MDM
1 -
Message box.
1 -
Messages on RF Device
1 -
Microservices Architecture
1 -
Microsoft Universal Print
1 -
Middleware Solutions
1 -
Migration
5 -
ML Model Development
1 -
Modeling in SAP HANA Cloud
8 -
Monitoring
3 -
MTA
1 -
Multi-Record Scenarios
1 -
Multiple Event Triggers
1 -
Neo
1 -
New Event Creation
1 -
New Feature
1 -
Newcomer
1 -
NodeJS
2 -
ODATA
2 -
OData APIs
1 -
odatav2
1 -
ODATAV4
1 -
ODBC
1 -
ODBC Connection
1 -
Onpremise
1 -
open source
2 -
OpenAI API
1 -
Oracle
1 -
PaPM
1 -
PaPM Dynamic Data Copy through Writer function
1 -
PaPM Remote Call
1 -
PAS-C01
1 -
Pay Component Management
1 -
PGP
1 -
Pickle
1 -
PLANNING ARCHITECTURE
1 -
Popup in Sap analytical cloud
1 -
PostgrSQL
1 -
POSTMAN
1 -
Process Automation
2 -
Product Updates
4 -
PSM
1 -
Public Cloud
1 -
Python
4 -
Qlik
1 -
Qualtrics
1 -
RAP
3 -
RAP BO
2 -
Record Deletion
1 -
Recovery
1 -
recurring payments
1 -
redeply
1 -
Release
1 -
Remote Consumption Model
1 -
Replication Flows
1 -
Research
1 -
Resilience
1 -
REST
1 -
REST API
1 -
Retagging Required
1 -
Risk
1 -
Rolling Kernel Switch
1 -
route
1 -
rules
1 -
S4 HANA
1 -
S4 HANA Cloud
1 -
S4 HANA On-Premise
1 -
S4HANA
3 -
S4HANA_OP_2023
2 -
SAC
10 -
SAC PLANNING
9 -
SAP
4 -
SAP ABAP
1 -
SAP Advanced Event Mesh
1 -
SAP AI Core
8 -
SAP AI Launchpad
8 -
SAP Analytic Cloud Compass
1 -
Sap Analytical Cloud
1 -
SAP Analytics Cloud
4 -
SAP Analytics Cloud for Consolidation
2 -
SAP Analytics Cloud Story
1 -
SAP analytics clouds
1 -
SAP BAS
1 -
SAP Basis
6 -
SAP BODS
1 -
SAP BODS certification.
1 -
SAP BTP
20 -
SAP BTP Build Work Zone
2 -
SAP BTP Cloud Foundry
5 -
SAP BTP Costing
1 -
SAP BTP CTMS
1 -
SAP BTP Innovation
1 -
SAP BTP Migration Tool
1 -
SAP BTP SDK IOS
1 -
SAP Build
11 -
SAP Build App
1 -
SAP Build apps
1 -
SAP Build CodeJam
1 -
SAP Build Process Automation
3 -
SAP Build work zone
10 -
SAP Business Objects Platform
1 -
SAP Business Technology
2 -
SAP Business Technology Platform (XP)
1 -
sap bw
1 -
SAP CAP
2 -
SAP CDC
1 -
SAP CDP
1 -
SAP Certification
1 -
SAP Cloud ALM
4 -
SAP Cloud Application Programming Model
1 -
SAP Cloud Integration for Data Services
1 -
SAP cloud platform
8 -
SAP Companion
1 -
SAP CPI
3 -
SAP CPI (Cloud Platform Integration)
2 -
SAP CPI Discover tab
1 -
sap credential store
1 -
SAP Customer Data Cloud
1 -
SAP Customer Data Platform
1 -
SAP Data Intelligence
1 -
SAP Data Migration in Retail Industry
1 -
SAP Data Services
1 -
SAP DATABASE
1 -
SAP Dataspher to Non SAP BI tools
1 -
SAP Datasphere
9 -
SAP DRC
1 -
SAP EWM
1 -
SAP Fiori
2 -
SAP Fiori App Embedding
1 -
Sap Fiori Extension Project Using BAS
1 -
SAP GRC
1 -
SAP HANA
1 -
SAP HCM (Human Capital Management)
1 -
SAP HR Solutions
1 -
SAP IDM
1 -
SAP Integration Suite
9 -
SAP Integrations
4 -
SAP iRPA
2 -
SAP Learning Class
1 -
SAP Learning Hub
1 -
SAP Odata
2 -
SAP on Azure
1 -
SAP PartnerEdge
1 -
sap partners
1 -
SAP Password Reset
1 -
SAP PO Migration
1 -
SAP Prepackaged Content
1 -
SAP Process Automation
2 -
SAP Process Integration
2 -
SAP Process Orchestration
1 -
SAP S4HANA
2 -
SAP S4HANA Cloud
1 -
SAP S4HANA Cloud for Finance
1 -
SAP S4HANA Cloud private edition
1 -
SAP Sandbox
1 -
SAP STMS
1 -
SAP SuccessFactors
2 -
SAP SuccessFactors HXM Core
1 -
SAP Time
1 -
SAP TM
2 -
SAP Trading Partner Management
1 -
SAP UI5
1 -
SAP Upgrade
1 -
SAP-GUI
8 -
SAP_COM_0276
1 -
SAPBTP
1 -
SAPCPI
1 -
SAPEWM
1 -
sapmentors
1 -
saponaws
2 -
SAPUI5
4 -
schedule
1 -
Secure Login Client Setup
8 -
security
9 -
Selenium Testing
1 -
SEN
1 -
SEN Manager
1 -
service
1 -
SET_CELL_TYPE
1 -
SET_CELL_TYPE_COLUMN
1 -
SFTP scenario
2 -
Simplex
1 -
Single Sign On
8 -
Singlesource
1 -
SKLearn
1 -
soap
1 -
Software Development
1 -
SOLMAN
1 -
solman 7.2
2 -
Solution Manager
3 -
sp_dumpdb
1 -
sp_dumptrans
1 -
SQL
1 -
sql script
1 -
SSL
8 -
SSO
8 -
Substring function
1 -
SuccessFactors
1 -
SuccessFactors Time Tracking
1 -
Sybase
1 -
system copy method
1 -
System owner
1 -
Table splitting
1 -
Tax Integration
1 -
Technical article
1 -
Technical articles
1 -
Technology Updates
1 -
Technology Updates
1 -
Technology_Updates
1 -
Threats
1 -
Time Collectors
1 -
Time Off
2 -
Tips and tricks
2 -
Tools
1 -
Trainings & Certifications
1 -
Transport in SAP BODS
1 -
Transport Management
1 -
TypeScript
2 -
unbind
1 -
Unified Customer Profile
1 -
UPB
1 -
Use of Parameters for Data Copy in PaPM
1 -
User Unlock
1 -
VA02
1 -
Validations
1 -
Vector Database
1 -
Vector Engine
1 -
Visual Studio Code
1 -
VSCode
1 -
Web SDK
1 -
work zone
1 -
workload
1 -
xsa
1 -
XSA Refresh
1
- « Previous
- Next »
Related Content
- Can i make a bulk set editable false in the matrix?? in Technology Q&A
- Repeated Login Prompt in Technology Q&A
- Data Table creation using File as back end (File connection as system connection) in Technology Blogs by Members
- SMP 3.0 Agentry: Where to put data table files? in Technology Q&A
- Custom Data Table in Work Manager 6.1 / SMP 3.0 in Technology Q&A
Top kudoed authors
| User | Count |
|---|---|
| 11 | |
| 9 | |
| 7 | |
| 6 | |
| 4 | |
| 4 | |
| 3 | |
| 3 | |
| 3 | |
| 3 |