
- SAP Community
- Products and Technology
- Additional Blogs by Members
- Building a Web Services Based Visual Composer Appl...
Additional Blogs by Members
Turn on suggestions
Auto-suggest helps you quickly narrow down your search results by suggesting possible matches as you type.
Showing results for
Former Member
Options
- Subscribe to RSS Feed
- Mark as New
- Mark as Read
- Bookmark
- Subscribe
- Printer Friendly Page
- Report Inappropriate Content
10-11-2006
10:21 PM
Introduction
Hello again everyone, I have had a couple of people including a colleague of mine ask me if I had created a blog about creating a web service based application using the SAP NetWeaver Visual Composer. I mentioned I had created one but hadn't blogged about it yet so here we go.
One of the coolest and most extensible parts of the Visual Composer is the capability to easily link to and consume a web service from within the SAP NetWeaver Visual Composer storyboard. Curious how to do this? Read on...
Buiding a Web Service based Visual Composer Application
Ok, Let's Begin!
1/ The first thing we have to do is login to the Visual Composer.
Figure 1.1
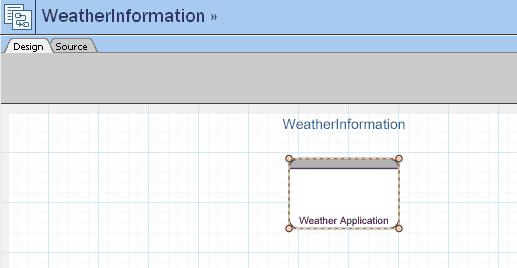
2/ Once logged into the Visual Composer create a new model call it Weather Information.
Figure 1.2

3/ Drag and drop an iView into the Visual Composer work area, name the iView: Weather Application
Figure 1.3
4/ Now we need to create a web service system to build the Weather application so first select the ‘Define Web service system’ option from the ‘Tools’ menu.
Figure 1.4

5/ Next enter the WSDL, a name and system alias for this new system being created. Name the system WeatherSystem use the same name for the alias as well. The WSDL to use for the Web service URL entry is http://www.webservicex.net/WeatherForecast.asmx?WSDL. Once finished hit the ‘Create’ button.
Figure 1.5

6/ Now that we have created our Web Services system, navigate to the Find Data tab and choose the system WeatherSystem. Display all services available for this system.
Figure 1.6

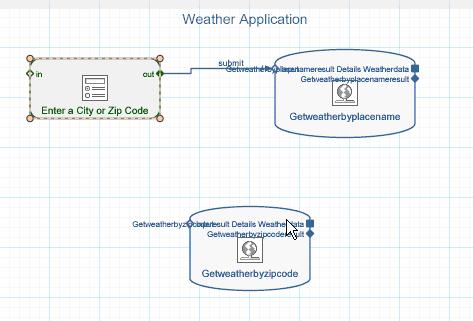
7/ Drag both of the data services into the Visual Composer work area.
Figure 1.7

8/ From the input port drag and drop a form into the work area
Figure 1.8

9/ Give the form the title Enter a City or Zip Code
Figure 1.9
10/ We are now going to add a field to the form ZIP CODE.
Figure 2.0

11/ Navigate to the Layout tab, right click on the PlaceName Field and change the label to “City”. Repeat this step for the ZIPCODE Field and change the label to “Zip Code”.
Figure 2.1

12/ Drag & Drop the input of the zipcode specific web service to the output port of the form. Map the ZIPCODE from the form to the ZipCode of the Web Service. The single input form will control both of the web service calls.
Figure 2.2

13/ Drag a table view out from the top output port of the two web services. Name the table views Weather by City & Weather by Zip Code respectively.
Figure 2.3

14/ Navigate to the Layout tab of the Visual Composer and stack the input form, the Weather by City and Weather by Zip Code views on top of one another.
Figure 2.4

15/ Make sure that in our table views we are only displaying the:
- Day
- Minimum Temp (Fahrenheit)
- Maximum Temp (Fahrenheit)
Figure 2.5

16/ Deploy the model
Figure 2.6

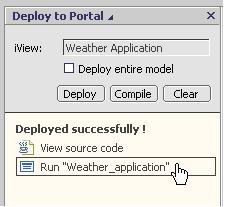
17/ Launch the iView
Figure 2.7

18/ View the Results
Figure 2.8

We have now completed the beginner portion of the exercise... For the advanced portion, which utilizes more features within the Visual Composer read on!
Advanced Functionality
19/ Now we are going to modify our existing application and make it a lot more user friendly. Re-open the model we have created thus far.
Figure 2.9

20/ The first thing we will do is enforce that the user entry screen is populated correctly by using guard conditions. We only want our users to populate only the ZIP code or the city not both. So we need to click on the submit connector to the web service Getweatherbyplacename.
Figure 3.0

21/ Open the guard condition by double clicking on the fx in the right hand corner of the input field.
Figure 3.1

22/ The submit event should be invoked when only the placeName is populated and not the zip code.
Enter the following expression into the Guard Condition:
- BOOL(IF(@PlaceName == '' OR @ZIPCODE <> '',false,true))
Figure 3.2

23/ We now have to set up the guard conditions for the other web service. Click on the submit link to the Getweatherbyzipcode web service and open the guard condition.
Enter the following expression into the Guard Condition:
- BOOL(IF(@PlaceName <> '' OR @ZIPCODE == '',false,true))
Figure 3.3

24/ If only one of the Web services is invoked either the Getweatherbyplacename or Getweatherbyzipcode logic would dictate that we only want to see the resulting output of the web service we invoked. To make sure that just one of the table views is visible at a time we need to utilize the visibility conditions of the table views.
- Click on the Weather by City Table View
Figure 3.4

25/ We need to create a datastore variable and call it cityorzip.
- Drag and drop a datastore object into the work area and double click on the object.
Figure 3.5

26/ Click on the new field button and create the variable
- CITYORZIP
Figure 3.6

27/ Navigate back to the Weather by City table view and double click on the Visibility condition as seen in step 24.
Figure 3.7

28/ Enter the following condition for visibility:
- BOOL(IF(STORE@CITYORZIP == 'CITY',true,false))
- Along with setting the Visibility condition set the Transition effect to Fade In/Out.
Figure 3.8

29/ Double click on the Weather by Zip Code table view.
Figure 3.9

30/ Double click on the Visibility condition and enter the following expression:
- BOOL(IF(STORE@CITYORZIP == 'ZIP',true,false))
- Set the Transition effect to Fade In/Out
Figure 4.0

31/ We now need to update the data store so that it reflects the correct value for the datastore variable CITYORZIP.
- Drag and drop from the entry form and add a datastore.
Figure 4.1

32/ Right click on the the link to the datastore just generated and click the Event Selector button. Choose the submit event and hit the OK button.
Figure 4.2

33/ Map a blank value to the datastore.
Figure 4.3

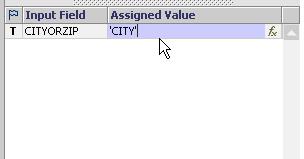
34/ Drag and drop from the output port of the Getweatherbyplacename service and choose the Data Store option from the context menu.
Figure 4.4

35/ Select the link just generated and map the value ‘CITY’ to the datastore variable CITYORZIP.
Figure 4.5
36/ Connect the Getweatherbyzipcode service to the already existing datastore object and map the value ‘ZIP’ to the datastore variable CITYORZIP.
Figure 4.6

Figure 4.6A

37/ Navigate to the layout tab of the Visual Composer storyboard and overlay the two table views so they are sitting one right on top of the other.
Figure 4.7

38/ What’s an analytical app without some chart visualization so:
- Drag and drop from the Getweatherbyplacename service and create a new chart view.
- Double click on the chart view to expose its properties
Figure 4.8

39/ Configure the chart as seen on the right
Figure 4.9

Figure 4.9A

40/ Add the following two data series to the chart
- Minimum Temperature = NVAL(@MinTemperatureF)
- Maximum Temperature = NVAL(MaxTemperatureF)
Figure 5.0

Figure 5.0A

41/ Once the data series have been setup set the visibility condition for the chart view just as you did for the Weather by City table view.
Set the expression to:
- BOOL(IF(STORE@CITYORZIP == 'CITY',true,false))
Figure 5.1

42/ Set the transition effect to Fade In/Out
Figure 5.2

43/ Create a chart view for the Getweatherbyzipcode service as well.
- Drag and drop from the output port of the service and create a chart view named Min & Max Temperatures
Figure 5.3

44/ Configure the chart as can be seen on the right
Figure 5.4

45/ Create two data series just as was performed in step 40.
- One series for Minimum temperature in Fahrenheit
- One series for Maximum temperature in Fahrenheit
Figure 5.5

46/ Navigate to the visibility condition of the newly created chart view and set it up just as the Weather by Zip code table view is set up.
Figure 5.6

47/ Set the Transition effect to Fade In/Out
Figure 5.7

48/ Navigate to the layout tab and associate the two chart views one on top of the other to the right of the initial entry form.
Figure 5.8

49/ Navigate back to the design tab and drag and drop an HTML view onto the work area. Name the HTML View Weather Image.
Figure 5.9

50/ Map both the Weather by City output port and the Weather by Zip Code output ports to the Weather Image input port. Map the url of the input port to the value @WeatherImage coming from both output ports.
Figure 6.0

51/ Select the Weather Image HTML View and double click on the Visibility condition. Set the Visibility condition to the following expression:
- BOOL(IF(STORE@CITYORZIP <> '',true,false))
- Select the OK button
- Make sure you set up the Transition effect as Fade In/Out
Figure 6.1

52/ Navigate to the Layout tab and place the Weather Image HTML View to the right of the two overlayed chart views. Save your work.
Figure 6.2
53/ Deploy your iView
Figure 6.3

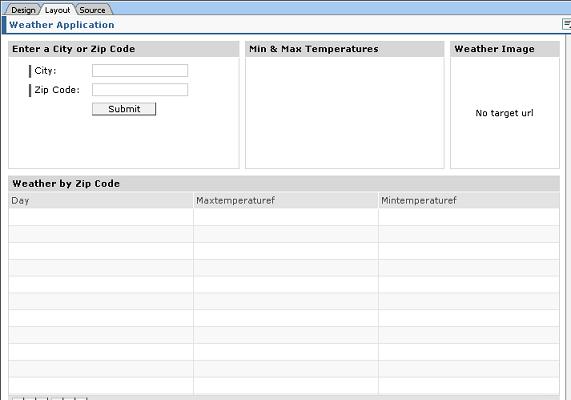
54/ Launch the iView
Figure 6.4
55/ View your completed application in the portal!
Figure 6.5

You have now completed building an Advanced Web Application in Visual Composer utilizing Web Services!!
23 Comments
Related Content
- CAP Autentication error in Technology Q&A
- Consuming SAP with SAP Build Apps - Mobile Apps for iOS and Android in Technology Blogs by SAP
- Demystifying the Common Super Domain for SAP Mobile Start in Technology Blogs by SAP
- What’s new in Mobile development kit client 24.4 in Technology Blogs by SAP
- GRC Tuesdays: Takeaways from the 2024 Internal Controls, Compliance and Risk Management Conference in Financial Management Blogs by SAP