In this article I will describe the simple mobile application consuming HANA In-Memory DB. In particular about Android based chart showing the data coming from HANA.
Taking a simple retail scenario using which user wanted to know about a product’s performance across various stores vis-a-vis quantity and price. Simple bar chart was created with X axis being the product name or store name and Y Axis being the quantity or total price of products. In this case user wanted to look into the product quality so as to check all the refunded product aggregations. In the practical scenario this would give the user an idea regarding how a product is performing in any geographical region or worst case if overall it isn’t doing well at all. Many actions could be triggered based on these evaluations.HANA In-Memory Database plays a crucial role here, since the data is not pre-aggregated, it the real-time raw POS data on which aggregation is done. In the mobile scenario user want the response in few seconds, this can only be achieved using the HANA column based tables, over which the SQL Query performs the aggregation on the column and responds in seconds/milliseconds with millions of records.
Listed below are steps of various tool usages and process to create this above business scenario’s prototype.
Step1: Install HANA studio.
Step2: Build your schema and load the data.
- Use simple create table SQL command using the SQL Editor of HANA Studio. The main difference here would be to create the columnar table. This can also be done using the HANA Studio GUI.
- Use the Load command of HANA to load the bulk data in the table. For small set of data for testing use the INSERT SQL statement.
In this case transaction table was created, which is the data from POS(Point of Sale) counters. Data has Material/Product name and transaction type such as ‘Refund’ or ‘Sale’ type and product actual price.
Step3: Download the Android Development Environment. Install the ADT plug-in for the eclipse.
Link: http://developer.android.com/sdk/installing.html
Step4: I needed the chart library to display the bar chart on the android mobile app. I used the “achartengine” open source library to display a bar graph.
Link: http://code.google.com/p/achartengine/downloads/list
Step5: Add jdbc driver of HANA to your project or in the classpath of NW.
Step6: Create a servlet which receives the request from the mobile client for aggregated analytical data. The servlet implementation uses the jdbc drivers provides in the HANA Client installation tool.
Apart from the above required software you would need Netweaver server and studio to develop & deploy the servlet.
The three layered architecture to consume the data is shown in the diagram below:

Android / Mobile layer (GUI) layer Implementation:
- Main android activity wch fetches the data from the servlet using the HTTP GET.
- Data model of “Product & Quality” data which is stored in the list.
- Setting dialog is implemented to change the X-Axis and Y-Axis. X-Axis can be Product Name or Store Name and. Y-Axis can be quantity and total actual price.
- Using the achartengine API chart gets displayed in the main view.
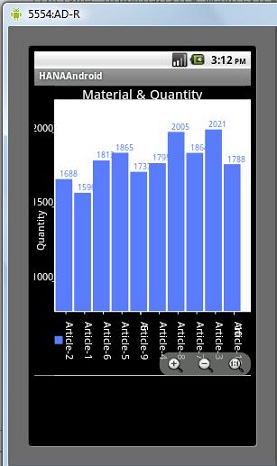
Product and Quantity – “Aricle-3” is being refunded the most.
NetWeaver Servlet Implementation:
The servlet was implemented within the net weaver layer which fetches the data using the calculation View of the HANA In Memory Studio. This servlet currently returns a simple string response using comma as column separator and line break for the next record.
HANA Studio Modeling:
The HANA studio was used to create the POS transaction table and the sample data was loaded. Create Calculation view to fetch the data from the columnar POS transaction table and aggregate it across Product and Store id with quantity and actual price as measure. This calculation view is visible to servlet via the jdbc drivers.
Here is the screen shot of the simulator display for Android:

Setting Dialog to select the Axis..
The above retail example shows the end to end scenario of mobile application consuming the HANA - In Memory DB. I see unlimited potential of mobile apps consuming RESTful API’s (via HTTP GET /POST) or web services as HANA new DB provides the power of analytics in milliseconds.
I think we have huge potential of using HANA within mobile application and perform real real-time analytics on hand held devices for various industries.
