
- SAP Community
- Products and Technology
- Additional Blogs by SAP
- End-User Experience Monitoring (EEM) - What it is ...
Additional Blogs by SAP
Turn on suggestions
Auto-suggest helps you quickly narrow down your search results by suggesting possible matches as you type.
Showing results for
former_member18
Participant
Options
- Subscribe to RSS Feed
- Mark as New
- Mark as Read
- Bookmark
- Subscribe
- Printer Friendly Page
- Report Inappropriate Content
12-07-2011
4:27 AM
When first reading or hearing about what EEM is, many find it very interesting and more or less everybody I talked to liked the idea and concept of the tool. However, whenever it had to be determined why the methodology should be implemented most implementation activities ran out of steam. In this blog I would like to share views about how and when to use the tool in order to address meaningful use cases: help giving a promising concept a clear purpose in order to justify the investments required to truly adopt it.
I will start with a rough overview of some use cases. More details will follow over time.
- Monitoring of response times and availability
- Automated Root Cause Analysis
- Continuous Improvement
- Business Continuity
Monitoring of response times and availability
The regular execution of a synthetic script would give you the possibility to get a notification about a problem before the end users are complaining about it. This would include the following potential problems:
- Increasing response times at one or more locations
- Abnormal terminations due to functional errors within the application (e.g. exceptions because of database problems)
- System down situations even if no user using the system (e.g. during the night)
You can already start the investigation immediately after you got a notification from EEM and get additional time before your business is involved.
An example would be a down situation of your internal corporate Portal. If the system goes down at midnight and the first end users are trying to use the Portal at 8am you would have around 8 hours for investigation and fix of the problem. As if nothing had happened …

The graph above shows some spikes in response times as well as functional problems (the red crosses). If you select one of the monitoring points – or a red cross, the monitoring UI will show you the related execution and provide more details.

A look into the Server log files shows that the server was restarted at this time.
Automated Root Cause Analysis
The tool could help to catch, to measure and analyze sporadic long response times, so-called “spikes”. Such issues are typically hard to capture and impossible to reproduce and can lead to serious arguments between business users asking to fix a problem that is perceived a “phantom” by the IT specialists
The problematic business transaction needs to be recorded once with the EEM recorder. Afterwards the script can be executed automatically on a regular basis. The more often the script runs the higher is the probability that the script execution will run into the same problem.
If you catch such a long running execution you will be able to drill down into the performance data, collected by EEM. This capturing will give you important information like:
- The probability for such a performance issue
- Precise performance measurements for the response time
- A response time break down into the involved components (e.g. Client, Server and database)

The sporadic performance degradation was caught between 10:30 and 10:45. A right mouse click on the measurement point let you jump directly into the End-to-End trace of this execution and show you details about this execution.

The time distribution between the involved layers in the picture above points already to a backend problem. Most of the time was spent on the server side.
![]()
The details show 1800 ms for the ABAP coding and more than 1min on the database. Most of the time was spend on the database.
Continuous Improvement
The idea of continuous improvement is a permanent monitoring of critical business processes for performance and functional issues. These results can be analyzed by using the integrated E2E tools of Solution Manager. Based on these results you can improve your solution on a daily basis.
Increasingly, business and IT groups agree on required transaction response times that are seen as prerequisite of a certain level of business user efficiency. With such agreements in place the IT group has the opportunity to constantly generate business benefit by improving the responsiveness of key business scenarios and have solid evidence for the achievement.
Business Continuity
The life time of a software solution sees regular maintenance events. Business’ expectation is clearly that utilization of the software is by no means negatively affected by this technical event. A comprehensive monitoring before and after these events helps you to control that your business users can work with the same – or even better - availability and performance of their process. And if the numbers indicate that this is not the case, you will exactly know where the change is coming from. You will have plenty of metrics that help referencing performance KPI on all levels, even in the test phase before the changes introduced by software maintenance are moved to production.
Samples for such events are system upgrades, applying of patches or changing in custom development.
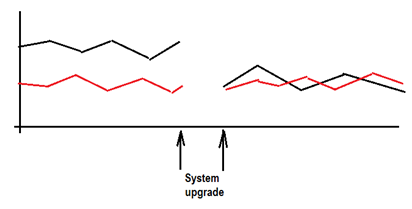
The picture above shows a successful upgrade. The system was down for a while but after the GoLive the system performed better than before, for on location and similar than before from the other location.
The reason for this could be an improved bandwidth (upgraded hardware or network connection) or an improved UI framework which reduces the data transferred to the client.

The second picture (above) shows a performance problem, introduced during an upgrade. After Go-Live the performance went down but 2 day later after applying a patch in the custom coding the system performance went back to normal.
Other EEM related Blogs:
End-User Experience Monitoring (EEM) – Use case: CRM client freeze
End-User Experience Monitoring (EEM) - Activating Custom attributes
28 Comments
Related Content
- SAP Queries/Infoset Queries data import to SAC (SAP ECC not on HANA) in Technology Q&A
- SAP Sustainability for Financial Services - Portfolio and Solutions in Financial Management Blogs by SAP
- Enhanced RISE with SAP Methodology with clean core quality checks in Enterprise Resource Planning Blogs by SAP
- Jumpstart your cloud ERP journey with guided enablement in RISE with SAP Methodology in Enterprise Resource Planning Blogs by SAP
- SAP Ariba Procure to Order 2405 Release Key Innovations in Spend Management Blogs by SAP