
- SAP Community
- Products and Technology
- Technology
- Technology Blogs by SAP
- SAP Data Hub - Develop, Run, Monitor and Trace a D...
Technology Blogs by SAP
Learn how to extend and personalize SAP applications. Follow the SAP technology blog for insights into SAP BTP, ABAP, SAP Analytics Cloud, SAP HANA, and more.
Turn on suggestions
Auto-suggest helps you quickly narrow down your search results by suggesting possible matches as you type.
Showing results for
jens_rannacher
Explorer
Options
- Subscribe to RSS Feed
- Mark as New
- Mark as Read
- Bookmark
- Subscribe
- Printer Friendly Page
- Report Inappropriate Content
01-15-2018
9:58 AM
This Tutorial explains how to use the custom Operator created in the previous tutorial in a Data Pipeline and how to run, monitor and trace the Pipeline in the SAP Data Hub Pipeline Modeler.
This is the second article of a series of tutorials:
In the following, you will learn how to use the custom Weather Sensor operator created in the previous article, to simulate sensor data being ingested from multiple devices. The tutorial explains how to visualize the generated data via a Terminal and how to persist the data into a connected HDFS (Hadoop Distributed File System) system.

The tool opens the Graph Editor where pipelines can be modeled by adding and connecting predefined operators:


Next, we want to have 5 instances of the Weather Sensor sending measurements in parallel. To achieve this, we add the operator to a group with a multiplicity of 5.


The multiplicity controls how many container instances are spawned in separate Kubernetes pods when running the pipeline.
Next, we want to connect the output of the Sensor Group to the input of two subsequent operators. To achieve the same, we add a 1:2 Multiplexer Operator to the pipeline.


Our plan is to persist the measurements into an HDFS data lake. Since we do not want to put single measurements into HDFS for performance and size reasons, we aggregate the measurements into batches. We achieve this by customizing a Javascript operator:


The CSV Aggregator produces data of type String, but we need to write data as a BLOB (Binary Large Object) into HDFS. Therefore, we convert String to BLOB with a ToBlob Converter.


All operators that are grouped together run all in the same Kubernetes Pod. The multiplicity setting of a group controls how many of such groups are instantiated, whereas each group runs in a separate pod. This allows for horizontal scalability and data locality. So for example, when more sensors are added to the pipeline, you can simply increase the multiplicity of the group to spin up additional pods in order to handle the higher load.


When you schedule a graph for execution, the tool translates the graphical representation (internally represented as a JSON document) into a set of running processes. These processes are responsible for the pipeline execution.
During the pipeline execution, the tool translates each operator in the pipeline into (server) processes and translates the input and output ports of the operators into message queues. The process runs and waits for an input message from the message queue (input port). Once it receives the input message, it starts processing to produce an output message and delivers it to the outgoing message queue (output port). If a message reaches a termination operator, the tool stops executing all processes in the graph and the data flow stops.


Since the pipeline does not have a termination operator, it continues to execute all processes until the pipeline is being stopped manually or if it fails.
When a pipeline is scheduled for execution, its status (scheduled, pending, running, completed, dead) is shown and tracked in the status tab of the bottom pane.
Initially, the pipeline is in a pending state. In this state, the pipeline is being prepared for execution. It remains in this state until either an error occurs, or state of all subgraphs in the pipeline is running.


In this view, you can see that two operator groups have been translated into process groups with different multiplicity :

In the Group view, you can see which group instance translates to which Container (Kubernetes Pod), on which Host the Container is running, the Status and more.

Overall, there are 8 Pods:

The browser opens the terminal and shows the measurements of the Weather Sensors. The output proofs that 5 instances are running in parallel:


The browser opens the terminal and shows the output of the HDFS Producer. The HDFS Producer prints the names of the files being written to HDFS. The output shows that 2 instances are running in parallel:


Tracing is a complete set of information (messages), which enables you to monitor the performance of the tool. Tracing messages also help isolate the problems or errors that may occur based on different severity threshold levels.


After you activate the tracing, the tool logs the trace messages and categorizes them based on the severity levels:

In this example, it seems like there is a problem with group3, which is the group of the “Datalake Writer”.

In this view, it shows that the container group3-0 is dead and caused a Group failure.


Congratulations, you have learned how to build a data pipeline end-2-end with a custom operator as well as built-in operators, how to run and monitor a pipeline and how to trace and debug a pipeline.
In the upcoming tutorial, you will learn how to develop an own operator which wraps external software packages:
This is the second article of a series of tutorials:
- SAP Data Hub - Develop a custom Pipeline Operator from a Base Operator (Part 1)
- SAP Data Hub - Develop, Run, Monitor and Trace a Data Pipeline (Part 2)
- SAP Data Hub – Develop a custom Pipeline Operator with own Dockerfile (Part 3)
Create a Pipeline using the custom Weather Sensor Operator
In the following, you will learn how to use the custom Weather Sensor operator created in the previous article, to simulate sensor data being ingested from multiple devices. The tutorial explains how to visualize the generated data via a Terminal and how to persist the data into a connected HDFS (Hadoop Distributed File System) system.
1. Create a Pipeline (Graph)
- In the navigation pane on left side, choose the Graphs tab and click on the + icon to create a new Pipeline (Graph):
The tool opens the Graph Editor where pipelines can be modeled by adding and connecting predefined operators:
- Press [CTRL] + [S] or click on the Disk-icon to save the Pipeline:
- Provide the Name “WeatherSensorExample” and the Description “Weather Sensor Example” and click OK:
2. Add the custom Weather Sensor Operator
- Open the Operators tab in the navigation pane on the left and search for the Weather Sensor by typing the name into the Search field:
- Add the Weather Sensor to the pipeline per drag & drop into the Graph Editor:
- You can view the documentation of the operator by first right-clicking on the operator and then by clicking on Documentation:
- Next, open the Configuration of the operator again via right click:
- In the Configuration, we can keep all the default values, but increase the sendInterval to 1000 ms (1 second) which means the Weather Sensor sends 1 measurement per second:
3. Add a Group with Multiplicity
Next, we want to have 5 instances of the Weather Sensor sending measurements in parallel. To achieve this, we add the operator to a group with a multiplicity of 5.
- Add the operator to a group via right-click on the operator and then click on Group:
- The operator is now part of a group. Open the Configuration of the group via right-click into the blue area of that group:
- Give the group a meaningful Description, e.g. “Sensor Group” and change the Multiplicity to "5":
The multiplicity controls how many container instances are spawned in separate Kubernetes pods when running the pipeline.
4. Add a Multiplexer Operator
Next, we want to connect the output of the Sensor Group to the input of two subsequent operators. To achieve the same, we add a 1:2 Multiplexer Operator to the pipeline.
- Drag & drop a 1:2 Multiplexer Ooerator to the pipeline, you can find the operator in the Multiplexer category in the Operators tab:
- Click on the Output port of the Weather Sensor, keep the Mouse button pressed and move the pointer to the Input Port of the 1:2 Multiplexer until a green circle appears, then release the mouse button to connect both operators::
5. Add a Javascript Operator
Our plan is to persist the measurements into an HDFS data lake. Since we do not want to put single measurements into HDFS for performance and size reasons, we aggregate the measurements into batches. We achieve this by customizing a Javascript operator:
- Add a Javascript Operator from the Multiplexer category in the Operators tab:
- Open the Configuration of the Javascript operator via right-click:
- Add a new Property to Operator instance which allows us later to control how many measurements are aggregated per file in HDFS:
- Type the Name “numMeasuresPerFile”, choose the Type “Text” and a default value of “100” and click OK:
- Rename the operator to “CSV Aggregator”:
- Press the Script button which appears when clicking on the Javascript operator in the Graph Editor once:
- The JavaScript snippet opens in a new tab, replace the default script by the script below which reads the numMeasuresPerFile property from the configuration of the operator and aggregates the given number of measurements into a single string:
var num = 0;

var output = "";


$.setPortCallback("input",onInput);


function onInput(ctx,input) {


    if ( num == $.config.getInt("numMeasuresPerFile") ) {

        num = 0;

        $.output(output);

        output = "";

    } else {

        num++;

        output += input + "\n";

    }

}
6. Add a ToBlob Converter
The CSV Aggregator produces data of type String, but we need to write data as a BLOB (Binary Large Object) into HDFS. Therefore, we convert String to BLOB with a ToBlob Converter.
- Add a ToBlob Converter to the pipeline, you can find the operator in the Converter category in the Operators tab:
- Connect the Output Port of the CSV Aggregator operator with the Input Port of the ToBlob Converter:
7. Add a HDFS Producer
- Add a HDFS Producer to the pipeline, you can find the Operator in the category Connectivity in the Operators tab:
- Connect the Output Port of the ToBlob Converter operator to the Input Port of the operator HDFS Producer:
8. Configure the HDFS Producer:
- Open the Configuration of the HDFS Producer via right-click:
- Provide the HDFS Namenode Host and Port (When using the SAP Data Hub Developer Edition, you can see the Hostname and Port of the HDFS Namenode in the Log output of the Docker console, e.g. 172.18.0.2:9000)
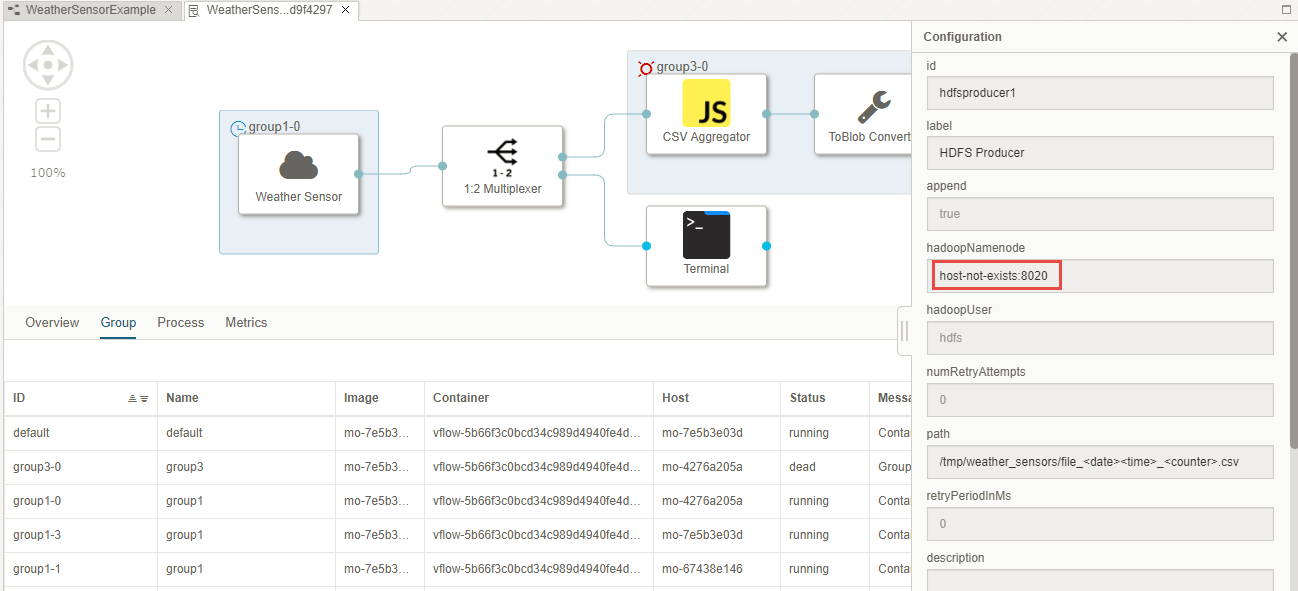
- Provide the path and the pattern of the files written into HDFS /tmp/weather_sensors/file_<date><time>_<counter>.csv:
9. Group the Operators
All operators that are grouped together run all in the same Kubernetes Pod. The multiplicity setting of a group controls how many of such groups are instantiated, whereas each group runs in a separate pod. This allows for horizontal scalability and data locality. So for example, when more sensors are added to the pipeline, you can simply increase the multiplicity of the group to spin up additional pods in order to handle the higher load.
- Press [Shift] and click on the CSV Aggregator, ToBlob Converter and HDFS Producer.
- Right-click one of the highlighted operators and click on Group:
- Open the Configuration of the Group:
- Specify the Description “Datalake Writer” and change the Multiplicity to “2”:
- Connect the Output Port of the 1:2 Multiplexer with the Input Port of the CSV Aggregator:
10. Add Terminal Operators
- Add two Terminal operators to the pipeline from the User Interface category in the operators tab:
- Connect the second Output Port of the 1:2 Multiplexer with the Input Port of the first Terminal and add the Output Port of the HDFS Producer with the Input Port of the second Terminal:
- You have now finalized the pipeline. Click again [CTRL] + [S] to save and update the pipeline in the repository.
Run, Monitor and Trace a Pipeline
1. Run the Pipeline
When you schedule a graph for execution, the tool translates the graphical representation (internally represented as a JSON document) into a set of running processes. These processes are responsible for the pipeline execution.
During the pipeline execution, the tool translates each operator in the pipeline into (server) processes and translates the input and output ports of the operators into message queues. The process runs and waits for an input message from the message queue (input port). Once it receives the input message, it starts processing to produce an output message and delivers it to the outgoing message queue (output port). If a message reaches a termination operator, the tool stops executing all processes in the graph and the data flow stops.
- Open the Graph or Repository tab and type the name “WeatherSensorExample” in the Search field:
- Click on the Graph to open it in the Graph Editor and then click the Run button:
Since the pipeline does not have a termination operator, it continues to execute all processes until the pipeline is being stopped manually or if it fails.
2. Monitor the Pipeline
When a pipeline is scheduled for execution, its status (scheduled, pending, running, completed, dead) is shown and tracked in the status tab of the bottom pane.
Initially, the pipeline is in a pending state. In this state, the pipeline is being prepared for execution. It remains in this state until either an error occurs, or state of all subgraphs in the pipeline is running.
- Open the Status tab and click on the “WeatherSensorExample” item:
- The tool opens the pipeline instance in a process view which shows the status of each process in the pipeline:
In this view, you can see that two operator groups have been translated into process groups with different multiplicity :
- Group1 which corresponds to the Weather Sensor group running five instances (0,1,2,3,4)
- Group3 which corresponds to the Datalake Writer group running two instances (0,1)
- Click on the Group tab to see more detailed information:
In the Group view, you can see which group instance translates to which Container (Kubernetes Pod), on which Host the Container is running, the Status and more.
- In the Kubernetes dashboard, you can see the link between the Containers in the Pipeline Modeler and the Pods in Kubernetes:
Overall, there are 8 Pods:
- 5 pods originate from the Weather Sensor group
- 2 pods originate from the Datalake Writer group
- 1 pod is the default pod which runs all processes that are not in a group and serves as an anchor Pod for the whole Graph.
- Open the Terminal that is connected to the 1:2 Multiplexer via Right click -> Open UI:
The browser opens the terminal and shows the measurements of the Weather Sensors. The output proofs that 5 instances are running in parallel:
- Open the Terminal that is connected to the HDFS Producer via Right click -> Open UI:
The browser opens the terminal and shows the output of the HDFS Producer. The HDFS Producer prints the names of the files being written to HDFS. The output shows that 2 instances are running in parallel:
- Stop the Graph by clicking on the stop icon in the Status tab:
3. Trace the Pipeline
Tracing is a complete set of information (messages), which enables you to monitor the performance of the tool. Tracing messages also help isolate the problems or errors that may occur based on different severity threshold levels.
- You can activate trace logging to find errors that occur sporadically. In the following, the execution of a pipeline failed and we want to find the root cause of the problem:
- Open the Trace tab in the bottom pane and click on the Trace configuration showing the Trace status on the right side:
- Set the Trace Level to “ERROR”, enable the Trace Streaming and click on OK to activate tracing:
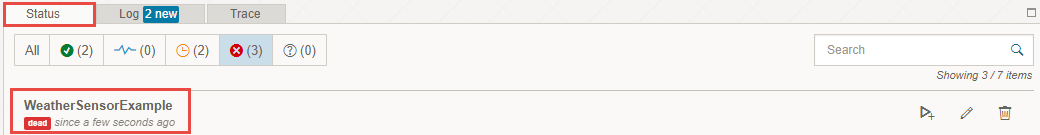
After you activate the tracing, the tool logs the trace messages and categorizes them based on the severity levels:
In this example, it seems like there is a problem with group3, which is the group of the “Datalake Writer”.
- To get more information we switch to the Group tab in the Pipeline Runtime View:
In this view, it shows that the container group3-0 is dead and caused a Group failure.
- When moving over the Container column, the tool shows the Kubernetes Pod name in a tooltip.
- You can find more information regarding this Kubernetes Pod by opening the corresponding Pod in the Kubernetes Dashboard:
- Click on Logs to view all logs of the Pod:
- The Logs show that there seems to be a problem with the connection to HDFS:
- Alternatively, you can execute the following kubectl command to describe the pod and to retrieve the logs of the pod:
# Describe the pod

kubectl -n <namespace> describe pod <pod>


# Return snapshot logs from the pod with only one container

kubectl -n sapvora logs <pod>
Congratulations, you have learned how to build a data pipeline end-2-end with a custom operator as well as built-in operators, how to run and monitor a pipeline and how to trace and debug a pipeline.
In the upcoming tutorial, you will learn how to develop an own operator which wraps external software packages:
- SAP Managed Tags:
- SAP Data Intelligence
2 Comments
You must be a registered user to add a comment. If you've already registered, sign in. Otherwise, register and sign in.
Labels in this area
-
ABAP CDS Views - CDC (Change Data Capture)
2 -
AI
1 -
Analyze Workload Data
1 -
BTP
1 -
Business and IT Integration
2 -
Business application stu
1 -
Business Technology Platform
1 -
Business Trends
1,658 -
Business Trends
93 -
CAP
1 -
cf
1 -
Cloud Foundry
1 -
Confluent
1 -
Customer COE Basics and Fundamentals
1 -
Customer COE Latest and Greatest
3 -
Customer Data Browser app
1 -
Data Analysis Tool
1 -
data migration
1 -
data transfer
1 -
Datasphere
2 -
Event Information
1,400 -
Event Information
66 -
Expert
1 -
Expert Insights
177 -
Expert Insights
299 -
General
1 -
Google cloud
1 -
Google Next'24
1 -
Kafka
1 -
Life at SAP
780 -
Life at SAP
13 -
Migrate your Data App
1 -
MTA
1 -
Network Performance Analysis
1 -
NodeJS
1 -
PDF
1 -
POC
1 -
Product Updates
4,577 -
Product Updates
345 -
Replication Flow
1 -
RisewithSAP
1 -
SAP BTP
1 -
SAP BTP Cloud Foundry
1 -
SAP Cloud ALM
1 -
SAP Cloud Application Programming Model
1 -
SAP Datasphere
2 -
SAP S4HANA Cloud
1 -
SAP S4HANA Migration Cockpit
1 -
Technology Updates
6,873 -
Technology Updates
427 -
Workload Fluctuations
1
Related Content
- ABAP Cloud Developer Trial 2022 Available Now in Technology Blogs by SAP
- Kyma Integration with SAP Cloud Logging. Part 2: Let's ship some traces in Technology Blogs by SAP
- SAP Build Code - Speed up your development with Generative AI Assistant - Joule in Technology Blogs by SAP
- SAP Datasphere - Space, Data Integration, and Data Modeling Best Practices in Technology Blogs by SAP
- What are the use cases of SAP Datasphere over SAP BW4/HANA in Technology Q&A
Top kudoed authors
| User | Count |
|---|---|
| 41 | |
| 25 | |
| 17 | |
| 14 | |
| 9 | |
| 7 | |
| 6 | |
| 6 | |
| 6 | |
| 6 |