SAP Crystal Reports for enterprise is the new report design tool that is being introduced with the SAP BusinessObjects BI 4.0 release. With this new release, the designer has been created "from the ground up" with the goal of streamlining the creation and modification of reports.
During the development phase of the new designer, the Crystal Reports development and user experience teams worked with an external research company to help us objectively monitor the behavior of a group of report creators during their normal tasks of creating and modifying reports. The report creators chosen had varying degrees of experience with existing versions of the Crystal Reports designer; however, none of them had ever worked with the new designer on which they were being monitored.
There were five areas that we wanted to focus on as part of the streamlining process:
- Data Connections
- Layout Related Features
- Object Formatting
- Groups, Sorts, and Totals
- Charts
I have provided a small sampling of the findings below to give you an idea of the feedback that went into the creation of the new designer.
Layout Related Features
The first usable version of the new Smart Guidelines feature (link to Madison's video) was included in the research study. As you can see from the screenshot below, it looked very different in its first incarnation.

The feedback from the users was that, while the smart guidelines feature provided a great means of repositioning fields and ensuring that fields were placed well relative to each other, there was no means of determining where exactly on the page a field should go. For example, the existing Crystal Reports designer has both rulers and gridlines available for positioning fields.
![]()
Based on the feedback, we introduced rulers back into the design canvas of Crystal Reports for enterprise.
![]()
The rulers can be turned on and off via the Edit > Preferences dialogue under the "Design Canvas" options. In addition, the unit of measurement for the rulers can be modified.
![]()
Object Formatting
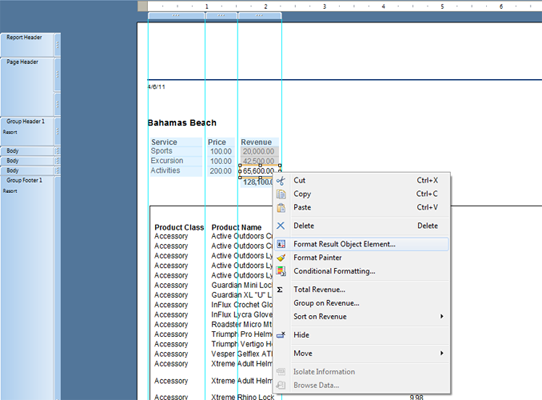
The initial right-click menu for objects (a.k.a., fields) in the design canvas looked like the screenshot below. There are two possible options when a report creator wanted to format a field. The first was accessed via the "Show Properties" menu item. This presented a dialogue that allowed report creators to change basic properties for the field. The second option was accessed via the "Formatting Expert" menu item, which led to formatting options based on conditions (a.k.a., conditional formatting).

The behaviour of the users in the study was to completely overlook the "Show Properties" menu item and jump straight to the menu item that had the word "Format" in the title expecting that this option would drop them into the the formatting options for the field. They were, instead, dropped into the conditional formatting dialogue.
In the existing version of Crystal Reports, we only have a single formatting option upon right-clicking a field: Format Field. This presents a contextual dialogue based on the type of field and also contains buttons that lead to the conditional formatting dialogue.
![]()
Based on the feedback, we changed the text for the menu items in the Crystal Reports for enterprise right-click menu.
Groups, Sorts, and Totals
I'll use the group and sort experts as the final example.
When creating the management dialogue for groups and sorts the development and user experience team knew that they wanted to keep them together as they found that report creators wanted to manage them both from the same location. The initial entry point for the group and sort management dialogue was via the insert group button accessed from the Insert tab of the design canvas.

The behaviour of the users was that they were unable to locate where to manage the groups and sorts. They were used to how the current Crystal Reports designer allows for this via two separate dialogues: one for managing groups and another for managing sorts.
![]()
The suggestion was to add direct to access to the group and sort management dialogue from both the top level Insert > Group and Insert > Sort buttons. In addition, users wanted to see the ability to add a sort by right-clicking on a group.
Based on the feedback, we changed how we allowed users to enter the group and sort management dialogue. We made it available via multiple locations:
- Insert > Group > Edit Groups
- Insert > Sort > Edit Sorts
- Data > Groups
- Data > Sorts
All of these access methods open the same dialogue that allows for modifying the existing groups and sorts for the report.

In addition, we added access to sort on a group directly via the right-click menu.
- Select Group > Righ-Click > Sort Group by Name
These are just three examples of how we modified the user interface for the SAP Crystal Reports for enterprise release based on the results of the user research study. In total, we had twenty three different areas of feedback across the five categories mentioned earlier. Most of them we addressed via changes in the user interface.
Thanks for reading.
Coy
