
- SAP Community
- Products and Technology
- Technology
- Technology Blogs by SAP
- New Business Process Monitoring functionalities in...
Technology Blogs by SAP
Learn how to extend and personalize SAP applications. Follow the SAP technology blog for insights into SAP BTP, ABAP, SAP Analytics Cloud, SAP HANA, and more.
Turn on suggestions
Auto-suggest helps you quickly narrow down your search results by suggesting possible matches as you type.
Showing results for
Former Member
Options
- Subscribe to RSS Feed
- Mark as New
- Mark as Read
- Bookmark
- Subscribe
- Printer Friendly Page
- Report Inappropriate Content
01-12-2010
4:21 AM
You’re using Business Process Monitoring (BPMon), but the standard monitoring functionalities don’t fulfill all your requirements? There’s an easy way to solve this problem: you can create your own data collector with the Customer Exit functionality of BPMon. This newly created data collector is then fully integrated into the existing BPMon framework and behaves just as any SAP-delivered standard monitor. How to achieve this? Have a closer look at this blog…
Preparation
What is needed to create and use your own BPMon data collector? As you have to develop your own piece of code you need to have of course some basic programming knowledge. From a technical point of view the following has to be ensured:
- On your managed system the latest ST-PI and ST-A/PI versions have to be available
- You have modeled a business process with different process steps in SAP Solution Manager to which you can assign your own monitoring object to. If you already utilize BPMon then these prerequisites will be fulfilled anyway.
All steps that are necessary to create customer-specific monitors are described in more detail in the setup guide that is available on SAP Service Marketplace (https://service.sap.com/bpm => Media Library => Technical Information => “Setup Guide - Customer Exit”).
Monitoring Requirement
Imagine you want to monitor whether a user on your managed system didn’t change its password within the last days although it was intended to do so. If a certain (configurable) amount of days is exceeded you want to get notified about the number of users which didn’t follow the regulations. SAP does not deliver a standard monitoring functionality that checks such a situation. But you can implement a data collector for this purpose on your managed system easily.
Setup in the managed system
In general, a BPMon data collector consists of two parts:
- The "customizing report": all stuff that will be visible in BPMon setup session, i.e. the names of monitoring objects and key figures, the definition of selection criteria, end user instructions etc.
- The data collector logic: your own piece of code
You should start with maintaining the customizing report. Execute report /SSA/EXM on the managed system the data collector should run on. In the following selection screen enter “ECU” and “CHANGE” in order to get to the maintenance screen. There, you have to perform the following steps:
1) Create your monitoring object:
- Assign suitable selection parameters to this monitoring object that will be used for data filtering,
- Enter instructions that will be visible in the BPMon setup session and that describe the setup procedure for the monitoring end user,
- Define the key figures that this monitoring object should offer,
- And add some further things like instructions on error handling (this should not be detailed here).
In our example, we start with defining Monitoring Object “Password Change Control”.

Next we provide the selection parameters for this monitoring object (1a). In our case only the “Number of days” a user should keep its old password should be configurable in the BPMon setup session. You should provide also instructions on this monitoring object (what is it about, how to set up this monitor – 1b). Then reasonable key figures need to be defined (1c).

2) Define your key figures:
- Again, assign suitable selection parameters (if necessary),
- And enter a guideline for the end user.
In our example we name the key figure we want to measure “Number of days since last change”. You could again provide selection parameters on this level (2a), but this is not necessary in our case. But some instructions for the end user (2b) will again be helpful.

The second part of the whole procedure is quite simple. You only need to implement your coding in the managed system. This has to be done in a report named Z_BPM_ECU_COLLECTOR. If it is not yet available on your managed system you have to create it by yourself. For each part of your data collector an own subroutine with a well-defined interface has to be maintained. Report /SSA/EXM provides templates for these subroutines which you can copy into Z_BPM_ECU_COLLECTOR. The interface itself must not be changed, but the rest of the coding can be adjusted to your own needs.

During runtime, these interfaces will provide the customizing of your monitoring object that was done in the BPMon setup session in SAP Solution Manager (like the maximum number of days the user can stick to its old password). Your coding has to return then all what is needed to build up an alert in BPMon: A measured value (how many users exceeded the threshold), the rating of the alert (green, yellow, or red), and a reasonable alert message that helps identifying the error situation. All this data has to be put into a table called OUTPUTTAB. All the rest (determining to what times the data collector should run, transferring the alerts to SAP Solution Manager, creating the alerts in BPMon session according to the Monitoring Schedule) is handled by the BPMon framework.

Setup in SAP Solution Manager
Once you have finished implementing your coding in the managed system you can start to set up monitoring in SAP Solution Manager. The setup procedure in the BPMon session works exactly the same way as for any other monitoring object of type “Application Monitor”. In case you already set up BPMon the following will be quite familiar to you. If not, learn how easy and fast everything can be carried out.
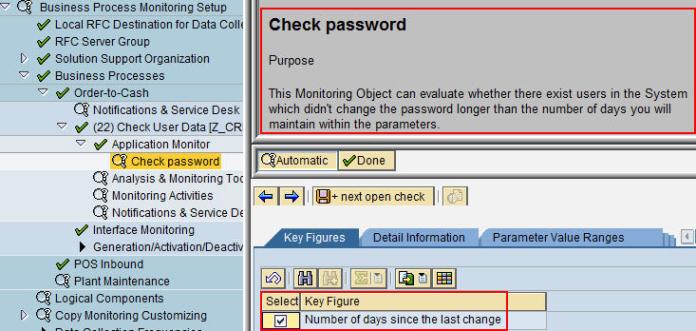
The first steps are rather generic. You have to choose the Business Process and the Business Process step your new Monitoring Object should be assigned to. In the below screenshot you can see that an extra step “Check User Data” in Business Process “Order to Cash” was defined for that. Next you have to define the Monitoring Type, which is “Application Monitor” in our case. Then, on the Monitoring Object level you call the F4 help in field Monitor Name, and you will find your new data collector “Password change control” together with the SAP standard monitoring objects. (If you don’t find it initially, press button “Load Monitors"). After saving a new entry for your Monitoring Object will be created in the navigation tree on the left side of the screen. Navigate to this so-called Monitoring Object level. There you first have to select the Key Figures you want to use. You will also see that the instructions for the end user are visible on the right-hand side now. In our case only one key figure, “Number of days since the last change” can be chosen for monitoring.
On tab “Detail information” you have to specify the filter criteria for monitoring, which in our case is the maximum number of days a user should keep its old password. You have to define also the times when your data collector should run, i.e. to what times alerts should be triggered. This is done in tab “Monitoring Schedule”. In the end, save your setup.

A subsequent level will be created which is the Key Figure level. There, you can maintain further filter criteria if available (not in our case), and you need to provide threshold values on which the alert rating will be based on. We decide to get a warning (yellow alert) if at least 5 users didn’t change their password, and a critical (red) alert for at least 20 users. Save, and activate the whole business process for monitoring which is done in navigation tree element “Generation/Deactivation/Activation”.

- SAP Managed Tags:
- SAP Solution Manager
Labels:
14 Comments
You must be a registered user to add a comment. If you've already registered, sign in. Otherwise, register and sign in.
Labels in this area
-
ABAP CDS Views - CDC (Change Data Capture)
2 -
AI
1 -
Analyze Workload Data
1 -
BTP
1 -
Business and IT Integration
2 -
Business application stu
1 -
Business Technology Platform
1 -
Business Trends
1,658 -
Business Trends
91 -
CAP
1 -
cf
1 -
Cloud Foundry
1 -
Confluent
1 -
Customer COE Basics and Fundamentals
1 -
Customer COE Latest and Greatest
3 -
Customer Data Browser app
1 -
Data Analysis Tool
1 -
data migration
1 -
data transfer
1 -
Datasphere
2 -
Event Information
1,400 -
Event Information
66 -
Expert
1 -
Expert Insights
177 -
Expert Insights
293 -
General
1 -
Google cloud
1 -
Google Next'24
1 -
Kafka
1 -
Life at SAP
780 -
Life at SAP
12 -
Migrate your Data App
1 -
MTA
1 -
Network Performance Analysis
1 -
NodeJS
1 -
PDF
1 -
POC
1 -
Product Updates
4,577 -
Product Updates
340 -
Replication Flow
1 -
RisewithSAP
1 -
SAP BTP
1 -
SAP BTP Cloud Foundry
1 -
SAP Cloud ALM
1 -
SAP Cloud Application Programming Model
1 -
SAP Datasphere
2 -
SAP S4HANA Cloud
1 -
SAP S4HANA Migration Cockpit
1 -
Technology Updates
6,873 -
Technology Updates
417 -
Workload Fluctuations
1
Related Content
- SAP CAP: Controller - Service - Repository architecture in Technology Blogs by Members
- Accelerate Business Process Development with SAP Build Process Automation Pre-Built Content in Technology Blogs by SAP
- Hack2Build on Business AI – Highlighted Use Cases in Technology Blogs by SAP
- Capture Your Own Workload Statistics in the ABAP Environment in the Cloud in Technology Blogs by SAP
- Empowering Retail Business with a Seamless Data Migration to SAP S/4HANA in Technology Blogs by Members
Top kudoed authors
| User | Count |
|---|---|
| 34 | |
| 25 | |
| 12 | |
| 7 | |
| 7 | |
| 6 | |
| 6 | |
| 6 | |
| 5 | |
| 4 |