In this two part blog series we will take a look how you can use Crystal Reports in combination with SAP BW hierarchies and how you can use the conditional formatting features from Crystal Reports to establish a proper drill down path following the hierarchical structure.
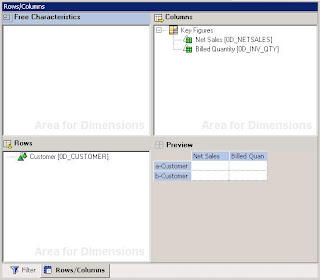
In our case we are going to use a BW query based on InfoProvider Dalsegno Company Sales Data (0D_DX_C01). I am using a very simple query to focus on the hierarchical structure.
1. Now we can start Crystal Reports and in case you installed everything properly the SAP toolbar will should show up in Crystal Reports Designer and you should also see the menu SAP.
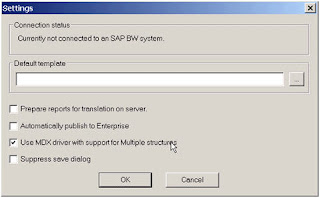
2. Select the SAP menu, select Settings. The Settings dialog appears.
3. Select Use MDX driver with support for Multiple structures and select OK.
4. Now you want to make sure that you settings in Crystal Reports allow to view the technical names and the description of the metadata that you will see from SAP BW.
5. Select the menu File > Options > Database and set the option “‘Show Description’

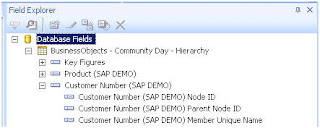
Now the Field Explorer will show SAP metadata instead of the technical name for the fields.
6. In the SAP toolbar, select Create new report from a query. The SAP System dialog appears.

7. Select the SAP system in the SAP Logon Pad and logon with your SAP credentials.
8. Select the BW query from the roles dialog and Crystal Reports will then create a new report with the BW query set as data source.
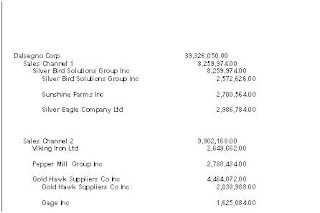
9. The activated hierarchy from the underlying SAP BW query will result in a parent-child relationship being represented in Crystal Reports.
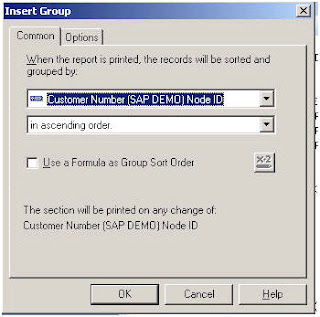
10. Select the menu Insert > Group.
11. Select the Node ID field from the hierarchy. In our example customer node ID.
12. Navigate to the Options tab.
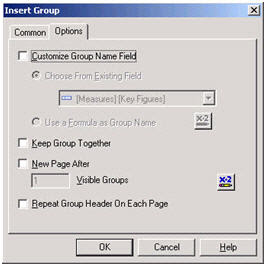
13. Select the Customize Group Name Field option.
14. Select the description value for the hierarchy to the Medium Name from the characteristic Customer
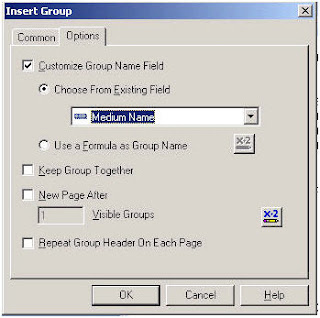
15. Click OK.
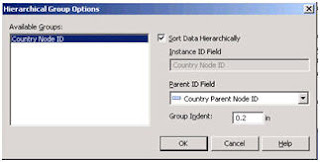
16. Select the menu Report > Hierarchical Grouping options.
17. Select the Sort Data Hierarchically option.

18. Select the Parent Node ID field of the Customer Hierarchy.

19. Define the Group Indent to be 0.2 inches
20. Click OK.
21. Hide the detail section of your report.
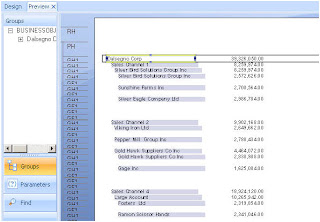
22. Select the menu View > Print Preview.

As you can see Crystal Reports is providing you the hierarchical structure.
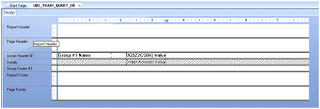
22. Navigate to the Design tab.
23. Add a keyfigure to the details section of the report.
24. Right-click the added keyfigure.
25. Select the menu Insert > Summary.

26. Select Sum as the calculation option.
27. Select Group #1 for the summary location.
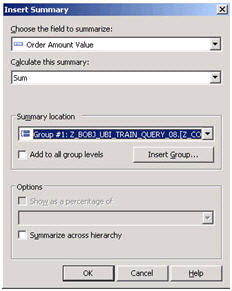
The option “Summarize across hierarchy” allows creating a group summary by adding values from the lower level of a hierarchy up to a higher aggregated level. An example would be to summarize salary figures from the lowest level of an organization hierarchy up to the top level of the hierarchy. In the case of an SAP BW query as a data source the option “Summarize across hierarchy” is not necessary because the underlying SAP BW query returns the aggregated values for all hierarchy nodes to Crystal Reports.
28. Move the summary to the Group Header #1.
29. Hide the Group Footer #1 in the report design.
30. Preview the report.
Conditional Formatting Part I
Crystal Reports designer offers some additional formulas and functions that allow the user to create a better report design and provide conditional formatting even in the context of a hierarchy.
Formula Hierarchy Level
The first formula for hierarchical reporting is the formula HierarchyLevel(). The formula HierarchyLevel() allows retrieving the level of the hierarchical grouping.
The formula needs a GroupLevel as input.
The following is an example for the formula syntax assuming Customer Node ID is the grouping field in the report:
HierarchyLevel (
GroupingLevel (
{Customer Node ID}
)
)
Count Hierarchical Children
The second formula is CountHierarchicalChildren() which allows counting the number of children of a hierarchy level. The formula needs a GroupLevel as input.
The following is an example for the formula syntax assuming Customer Node ID is the grouping field in the report:
CountHierarchicalChildren(
GroupingLevel (
{Customer Node ID}
)
)
The count of children refers to the number of children in the hierarchy level.
With the formulas the report can be conditionally formatted so that the group headings follow an indentation and the keyfigures stay aligned.
31. Navigate to the Design tab.
32. Select the menu Report > Hierarchical Grouping Options.
33. Set the option Group Indent to 0.
34. Click OK.
35. Right-click the Group #1 Name field.
36. Select the menu Size and Position.

37. Click the icon for conditional formatting for the X-axis value.
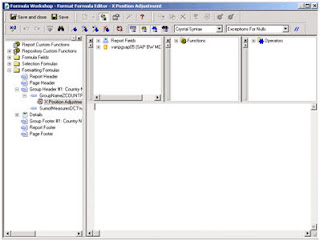
38. Enter the following formula:
(HierarchyLevel
(GroupingLevel(
{Hierarchy Node ID} ) ) )
*150
39. Click Save and close.
40. Click OK.
41. Select the menu View > Print Preview.
The Group Header field is now moved by a variable number of pixes (the hierarchy level multiplied by 150) and the numbers are still aligned.
In the second part we will take a look how we can still leverage the Drill down feature in Crystal Reports using the conditional formatting.


